

Anyone who trades forex understands the frustration of catching a fakeout or entering a trade too early. For me, the Aroon Indicator was the tool that helped solve this problem by focusing on ‘time’ instead of just ‘price’, helping us identify a real trend versus just a consolidation period.
The Aroon Indicator, developed by Tushar Chande, measures how long it’s been since a price hit its highest or lowest point over a set period. It’s not just about price—it’s about time, which makes it unique.
In this guide, I’ll walk you through how it works, how to read its signals, the best settings for forex, and practical strategies to use it effectively. Whether you’re trading EUR/USD or exploring new tools, this article will give you clear steps to make the Aroon Indicator your go-to for smarter trades. Ready to dive in? Let’s get started.
Key Takeaways
- Purpose: The Aroon Indicator identifies trends and consolidation in forex markets by measuring time since recent highs and lows.
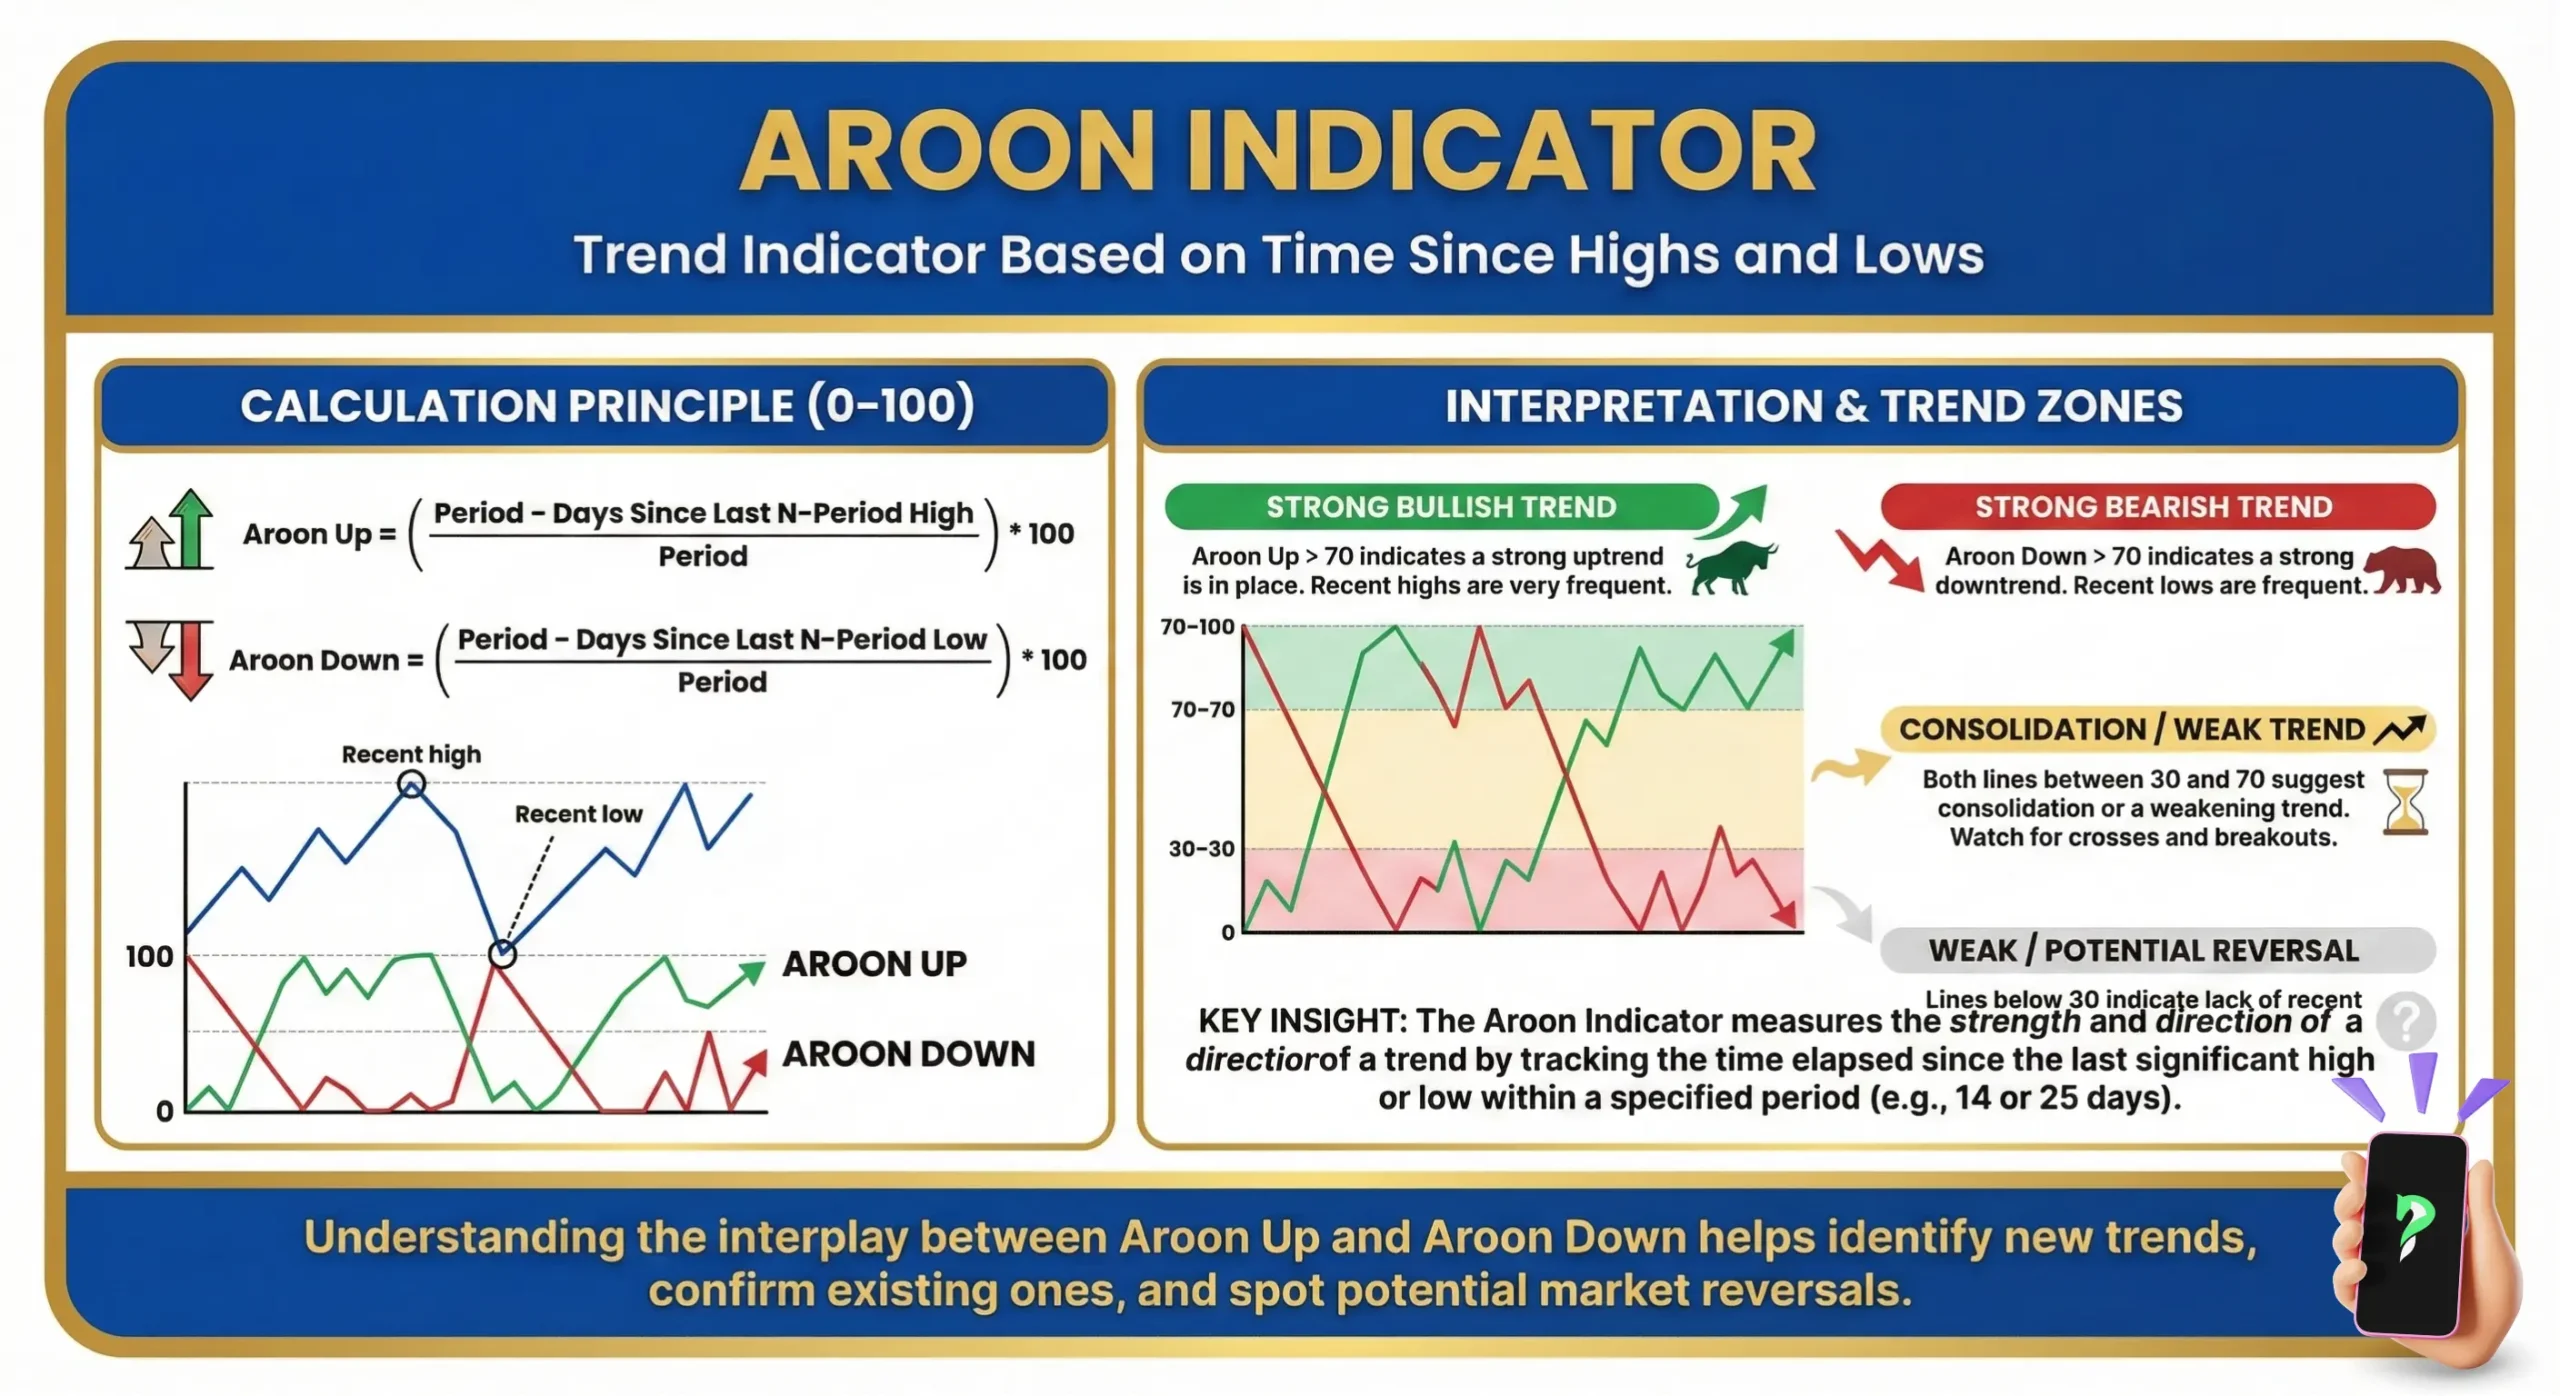
- Components: Includes Aroon Up, which measures the time since the most recent peak, and Aroon Down, which tracks the time since the most recent trough. Both indicators range from 0 to 100.
- Signals: An uptrend is indicated when Aroon Up is above 50 and approaching 100. A downtrend is suggested when Aroon Down exceeds 50. If both values remain under 50, the market is likely in a consolidation phase.
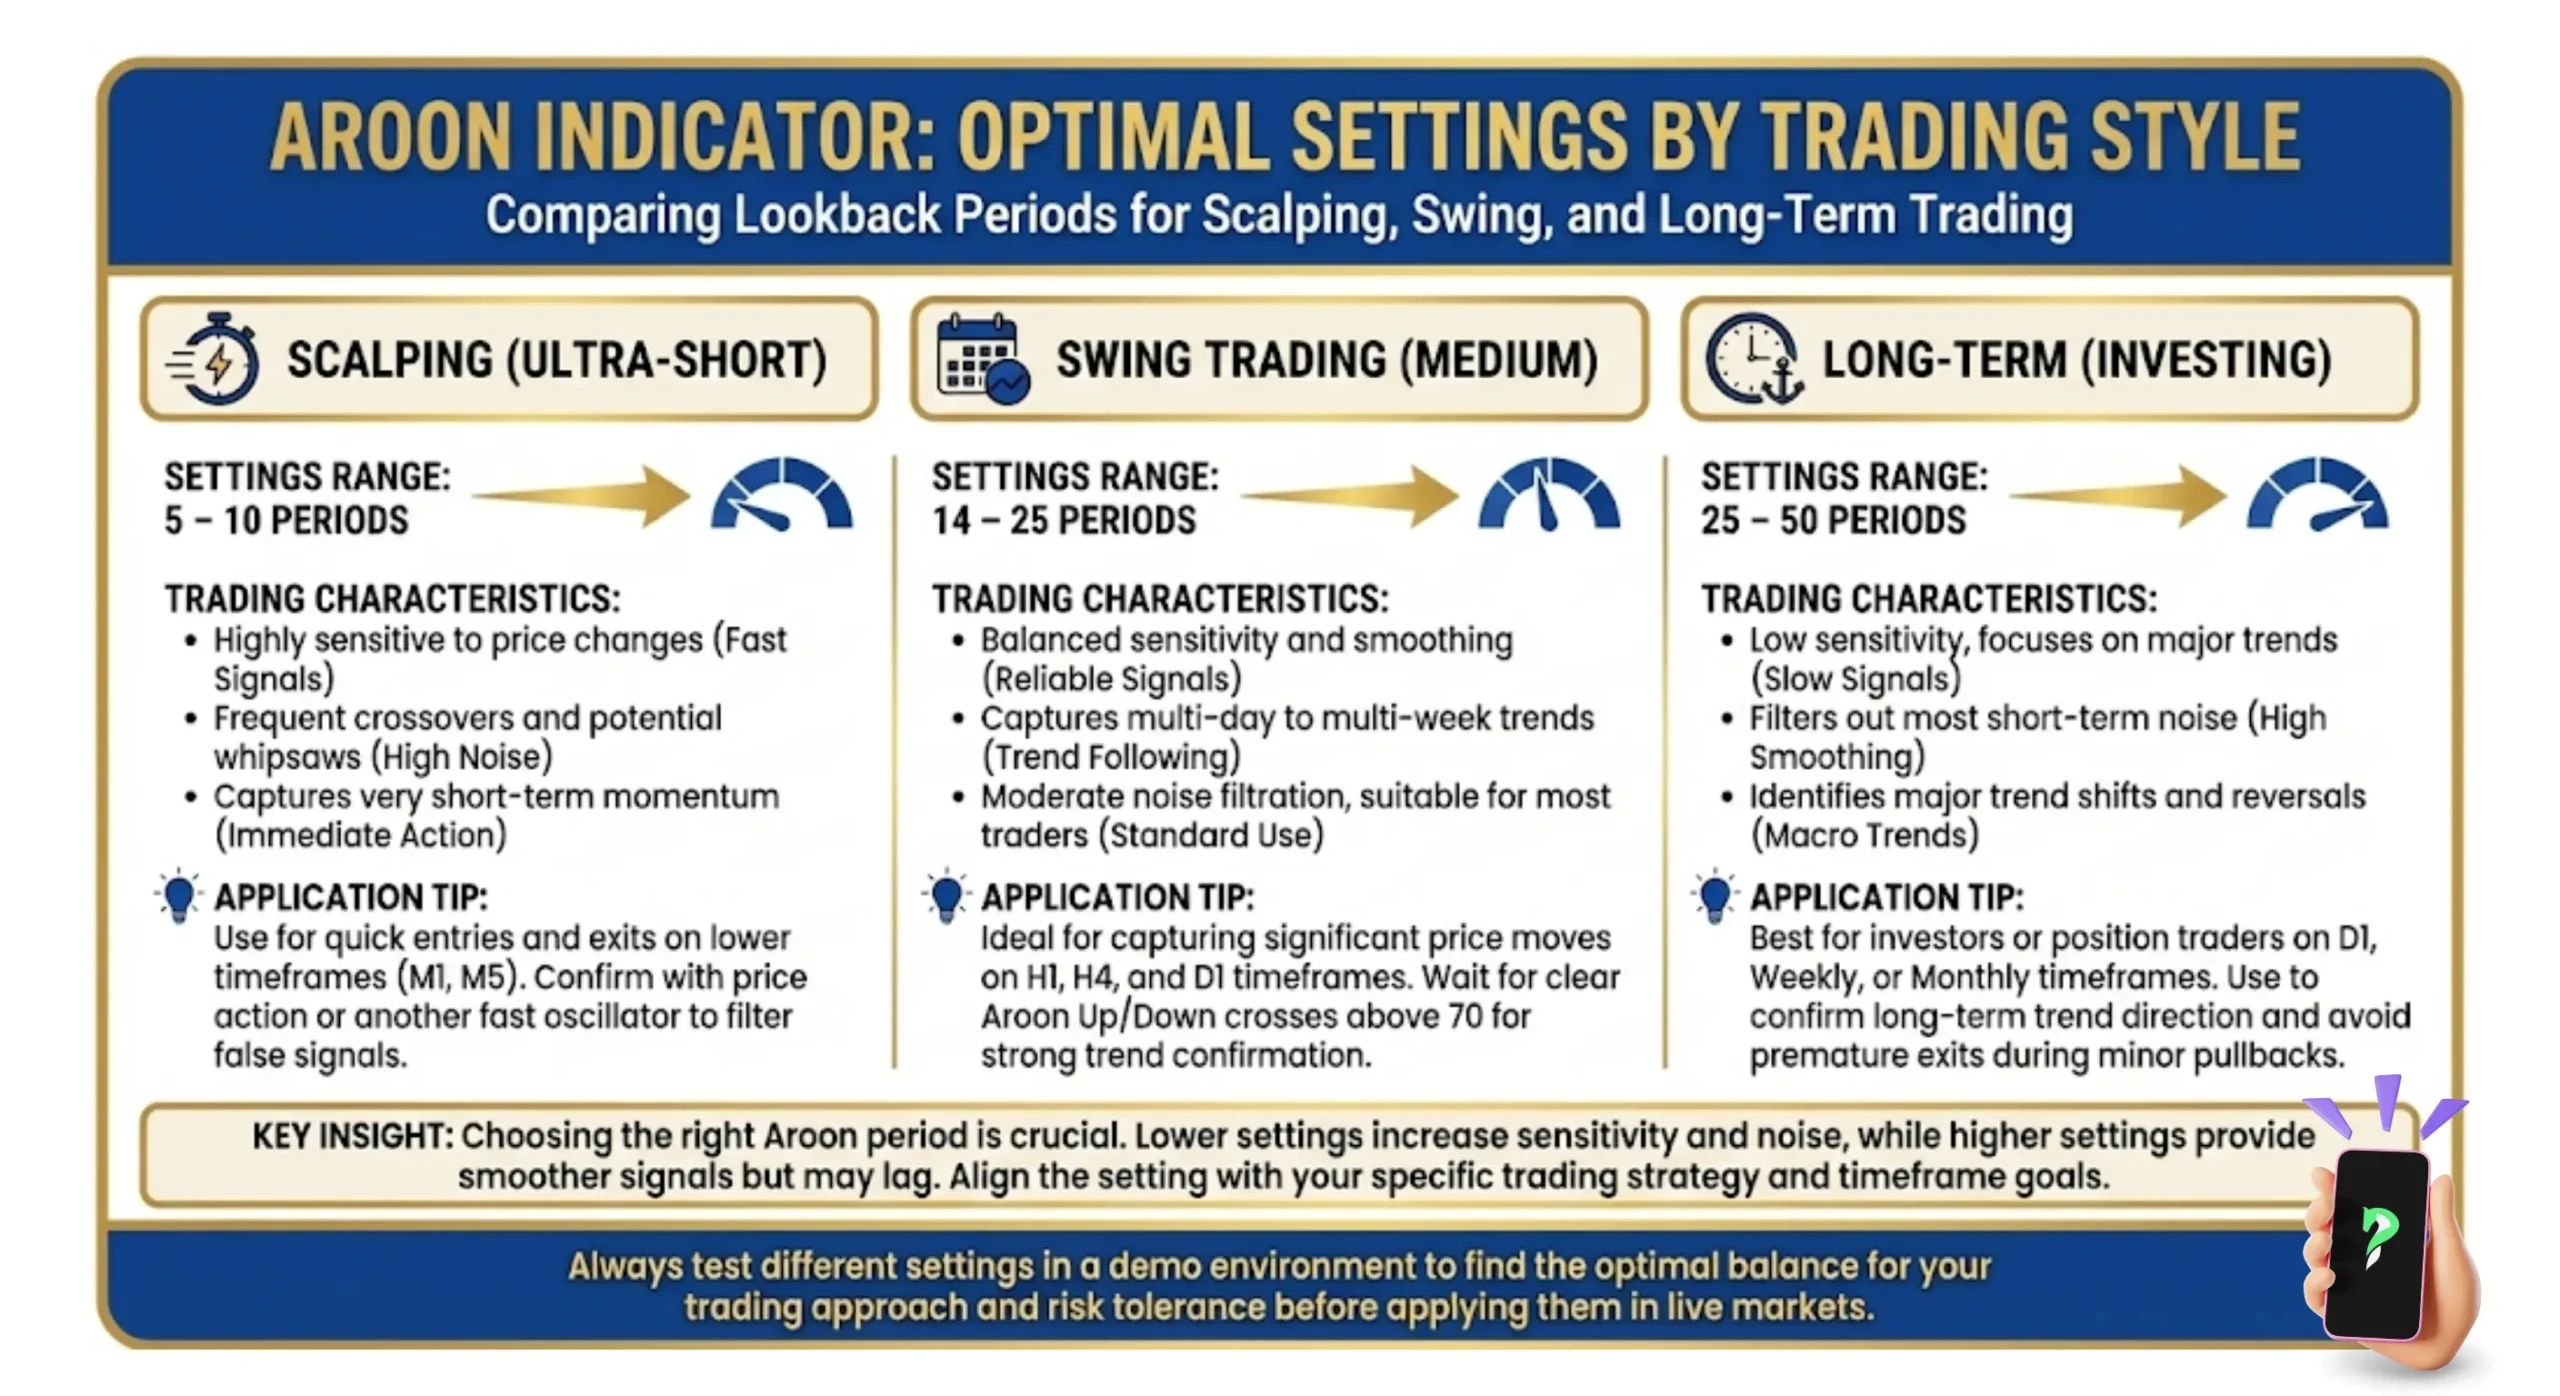
- Settings: Default 14-period works for most forex pairs; use 5–10 for scalping, 14–25 for swing trading, 25–50 for long-term trading.
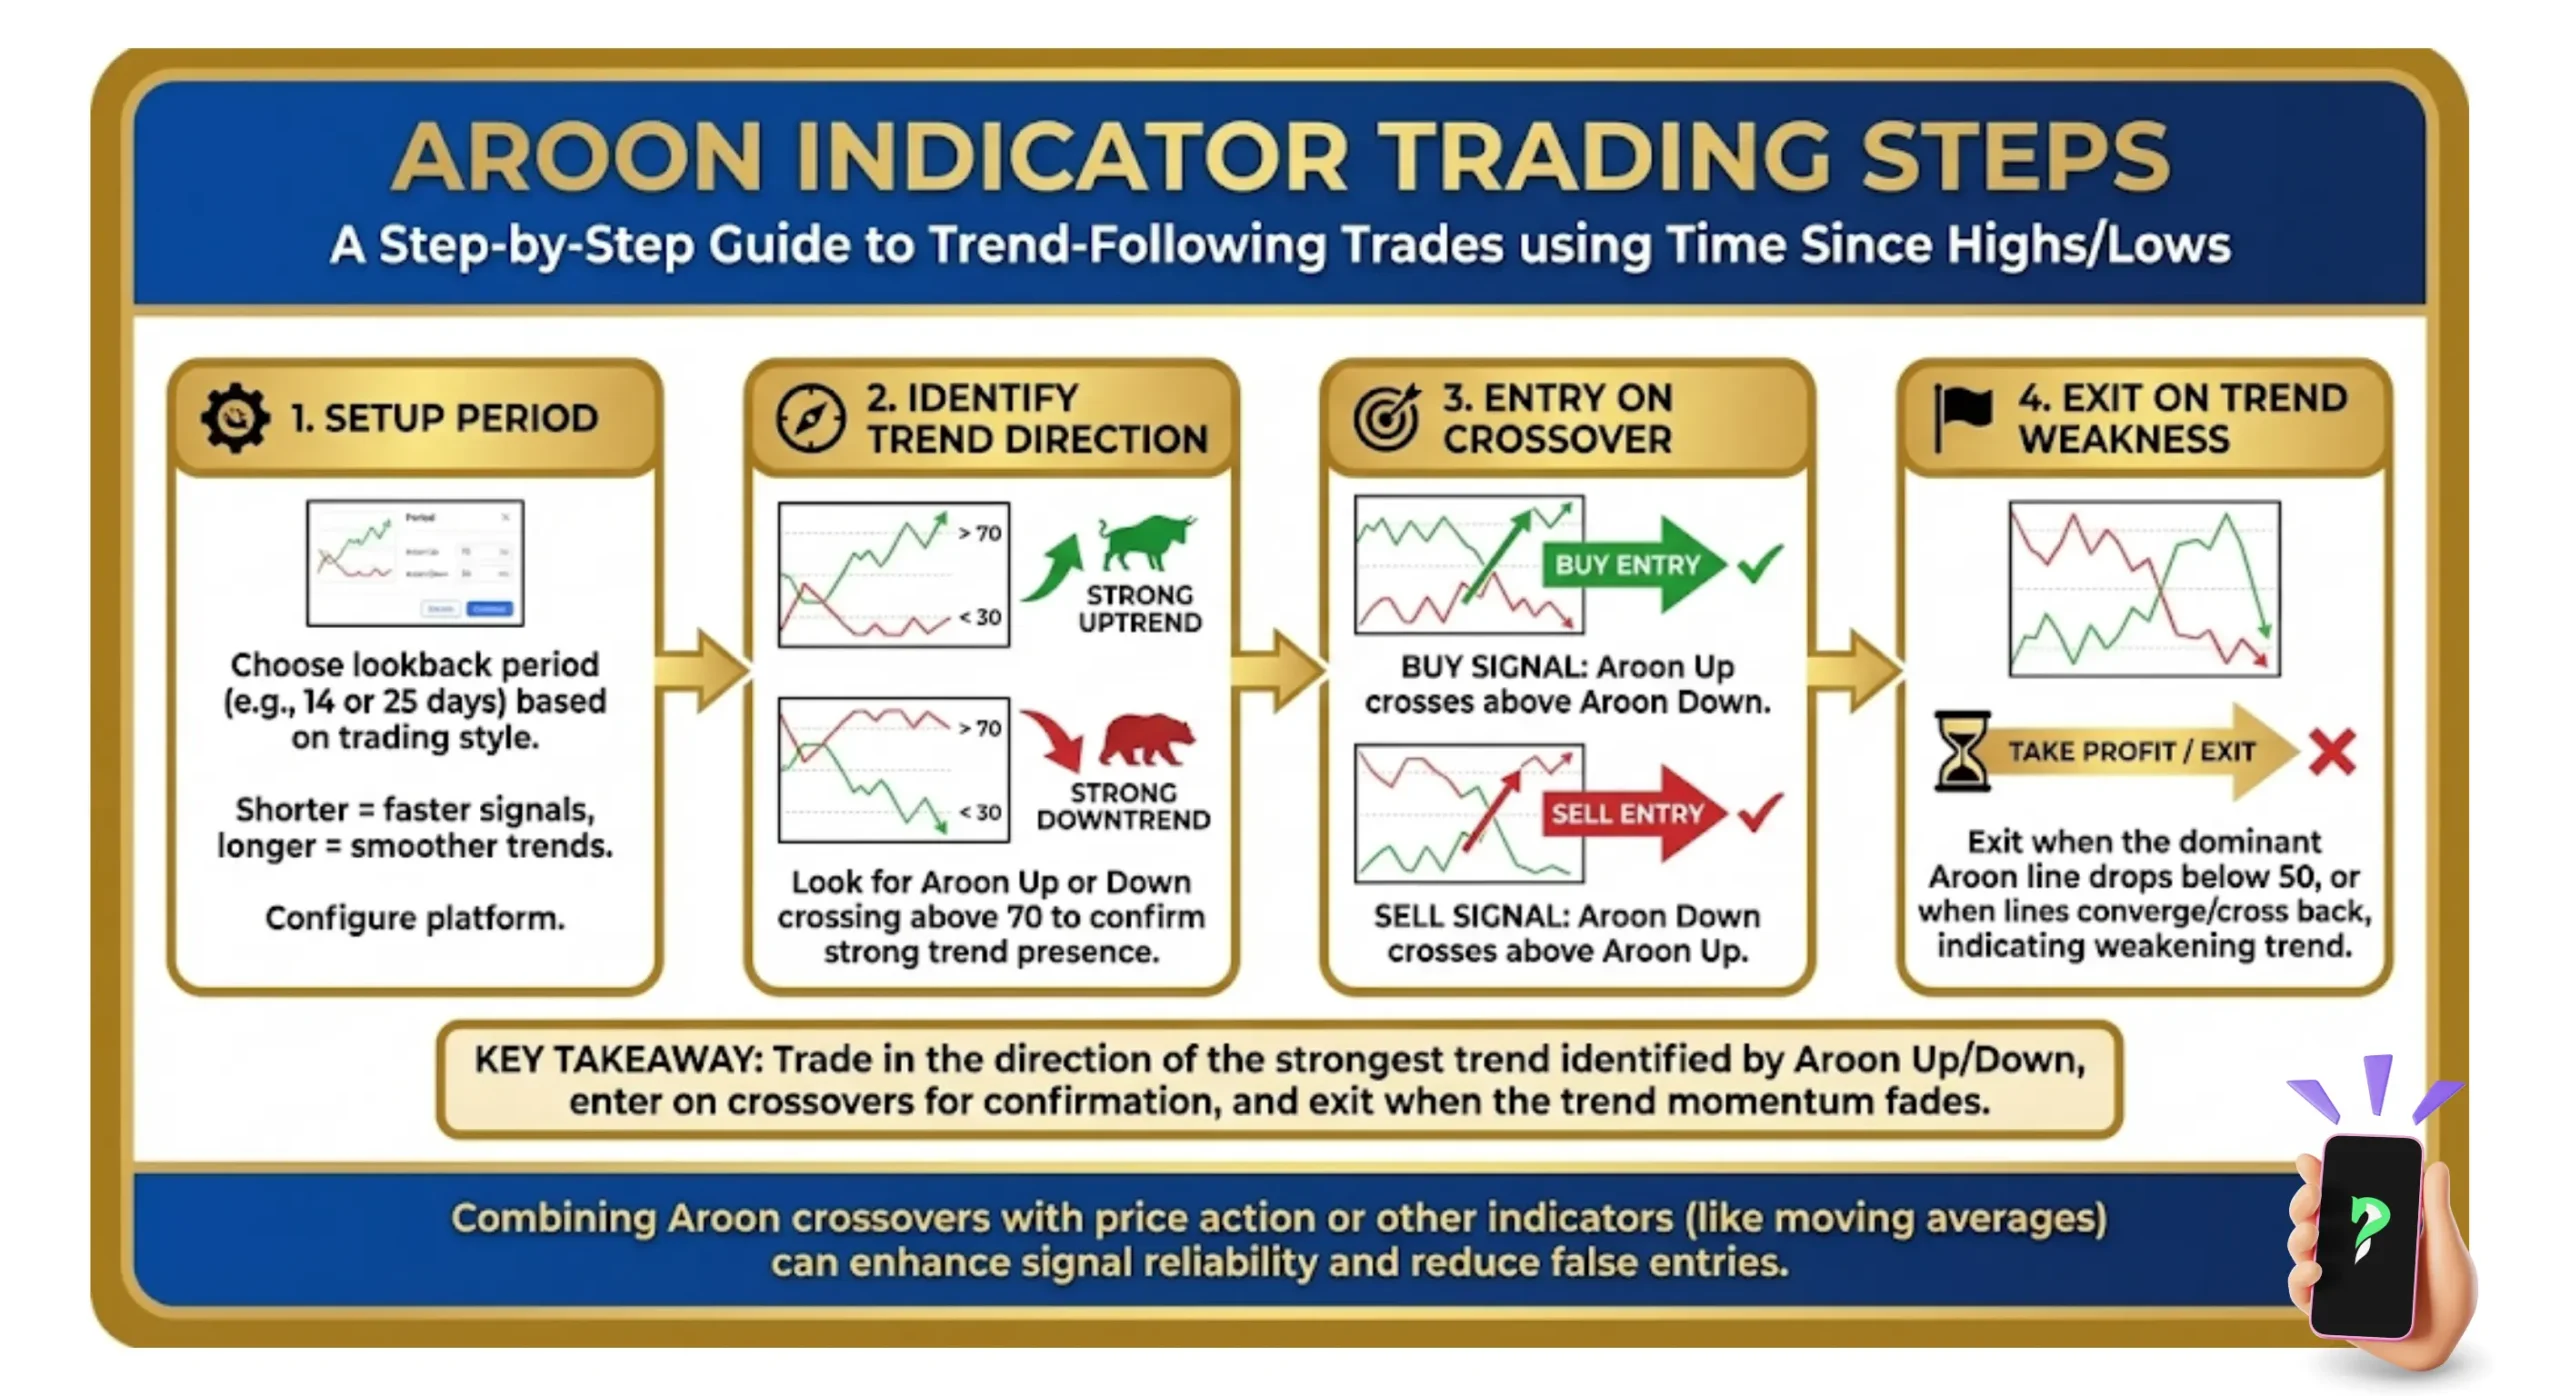
- Strategies: Trend-following (enter on crossovers, exit when trend weakens) and consolidation breakout (trade after range-bound periods).
- Strengths and limitations: Great for trend spotting and simplicity, but lags in sudden reversals and needs pairing with other tools like moving averages or RSI.
1. What is the Aroon Indicator?
Created by Tushar Chande in 1995, Aroon Indicator takes its name from a Sanskrit term meaning ‘first light of dawn,’ reflecting its design to detect emerging trends at an early stage — a key factor in leveraging the Aroon Indicator effectively.
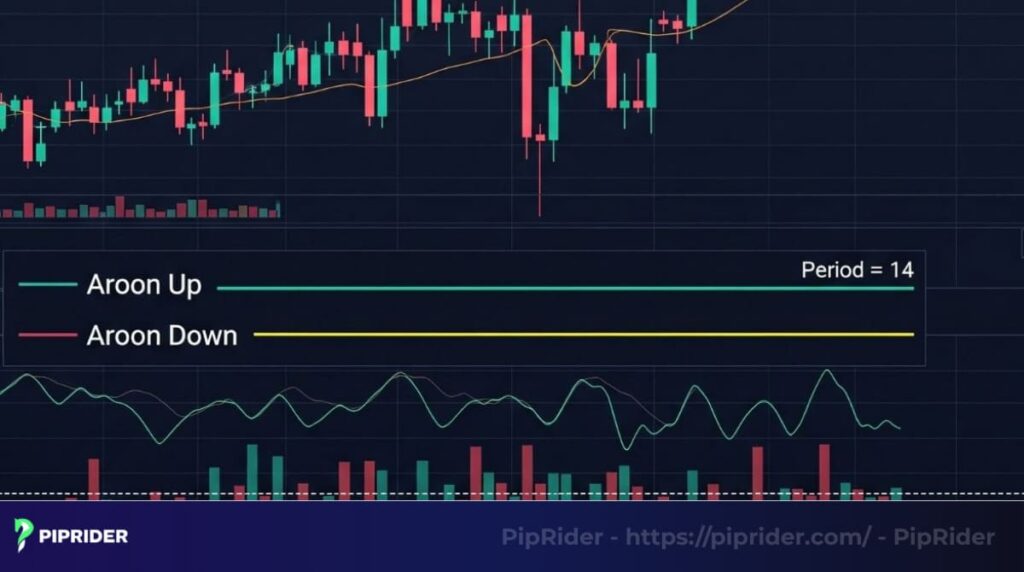
The Aroon Indicator features two separate lines:
- Aroon Up: Measures how long it’s been since the price hit its highest point over a set period,
- Aroon Down: Tracks the time since the lowest low.
Both lines move on a scale from 0 to 100, showing trend strength. I’ve found it especially useful for pairs like EUR/USD, where catching trends early can make a big difference. Unlike other indicators that focus on price, Aroon emphasizes time, making it a unique tool for traders.
2. How the Aroon Indicator works
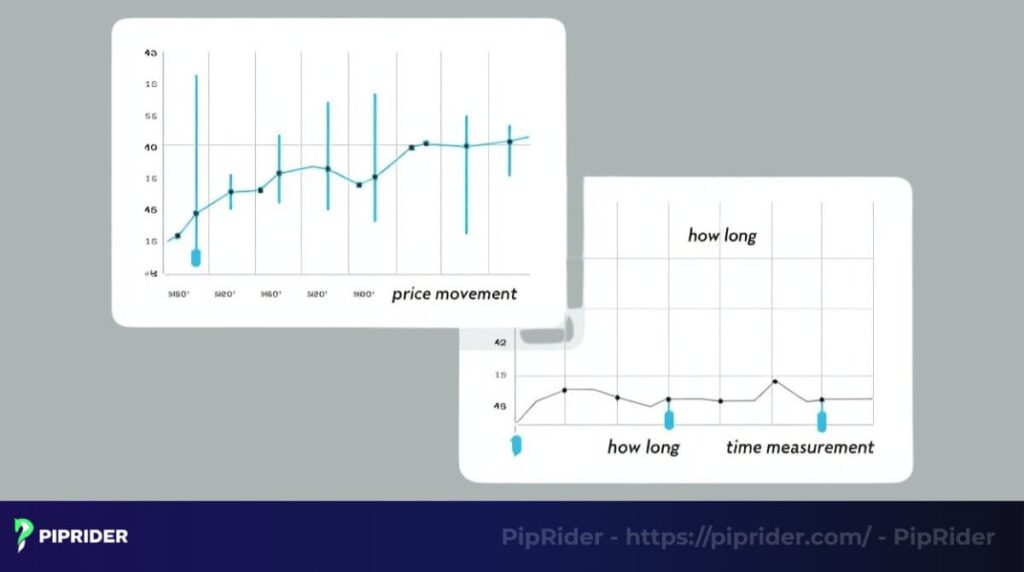
To understand how Aroon Indicator works, we need to shift our perspective slightly. Instead of focusing on how far the price has moved, it measures “how long” it has been since the price hit its most recent high or low within a period. This very shift in thinking provides a fresh perspective on market momentum, helping to spot trends or pauses in the market.
How is the Aroon Indicator calculated?
The Aroon Indicator uses two formulas: Aroon Up = [(Period – Days Since Highest High) / Period] x 100, and Aroon Down = [(Period – Days Since Lowest Low) / Period] x 100. For a 14-day period, if the highest high was 3 days ago, Aroon Up is [(14 – 3) / 14] x 100 = 78.6. This simple math makes it easy to understand trend strength.
Each line is shown as a percentage ranging from 0 to 100. For instance, if the most recent high occurred 2 days ago within a 14-day timeframe, Aroon Up would be calculated as [(14 − 2) ÷ 14] × 100, resulting in 85.7.
A high value near 100 signals a strong trend, while a low value near 0 suggests weakness. I’ve noticed this works well on volatile pairs like GBP/USD, where timing is key.
Here’s a quick breakdown of what the values mean:
| Value range | Meaning |
| 70–100 | Strong trend (up for Aroon Up, down for Aroon Down) |
| 0–30 | Weak trend or no clear direction |
| ~50 | Neutral, trend could go either way |
3. How to read the Aroon Indicator
To know how to read Aroon Indicator effectively, the key is to grasp the meaning of the Aroon Up and Aroon Down lines. They aren’t just lines; they are a measure of whether bulls or bears are dominating in terms of time, which helps you spot whether a currency pair is trending up, down, or just drifting sideways.
By watching how the Aroon Up and Down lines move, you can make smarter trading choices.
3.1. Understanding the signals
The Aroon Indicator gives three main signals based on its two lines:
Uptrend: An uptrend is signaled when Aroon Up rises above 50 and approaches 100, with Aroon Down remaining under 50. This shows the price is hitting recent highs, suggesting a bullish move. For example, I’ve seen this work well on AUD/USD 4-hour charts.
Downtrend: Aroon Down climbs above 50 toward 100, with Aroon Up below 50. This signals recent lows are dominating, hinting at a bearish trend.
Consolidation: Both lines drop below 50 and move together, showing no strong trend. This often happens when markets are quiet, like during low-volatility sessions.
3.2. Spotting crossovers
Crossovers are key to reading the Aroon Indicator. A potential uptrend is indicated when Aroon Up moves above Aroon Down.
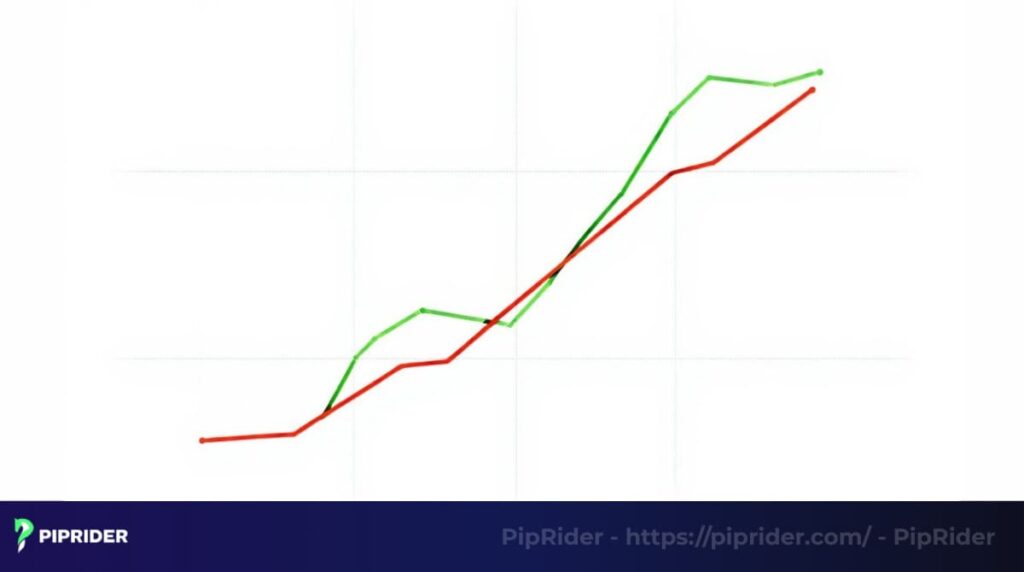
Conversely, when Aroon Down overtakes Aroon Up, it may signal the beginning of a downtrend. I’ve found crossovers on daily charts, like for USD/JPY, often signal reliable trend changes.
4. Best Aroon Indicator settings for forex trading
There is no single perfect setting, and finding the best Aroon Indicator settings requires experimentation. My experience shows that adjusting the indicator’s period to match your trading style and the volatility of each currency pair is what makes the difference between a noisy signal and a real opportunity.
Let’s break down the best Aroon Indicator settings to help you trade smarter.
4.1. Choosing the right period
Don’t just accept the default—master it. The standard 14-period setting is a fantastic starting point, a reliable ally that finds the perfect balance between spotting a trend early and giving you a clear, confident signal on daily or 4-hour charts.
But your trading is unique, and your settings should be too. Ready for a faster pace? For scalpers who crave quick action, a shorter 5–10 period is your secret weapon to catch lightning-fast price moves, though you’ll need a sharp eye for the extra noise. Prefer to ride the big waves?
For swing and long-term traders, a longer 25–50 period is your way to filter out the market’s chatter, giving you a crystal-clear view of the powerful, long-lasting trends that can make all the difference.
4.2. Settings by trading style
This isn’t a one-size-fits-all game; it’s about finding the perfect fit for your trading style. Your settings should be a reflection of how you see and conquer the market.
- Scalping: Use 5–10 periods for fast signals on pairs like USD/JPY.
- Swing trading: Stick with 14–25 periods for pairs like EUR/USD.
- Long-term trading: Try 25–50 periods for stable pairs like EUR/CHF.
Remember, these are just starting points. The most successful traders are the ones who experiment. Dive into a demo account, play with these settings, and find the combination that truly feels like an extension of your own trading instincts.
| Trading style | Period | Best for |
| Scalping | 5–10 | Volatile pairs (e.g., USD/JPY) |
| Swing trading | 14–25 | Balanced pairs (e.g., EUR/USD) |
| Long-term trading | 25–50 | Stable pairs (e.g., EUR/CHF) |
5. Aroon Indicator strategy for forex trading
An indicator is just a tool, you are the master of the strategy. The Aroon Indicator isn’t meant to sit idly on your chart; it’s a powerful ally waiting for you to unleash its potential. With it, you can take control of your trading with two highly effective approaches: trend-following and consolidation breakouts.

This isn’t about guesswork. This is your chance to build a practical, powerful Aroon Indicator strategy, perfectly paired with disciplined risk management to protect your capital and empower your decisions. Let’s make every trade a confident, calculated move.
5.1. Trend-following strategy
This strategy focuses on riding a strong trend. Here’s how it works:
- Enter a long trade: When Aroon Up crosses above Aroon Down and climbs toward 70–100, it signals a potential uptrend. For example, I’ve used this on AUD/USD 4-hour charts to catch bullish moves.
- Exit the trade: Close the position when Aroon Up drops below 50, suggesting the trend is weakening.
- Risk management: Set a stop-loss below the recent low to protect against sudden reversals.
5.2. Consolidation breakout strategy
This is where the real excitement begins when a quiet, sideways market is on the verge of an explosive move. This strategy is your secret weapon for capturing that energy and turning it into profit.
- Wait for the Calm: First, you’ll feel the market’s suspense. Both Aroon Up and Down will be drifting below 50, moving side-by-side. This isn’t a sign of boredom; it’s a calm before the storm, and you’ll be one of the few who know it.
- Strike with Confidence: The moment the silence breaks, you’ll be ready. When Aroon Up surges past 50, that’s your green light to buy—the bulls are taking control. If Aroon Down takes the lead, it’s a clear signal to sell—the bears have seized the moment. I’ve witnessed this firsthand on USD/CAD daily charts; it’s a powerful feeling.
- Protect Your Win: Your success isn’t just about winning; it’s about trading smartly. Always place a stop-loss just outside that old, tight range. This simple step protects you from sudden reversals and lets you trade fearlessly.
Want to supercharge your accuracy? I often confirm these Aroon signals with a simple moving average. It’s like having a second opinion from a trusted expert. But before you go live, a quick tip: test everything on a demo account. Build that rock-solid confidence, and you’ll be unstoppable.
5.3. Combining the Aroon indicator with other indicators
To maximize the Aroon Indicator’s effectiveness, combining it with other technical indicators can help confirm signals and reduce false entries. Here are some powerful combinations I’ve tested that work well in forex trading:
- Aroon + Moving Averages: Use a simple moving average (SMA) or exponential moving average (EMA) to confirm trend direction. For example, on a 4-hour EUR/USD chart, enter a long trade when Aroon Up crosses above Aroon Down and the price is above a 50-period SMA. This filters out weak signals in choppy markets.
- Aroon + RSI: Pairing Aroon with the Relative Strength Index (RSI) helps identify overbought or oversold conditions. For instance, if Aroon Up is above 70, signaling a strong uptrend, but RSI is above 70 (overbought), consider waiting for a pullback before entering. This works well for volatile pairs like GBP/USD.
- Aroon + Bollinger Bands: Use Bollinger Bands to spot breakout opportunities after consolidation. When Aroon Up and Down are both below 50 (indicating consolidation) and the price breaks above the upper Bollinger Band, it’s a strong signal for a potential uptrend. I’ve seen this work effectively on USD/CAD daily charts.
- Aroon + Support/Resistance Levels: Combine Aroon with key support and resistance levels to validate trade entries. For example, if Aroon Down crosses above Aroon Up near a strong resistance level on AUD/USD, it reinforces a potential short trade.
Tips for combining indicators:
- Avoid overloading your chart with too many indicators, as this can lead to analysis paralysis. Stick to one or two complementary tools.
- Test combinations on a demo account to find what works best for your trading style and currency pair.
- Adjust timeframes and settings to match your strategy (e.g., shorter periods for scalping, longer for swing trading).
By combining the Aroon Indicator with these tools, you can make more informed decisions and improve your trading accuracy. Always backtest your strategy to ensure it suits your risk tolerance and market conditions.
6. Aroon Indicator explained: Strengths and limitations
Any article titled Aroon Indicator explained must cover both sides of it. Like any other technical analysis tool, understanding its strengths (like early trend identification) and its weaknesses (like lagging in sudden volatile markets) is crucial to using it wisely.
Let’s dive into what makes the Aroon Indicator shine and where it might fall short, so you can trade with confidence.
6.1. Strengths of the Aroon Indicator
The Aroon Indicator has some clear advantages:

- Trend spotting: It excels at catching new trends early, especially for pairs like EUR/USD.
- Consolidation detection: It shows when markets are range-bound, helping you avoid choppy trades.
- Easy to use: The 0–100 scale is simple to read, even for newer traders.
6.2. Limitations to watch out for
No indicator is perfect, and the Aroon Indicator has its limits:
Limitations to watch out for
- Lagging signals: It relies on past highs and lows, so it may miss sudden reversals.
- Weak in choppy markets: Without other tools, it can give false signals in messy price action.
- Needs testing: I’ve found you need to tweak settings for different pairs, like shorter periods for USD/JPY.
To get the most out of it, I pair the Aroon Indicator with tools like support levels or RSI to confirm signals. This balance keeps your trades sharper and reduces guesswork.
7. Related questions about the Aroon Indicator (FAQs)
While learning and using this indicator, I’ve compiled a few questions that traders often ask. Clarifying these points will help you use this tool with more confidence.
8. Conclusion
The Aroon Indicator has become one of my go-to tools for navigating the forex market, and I hope this guide helps you see why. Its ability to spot trends and consolidation periods makes it a must-have for traders aiming to make smarter decisions.
Whether you’re trading USD/JPY or just starting out, the Aroon Indicator offers clear signals when used with the right settings and strategies. I’ve found combining it with tools like moving averages can take your trades to the next level.
Ready to try it? Test the Aroon Indicator on a demo account to get comfortable with its signals. For more tips, check out the Pip Rider blog, especially our “best technical indicators” and “For Beginner” categories. They’re packed with insights to boost your trading.
Infographic Section
-
Aroon Indicator -
Aroon Indicator: Trading Steps -
Aroon Indicator: Optimal Settings by Trading Style


