

Anyone who trades forex understands the frustration of entering a trade prematurely or getting caught in a ‘fakeout.’ The Aroon Indicator solves this structural issue by shifting the analytical focus from price magnitude to time.
Developed by Tushar Chande, the Aroon Indicator measures the exact number of periods since a price reached its highest or lowest point. By quantifying this temporal momentum, it allows traders to distinguish between a genuine trend and a temporary consolidation phase. This guide provides a complete technical breakdown of the Aroon Indicator, covering its mathematical foundation, optimal Forex settings, and professional execution playbooks.
Key Takeaways
-
- Purpose: The Aroon Indicator identifies trends and consolidation in forex markets by measuring time since recent highs and lows.
-
- Components: Includes Aroon Up, which measures the time since the most recent peak, and Aroon Down, which tracks the time since the most recent trough. Both indicators range from 0 to 100.
-
- Signals: An uptrend is indicated when Aroon Up is above 50 and approaching 100. A downtrend is suggested when Aroon Down exceeds 50. If both values remain under 50, the market is likely in a consolidation phase.
-
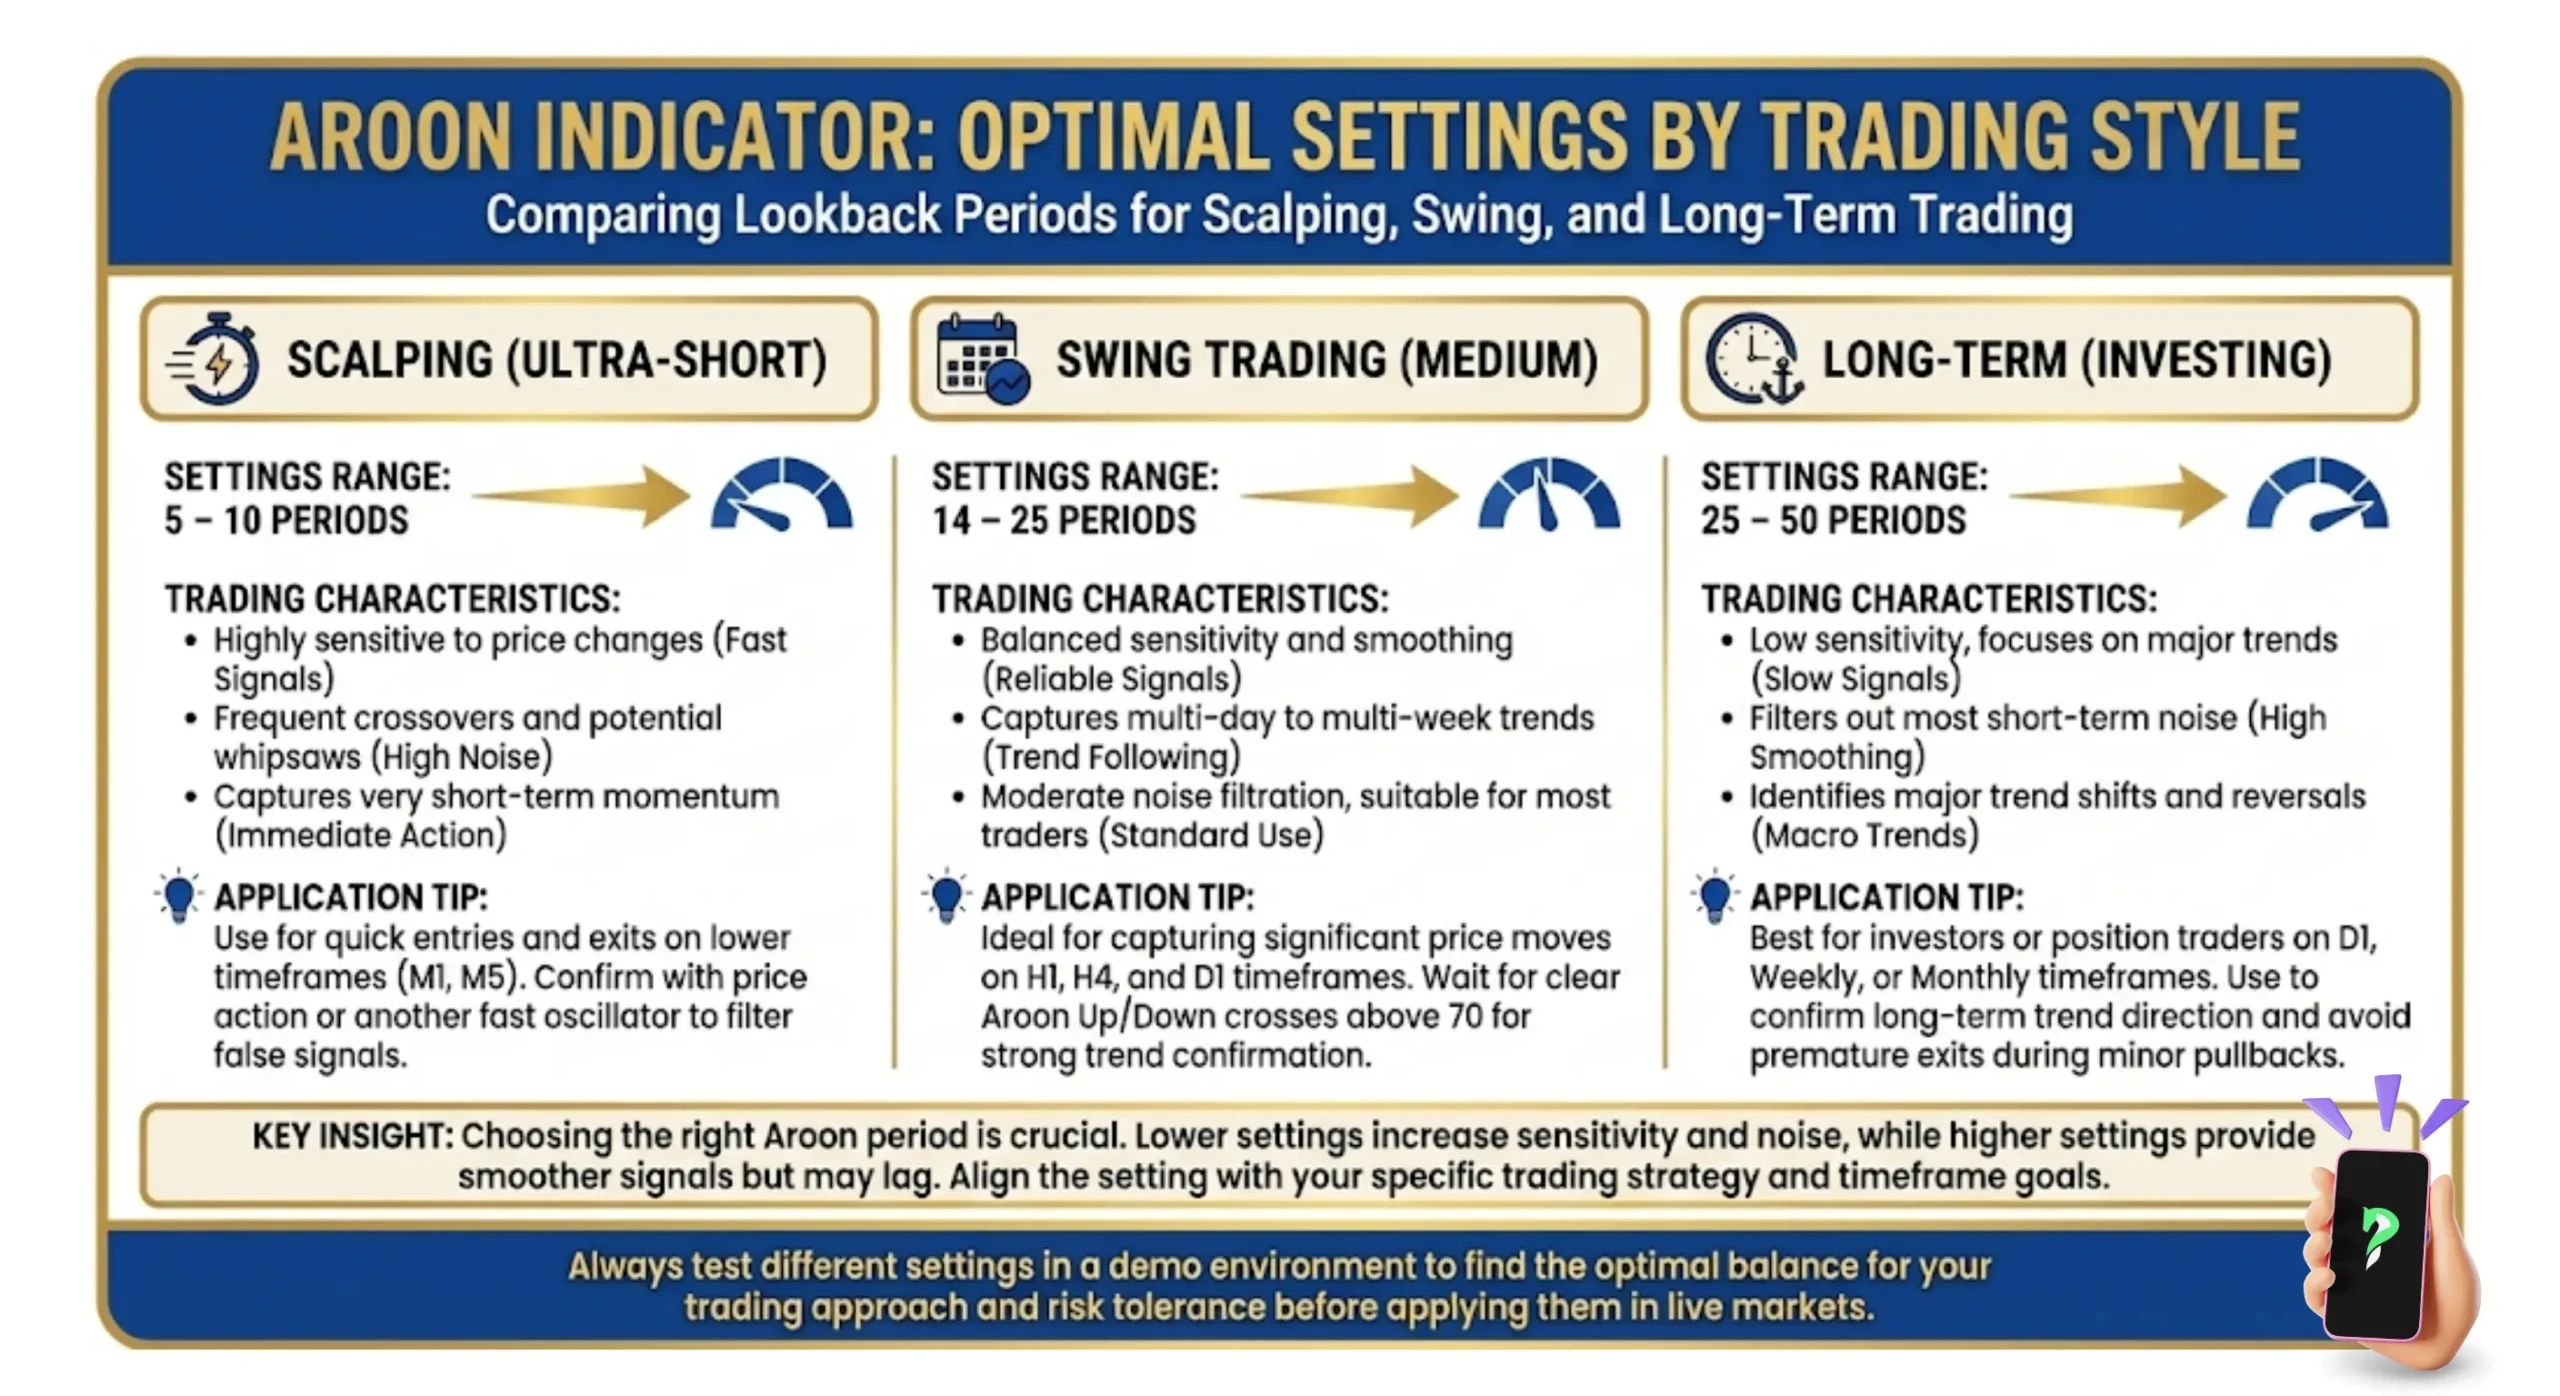
- Settings: Default 14-period works for most forex pairs; use 5–10 for scalping, 14–25 for swing trading, 25–50 for long-term trading.
-
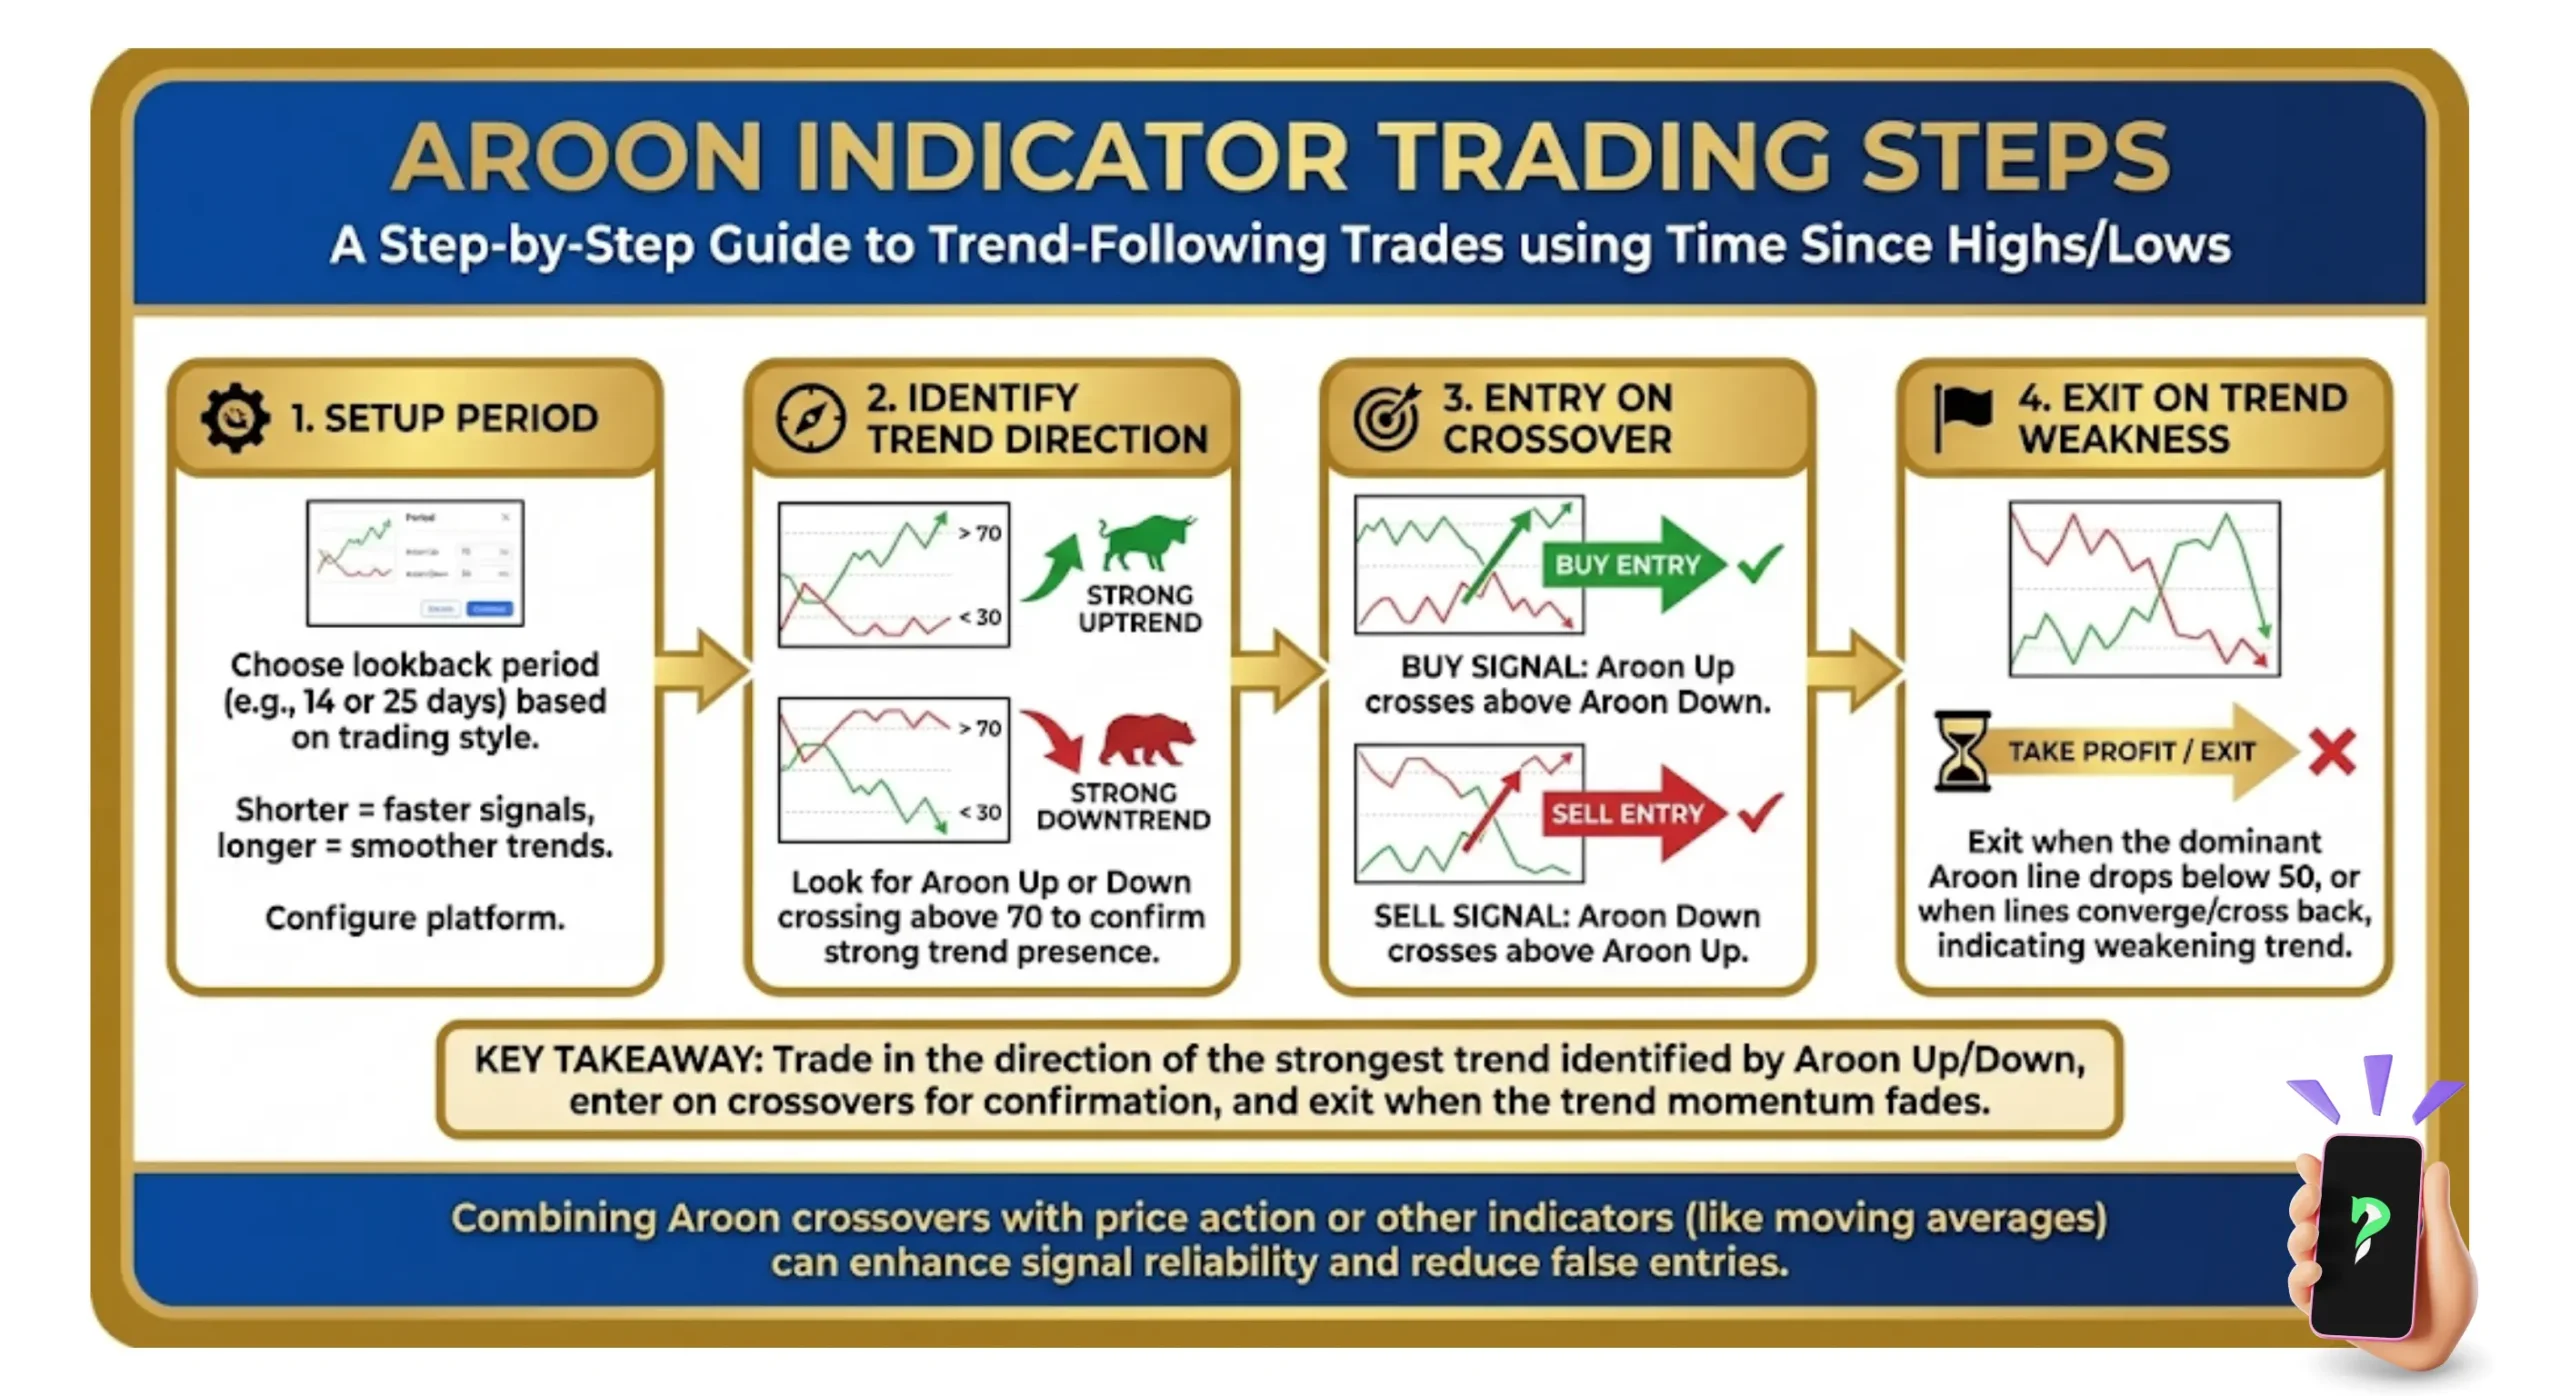
- Strategies: Trend-following (enter on crossovers, exit when trend weakens) and consolidation breakout (trade after range-bound periods).
-
- Strengths and limitations: Great for trend spotting and simplicity, but lags in sudden reversals and needs pairing with other tools like moving averages or RSI.
1. What is the Aroon Indicator?
Created by Tushar Chande in 1995, Aroon Indicator takes its name from a Sanskrit term meaning ‘first light of dawn,’ reflecting its design to detect emerging trends at an early stage — a key factor in leveraging the Aroon Indicator effectively.
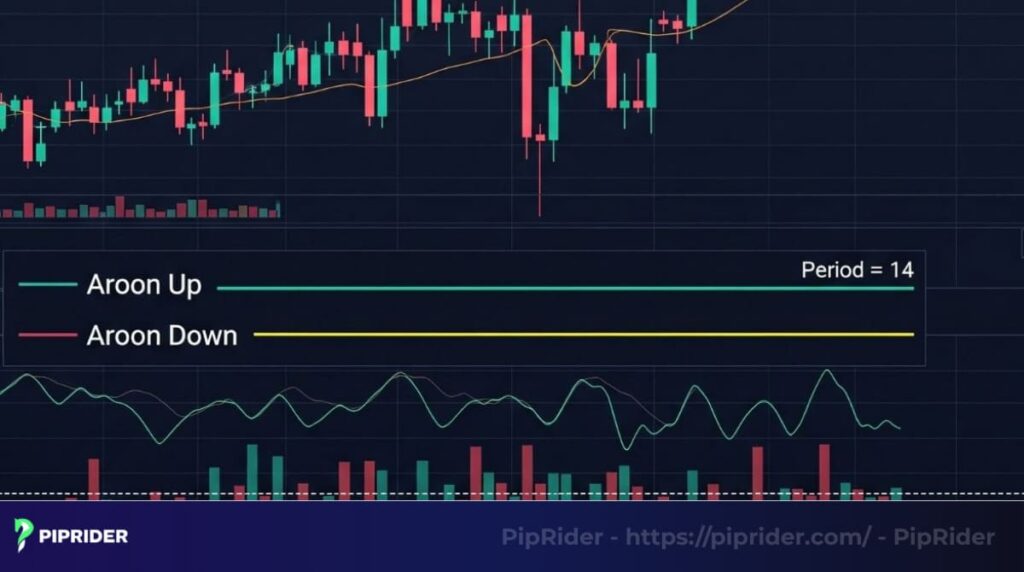
The Aroon Indicator features two separate lines:
- Aroon Up: Measures how long it’s been since the price hit its highest point over a set period,
- Aroon Down: Tracks the time since the lowest low.
Both lines move on a scale from 0 to 100, indicating trend strength. This temporal emphasis makes it highly effective for major liquid pairs like EUR/USD, where catching the onset of a momentum shift is critical.
2. How the Aroon Indicator works
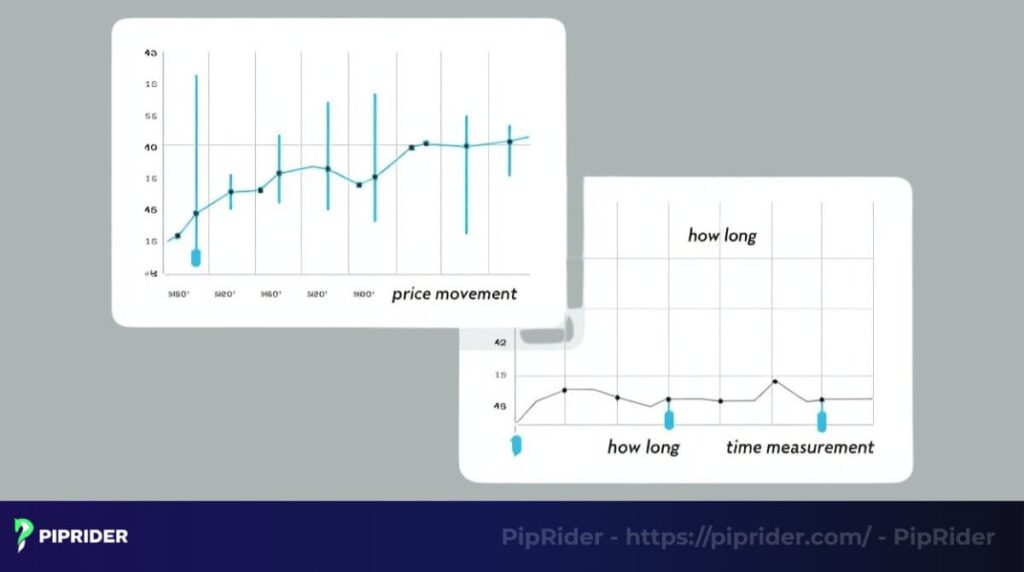
Unlike traditional momentum oscillators that measure price magnitude, the Aroon Indicator measures time. Specifically, it tracks the number of periods since the price recorded its highest high or lowest low within a defined look-back window. This temporal approach allows traders to identify emerging trends, gauge their strength, and anticipate consolidation phases before price action makes a definitive move.
2.1. How is the Aroon Indicator calculated?
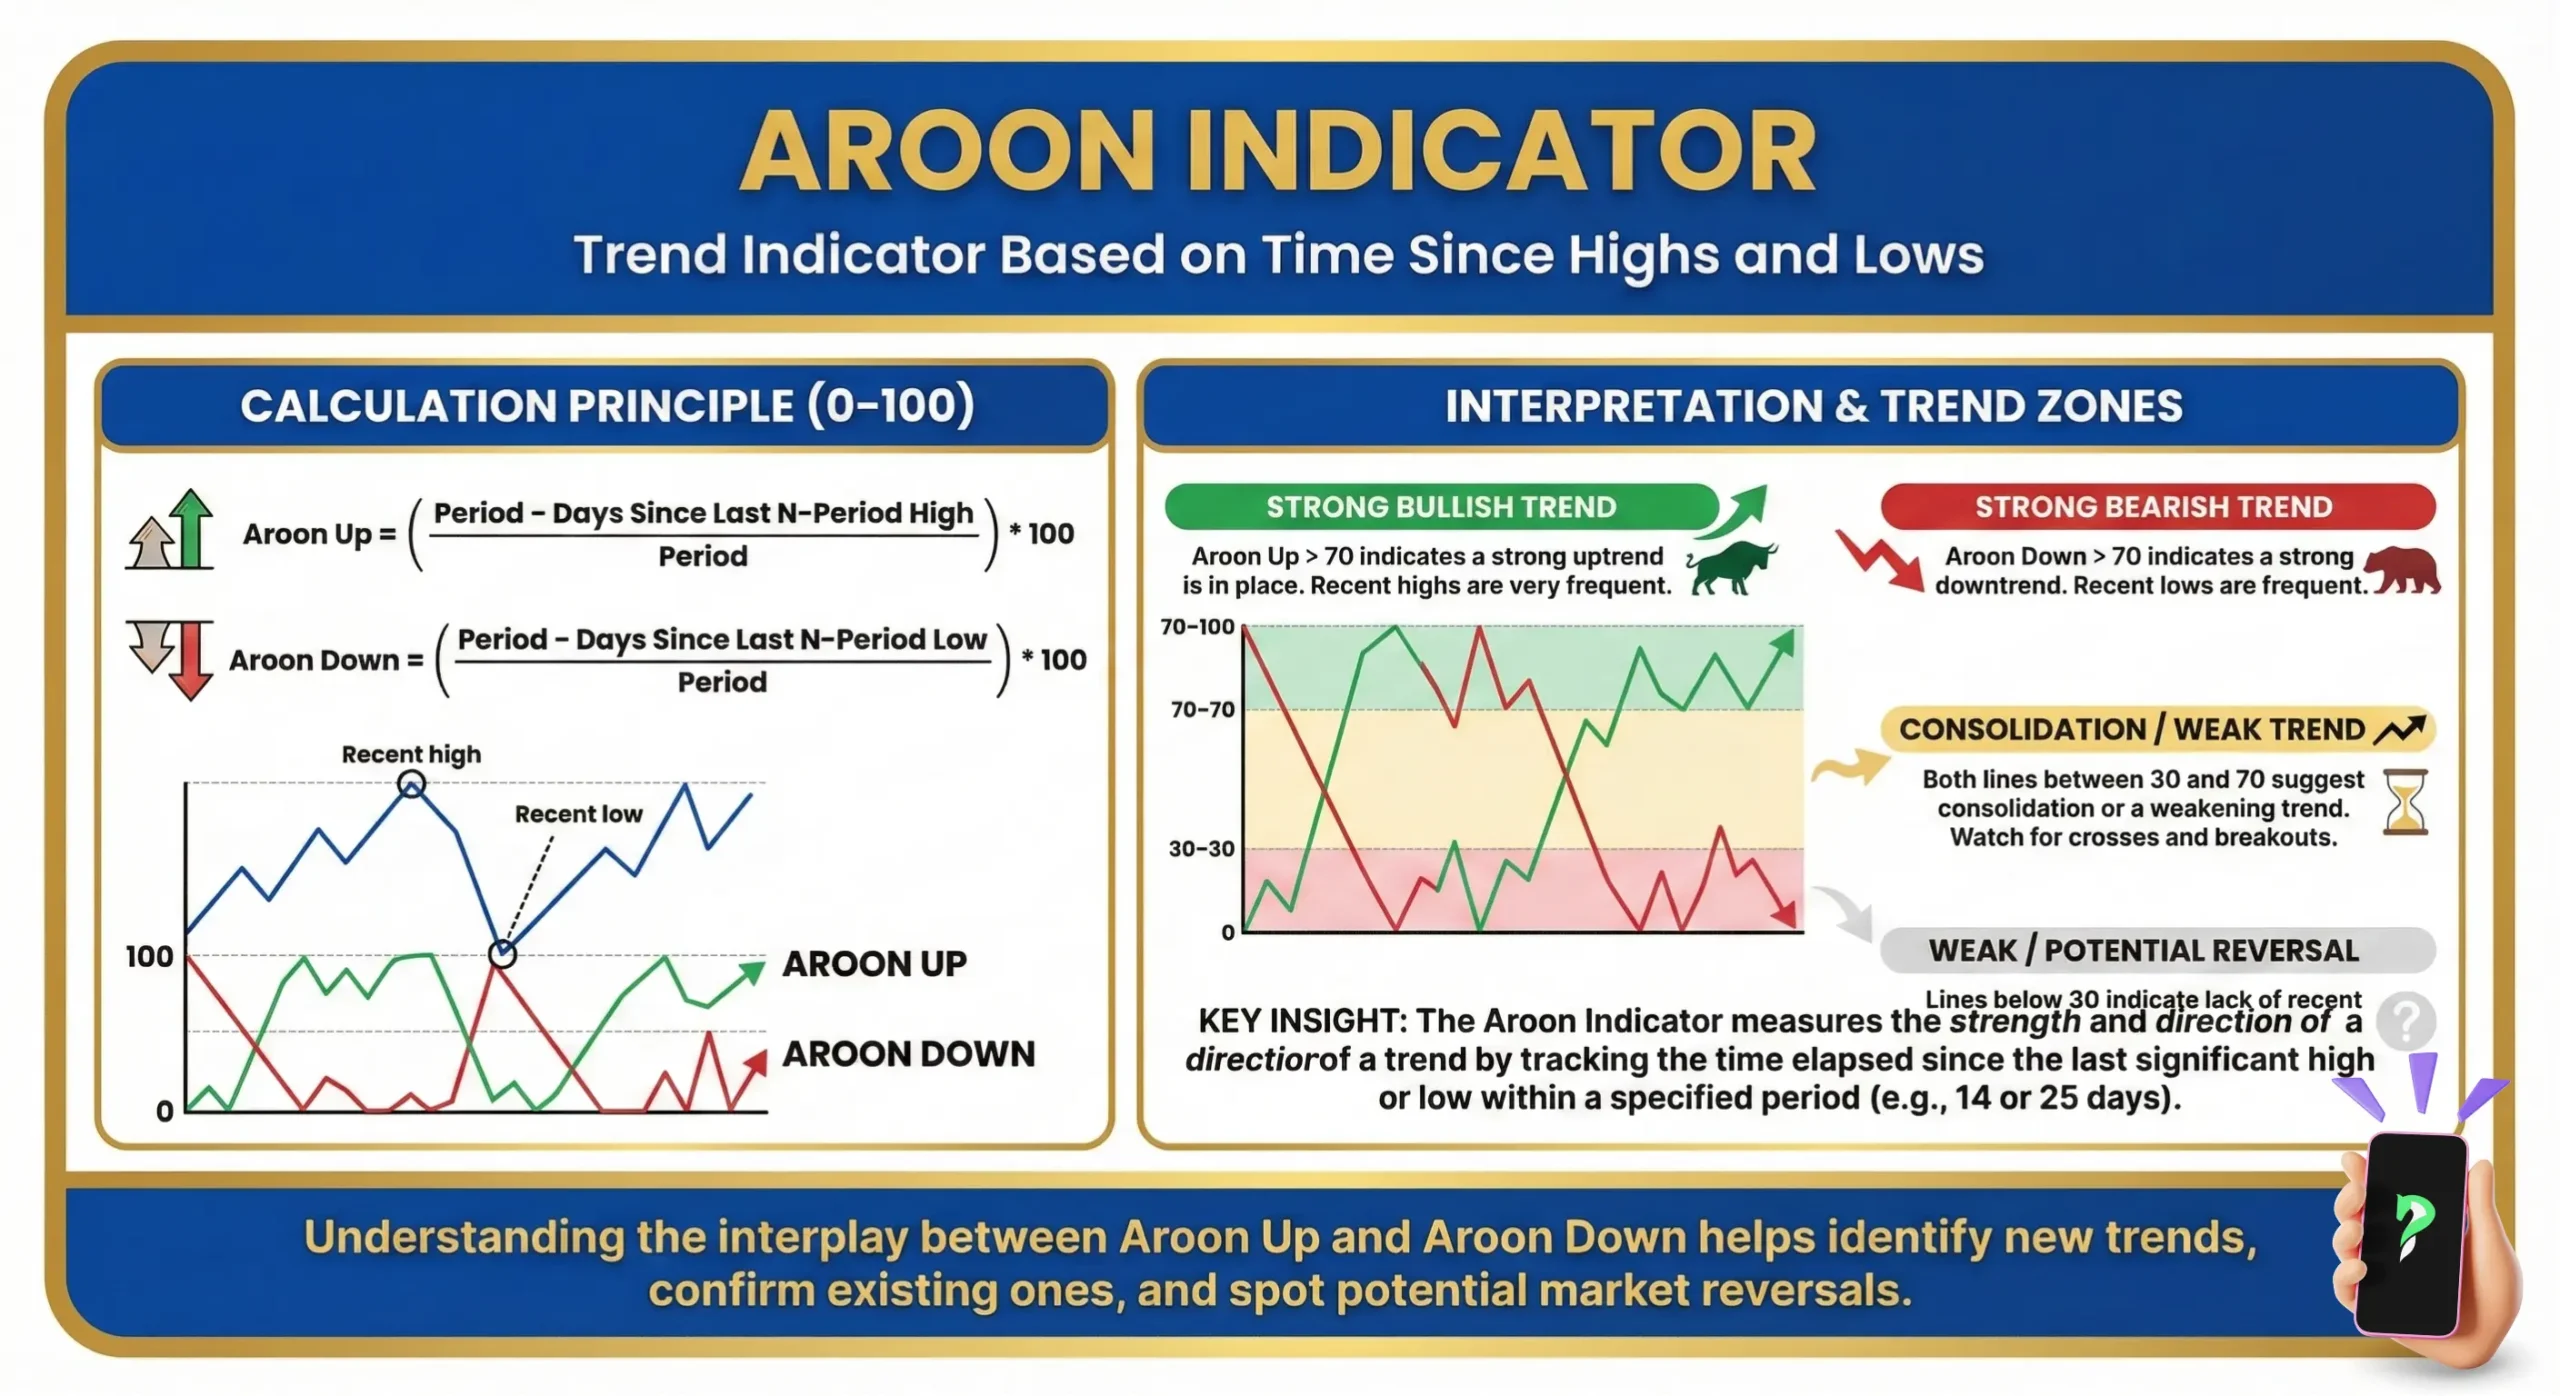
The indicator consists of two independent lines, calculated using the following formulas:
Aroon Up = [(Period – Periods Since Highest High) ÷ Period] × 100
Aroon Down = [Period – Periods Since Lowest Low) ÷ Period] × 100
For example, on a standard 14-period chart, if the highest high occurred 3 periods ago, the Aroon Up calculation is: [(14 – 3) ÷ 14] × 100 = 78.6.
Both lines oscillate between 0 and 100. Values approaching 100 indicate strong, recent momentum, while values near 0 suggest trend exhaustion.
This temporal measurement is particularly effective on highly liquid currency pairs. According to the 2025 Bank for International Settlements (BIS) Triennial Central Bank Survey, the global FX market averages over $9.6 trillion in daily turnover, with major pairs like EUR/USD and GBP/USD dominating the volume. This massive, continuous liquidity prevents structural market gaps, providing the exact mathematical environment required for time-based indicators like Aroon to function accurately.
The interpretation of these values is standardized as follows:
| Aroon Value Range | Market Interpretation |
|---|---|
| 70 – 100 | Strong Trend: High momentum in the direction of the specific line (Up/Down). |
| 31 – 69 | Transitioning: The current trend is losing steam or a new one is emerging. |
| 0 – 30 | Weak Trend: Price hasn’t made a new high/low recently; trend exhaustion. |
| ~ 50 | Neutral/Consolidation: Market is range-bound with no clear directional bias. |
2.2. The Aroon Oscillator: Quantifying Directional Bias
The Aroon Oscillator is a derivative of the core indicator, designed to synthesize the relationship between Aroon Up and Aroon Down into a single histogram or line. This simplifies the identification of the net directional bias.
The Formula:
Aroon Oscillator = Aroon Up − Aroon Down
The resulting value fluctuates between -100 and +100, with the zero-line serving as the primary threshold for sentiment shifts:
- Positive Zone (> 0): Indicates a Bullish Bias. Values approaching +100 suggest that the market is aggressively reaching new highs while new lows remain distant in time.
- Negative Zone (< 0): Indicates a Bearish Bias. Values approaching -100 confirm strong downward momentum, where new lows are frequent and new highs are absent.
- The Neutral Pivot (Near 0): When the Oscillator hovers around the zero-line, it signifies market equilibrium. This occurs when both Aroon Up and Down are at similar levels, indicating a lack of directional conviction.
3. How to read the Aroon Indicator
To know how to read Aroon Indicator effectively, the key is to grasp the meaning of the Aroon Up and Aroon Down lines. They aren’t just lines; they are a measure of whether bulls or bears are dominating in terms of time, which helps you spot whether a currency pair is trending up, down, or just drifting sideways.
By watching how the Aroon Up and Down lines move, you can make smarter trading choices.
3.1. Understanding the signals
The Aroon Indicator gives three main signals based on its two lines:
Uptrend: An uptrend is signaled when Aroon Up rises above 50 and approaches 100, with Aroon Down remaining under 50. This shows the price is hitting recent highs, suggesting a bullish move. This bullish convergence is particularly reliable on H4 and Daily charts for major pairs.
Downtrend: Aroon Down climbs above 50 toward 100, with Aroon Up below 50. This signals recent lows are dominating, hinting at a bearish trend.
Consolidation: Both lines drop below 50 and move together, showing no strong trend. This often happens when markets are quiet, like during low-volatility sessions.
3.2. Spotting crossovers
Crossovers are key to reading the Aroon Indicator. A potential uptrend is indicated when Aroon Up moves above Aroon Down.
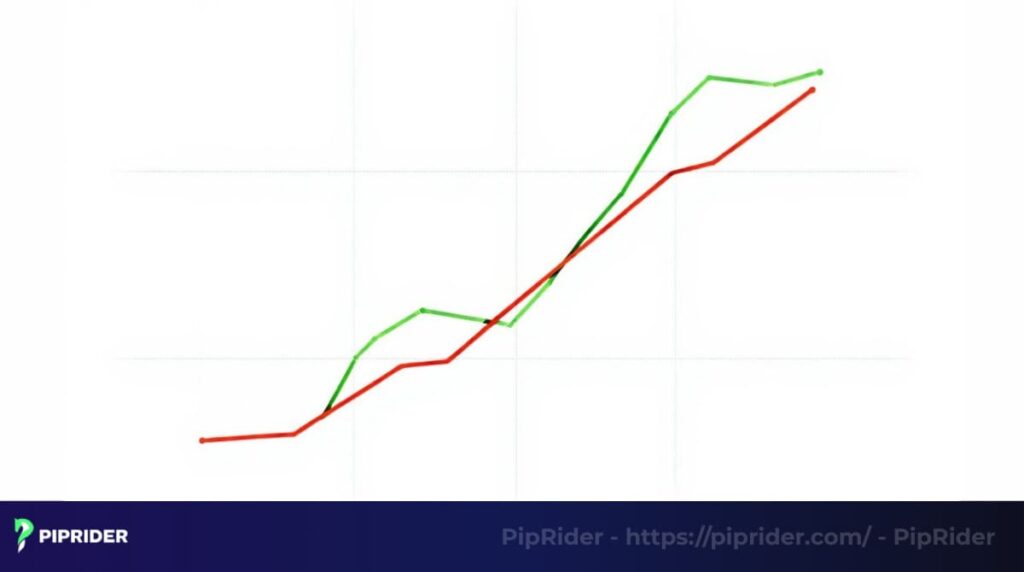
Conversely, when Aroon Down overtakes Aroon Up, it may signal the beginning of a downtrend. Crossovers on macro timeframes (like the USD/JPY Daily chart) often serve as early indicators of structural trend changes.
3.3. How to Add the Aroon Indicator (TradingView & MT4)
Deploying the Aroon indicator on professional charting platforms requires only a few clicks. Upon application, the default look-back period is universally set to 14. Always verify this baseline before modifying parameters.
- TradingView: Click the Indicators tab (or press
/) at the top of your chart. Type “Aroon” and select the standard built-in option under the Technicals category. - MetaTrader 4 (MT4): Open the Navigator panel (
Ctrl+N), expand the Indicators folder, and double-click “Aroon” to apply it. - Note for MT4: Since Aroon is not always native to older MT4 builds, you may need to download a custom
.ex4file from the MQL5 codebase and install it viaFile > Open Data Folder > MQL4 > Indicators.
4. Best Aroon Indicator Settings for Forex Trading
The effectiveness of the Aroon indicator depends on aligning its look-back period with the trader’s specific timeframe and the asset’s volatility. Unlike static indicators, Aroon’s sensitivity is directly proportional to its look-back window. Professional traders use standard baselines as a foundation for further optimization.
4.1. The Logic Behind the Default 14-Period
Developed by Tushar Chande, the 14-period setting was originally designed to represent two full trading weeks (based on a 7-day week). In modern 5-day forex markets, it remains the industry standard as it provides a balanced perspective on monthly momentum—roughly half a month of trading data. It is highly effective for identifying established trends on H1, H4, and Daily charts without over-reacting to minor intraday noise.
4.2. Choosing the Right Period: Sensitivity vs. Lag
Traders must navigate the inverse relationship between signal speed and reliability:
- Short-term (5–10 periods): Increases “temporal sensitivity.” This is optimized for capturing rapid momentum shifts or early trend breakouts. However, it is prone to whipsaws—where the indicator signals a trend change that immediately reverses.
- Long-term (25–50 periods): Acts as a high-pass filter. By increasing the look-back, the indicator requires a much more sustained price move to register a trend. This is ideal for identifying “macro” structural shifts but often results in entries late into the trend.
4.3. Settings by Trading Style and Timeframe
Aroon settings should not be static; they must adapt to the “noise level” of the chosen timeframe.
| Trading Style | Timeframe | Recommended Period | Market Environment |
|---|---|---|---|
| Scalping | M1 – M15 | 5 – 10 | High volatility / Fast execution |
| Day Trading | M30 – H1 | 14 – 20 | Intraday trend identification |
| Swing Trading | H4 – Daily | 14 – 25 | Structural trend framing |
| Position Trading | Weekly | 25 – 50 | Macro-economic shifts |
4.4. Expert Note: Volatility and Curve Fitting
Traders often fall into the trap of Curve Fitting—constantly tweaking the Aroon period to perfectly fit past price action. This leads to strategies that perform exceptionally in backtests but fail in live markets.
- Volatility Adjustment: For highly volatile pairs like GBP/JPY, a slightly longer period (e.g., 20) can help smooth out aggressive spikes.
- Rule of Thumb: Start with the 14-period default. Only adjust if the current market “rhythm” consistently produces signals that are too late (increase sensitivity) or too noisy (increase smoothing).
5. Aroon Indicator Trading Playbooks
The Aroon indicator is most effective when treated as a structural filter rather than a standalone signal generator. Professional execution requires a confluence of temporal momentum (Aroon signals) and price action confirmation. Below are two high-probability playbooks optimized for the Forex market.
5.1. Playbook A: Trend-Following Momentum
This strategy captures the core of a directional move by confirming that the trend possesses sufficient “time-based” strength to persist.
- Market Context: Price must exhibit a clear directional bias, characterized by Higher Highs/Higher Lows (Uptrend) or Lower Highs/Lower Lows (Downtrend) on the primary timeframe (e.g., H4).
- Entry Trigger (Long):
- 1. Aroon Up crosses above Aroon Down.
- 2. Aroon Up sustains a value above 50.
- 3. Structural Confirmation: Price must close above a 50-period Simple Moving Average (SMA) or break the most recent minor resistance level.
- Stop-Loss (SL): Position the SL 5–10 pips below the most recent structural Swing Low. For volatile pairs, incorporate a 1.5x ATR buffer.
- Take-Profit (TP):
- TP1: Nearest major resistance or previous Swing High (Targeting a 1:1.5 Risk-to-Reward minimum).
- TP2: Trail the remaining position using the 50-period SMA or the ascending Higher Low structure.
- Exit Rule: Close the position immediately if Aroon Up drops below 50 or if Aroon Down surges above 50, signaling a loss of bullish momentum.
- Invalidation: The setup is void if the price breaks the initial Swing Low prior to reaching TP1, regardless of the Aroon value.
5.2. Playbook B: Consolidation Breakout
This playbook capitalizes on the explosive volatility that follows a period of range-bound price action, where the market has “coiled” for an extended period.
- Market Context (The Squeeze): A valid consolidation is confirmed when both Aroon Up and Aroon Down remain consistently below the 50-level. This signifies that no new extremes (highs or lows) have been established within the 14-period look-back.
- Entry Trigger (Long):
- 1. Aroon Up surges above 50 while Aroon Down remains suppressed (<30).
- 2. Structural Confirmation: Price must decisively close above the range high. Avoid “wick-only” breakouts, as these often indicate liquidity traps.
- Safer Entry (The Retest): Conservative traders should wait for a successful retest of the broken range high (acting as new support) before committing capital.
- Stop-Loss (SL): Place the SL below the range low or the midpoint of the consolidation zone.
- Take-Profit (TP):
- Primary Target: Use a “measured move” approach (projecting the vertical height of the range upward from the breakout point).
- Secondary Target: The next major psychological level or daily resistance zone.
- Invalidation: If the price closes back inside the consolidation range for two consecutive candles after the initial breakout, the setup is a “fakeout” and must be abandoned.
5.3. Strategy Execution Summary
To ensure systematic execution and minimize discretionary errors, the following summary synthesizes the core parameters for both playbooks. This comparison serves as a technical checklist to maintain structural discipline when transitioning between trending and range-bound market environments.
| Execution Parameter | Trend-Following Playbook | Consolidation Breakout Playbook |
|---|---|---|
| Primary Aroon Trigger | Aroon Crossover with Aroon Up/Down sustaining > 50. | Aroon Up or Down surging > 50 from a dual < 50 state. |
| Price Action Confirmation | Established Higher High/Low or Lower High/Low structure. | Decisive candle close outside the consolidation range. |
| Primary Stop-Loss | Below/Above the most recent structural Swing Point. | Outside the opposite boundary of the previous range. |
| Exit / Invalidation Signal | Aroon dominant line drops < 50 or break of Swing Point. | Price re-enters and closes within the range for 2+ candles. |
6. Strategic Confluence: Enhancing Signal Reliability
The Aroon indicator measures temporal momentum—how long it takes for the market to establish new extremes. However, it does not account for price exhaustion, institutional liquidity, or volume. To filter out “whipsaws,” professional traders utilize a multi-layered confluence approach, ensuring a trade is backed by both time and structural price action.
6.1. Directional Filtering: Aroon + Exponential Moving Averages (EMA)
Moving averages provide a smoothed perspective on long-term bias. Without this filter, traders risk entering “counter-trend” signals that are merely temporary corrections.
- Technique: Use the 200-period EMA as a “Trend Filter.” Only execute Aroon Up crossovers if the price is trading above the 200-EMA.
- Objective: To ensure temporal signals align with the macro structural bias, increasing the probability of a sustained move.
6.2. Exhaustion & Divergence: Aroon + Relative Strength Index (RSI)
Aroon tracks the occurrence of a high, while RSI tracks the velocity of the move.
- Technique: Monitor for Hidden Divergence. If Aroon Up hits 100 but RSI makes a Lower High, it indicates that while a new price high was reached, the buying pressure is fading.
- Objective: To mitigate the risk of “buying the top” and identify high-probability mean-reversion zones.
6.3. Volatility Squeeze: Aroon + Bollinger Bands
Aroon is at its peak performance during the transition from market equilibrium to expansion.
- Technique: Identify a “Bollinger Band Squeeze” (where the Upper and Lower bands narrow significantly). If this occurs while both Aroon lines are below 50, a major volatility breakout is imminent.
- Objective: To capture the initial impulse of a breakout with high precision.
6.4. Structural Validation: Aroon + Institutional Supply/Demand
Indicator signals are secondary to price location. A signal is significantly more reliable when it occurs at a “Point of Interest” (POI).
- Technique: Prioritize Aroon signals that materialize as the price interacts with a weekly support level or a 61.8% Fibonacci Golden Pocket.
- Objective: To synchronize temporal momentum with institutional order flow and horizontal price psychology.
6.5. Multi-Timeframe (MTF) Confluence (New Layer)
One of the most powerful ways to use Aroon is to align signals across different time horizons.
- Technique: Confirm a “Trend Alignment.” If the Daily chart shows a strong Aroon Up trend (Up > 70), look for an Aroon Up crossover on the H1 chart for a precise entry.
- Objective: To trade with the “Wind of the Daily Trend” at your back, significantly increasing the Reward-to-Risk ratio.
Professional Constraints for System Building
To avoid Analysis Paralysis and maintain a high-performance execution environment, observe the following technical boundaries:
The “Rule of Three”: A valid trade setup should ideally have three points of confluence: 1) An Aroon Signal, 2) A Structural Level (S/R), and 3) A Momentum/Volatility Confirmation (RSI or Bollinger).
- Session-Specific Awareness: In the Forex market, Aroon signals during the London/New York overlap carry significantly more weight than those during the low-volume Asian session.
- Avoid Temporal Redundancy: Do not pair Aroon with other time-based oscillators (like the Choppiness Index), as they provide overlapping data that can lead to hesitation.
6.6. Risk Mitigation: The “No-Trade” Protocols
Spotting a signal is easy; knowing when to ignore one is what separates professional traders from the crowd. To minimize “whipsaws” and capital erosion, observe the following strict No-Trade Rules:
Rule 1: The “Entanglement” Filter
Do not execute a trade if the Aroon Up and Aroon Down lines are “entangled”—constantly crossing each other while oscillating narrowly around the 50-level.
Logic: This indicates a complete lack of trend structure and high market indecision. Entering here often leads to being “chopped up” by minor price fluctuations.
Rule 2: Range-Bound Stagnation
Avoid trading an Aroon crossover if the price action remains trapped within a clearly defined horizontal range.
Logic: Because Aroon is time-based, it may signal a “new high” simply because the price touched the top of a range it has hit multiple times before. Wait for a decisive candle close outside the range (as established in Playbook B) before committing capital.
Rule 3: High-Impact Macro Events
Cease trading with the Aroon indicator 30 minutes before and after high-impact economic releases (e.g., NFP, FOMC, or Central Bank rate decisions).
Logic: During major news, liquidity thins and spreads widen significantly. The resulting “stop-hunts” and extreme volatility can trigger Aroon extremes that have no technical backing, leading to immediate invalidation.
7. Aroon Indicator explained: Strengths and limitations
No single technical tool is flawless. Understanding the structural advantages and mathematical limitations of the Aroon Indicator is required for professional risk management.
Core Strengths:
- Early Trend Detection: Because it measures time, Aroon often signals a momentum shift before price-based oscillators (like MACD) register the move.
- Consolidation Identification: The unique “dual < 50” state provides clear mathematical confirmation of range-bound markets, preventing traders from forcing trades in choppy conditions.
- Objective Parameters: The 0–100 scale eliminates subjective chart reading, providing hard data for algorithmic or rule-based trading.
Technical Limitations:
- Vulnerability to Whipsaws: In highly volatile, non-directional markets, the indicator will produce frequent false crossovers if not filtered by a Moving Average.
- Lag in “V-Shape” Reversals: Aroon requires time to register a new extreme. In the event of a sudden macroeconomic flash crash, the indicator will lag significantly behind price action.
8. Related questions about the Aroon Indicator (FAQs)
While learning and using this indicator, I’ve compiled a few questions that traders often ask. Clarifying these points will help you use this tool with more confidence.
9. Conclusion
The Aroon Indicator is a highly effective structural tool for navigating the forex market, shifting the analytical focus from price magnitude to time. Its ability to quantify trend momentum and mathematically identify consolidation periods makes it an essential component for system-based traders.
Whether analyzing highly liquid pairs like USD/JPY or macro timeframes, the Aroon Indicator provides objective signals when calibrated with the correct look-back periods. However, its true edge is unlocked only when integrated into a broader confluence strategy—paired with moving averages for directional bias and structural price action to filter out market noise.
Before deploying these frameworks in live markets, strictly forward-test the Aroon Indicator on a demo account to master its temporal signals. For more professional trading systems and technical breakdowns, explore the PipRider blog, specifically our “Technical Indicators List” and “For Beginners” libraries, designed to build institutional-grade trading discipline.
Infographic Section
-
Aroon Indicator -
Aroon Indicator: Trading Steps -
Aroon Indicator: Optimal Settings by Trading Style


