
As a trader, your chart can often feel like a chaotic storm of lines, numbers, and conflicting patterns. In the quest for clarity, many find themselves overwhelmed. This is precisely where arrow trend indicators offer a beacon of simplicity, designed to cut through the noise with clear, visual trading signals.
But they are not a magic bullet. To use them effectively, you need to understand what they are, how they truly work, and where their weaknesses lie. This guide is my comprehensive breakdown, built from years of practical experience. We will go beyond a simple definition to give new trader a framework for using these tools wisely, not blindly.
Key Takeaways
- Introduce arrow indicators as a powerful tool to provide clear buy/sell signals for traders.
- Emphasize the critical difference between reliable “non-repainting” indicators and misleading “repainting” ones
- The guide clearly outlines the key advantages and the most significant disadvantages.
- Establishes that the most important rule is confluence, never trading on an arrow signal alone.
- Category the 5 main types of arrow indicators by their function and provides practical steps for installation and use.
- Conclude that arrow indicators should be treated as “signal generators,” not “decision-makers”.
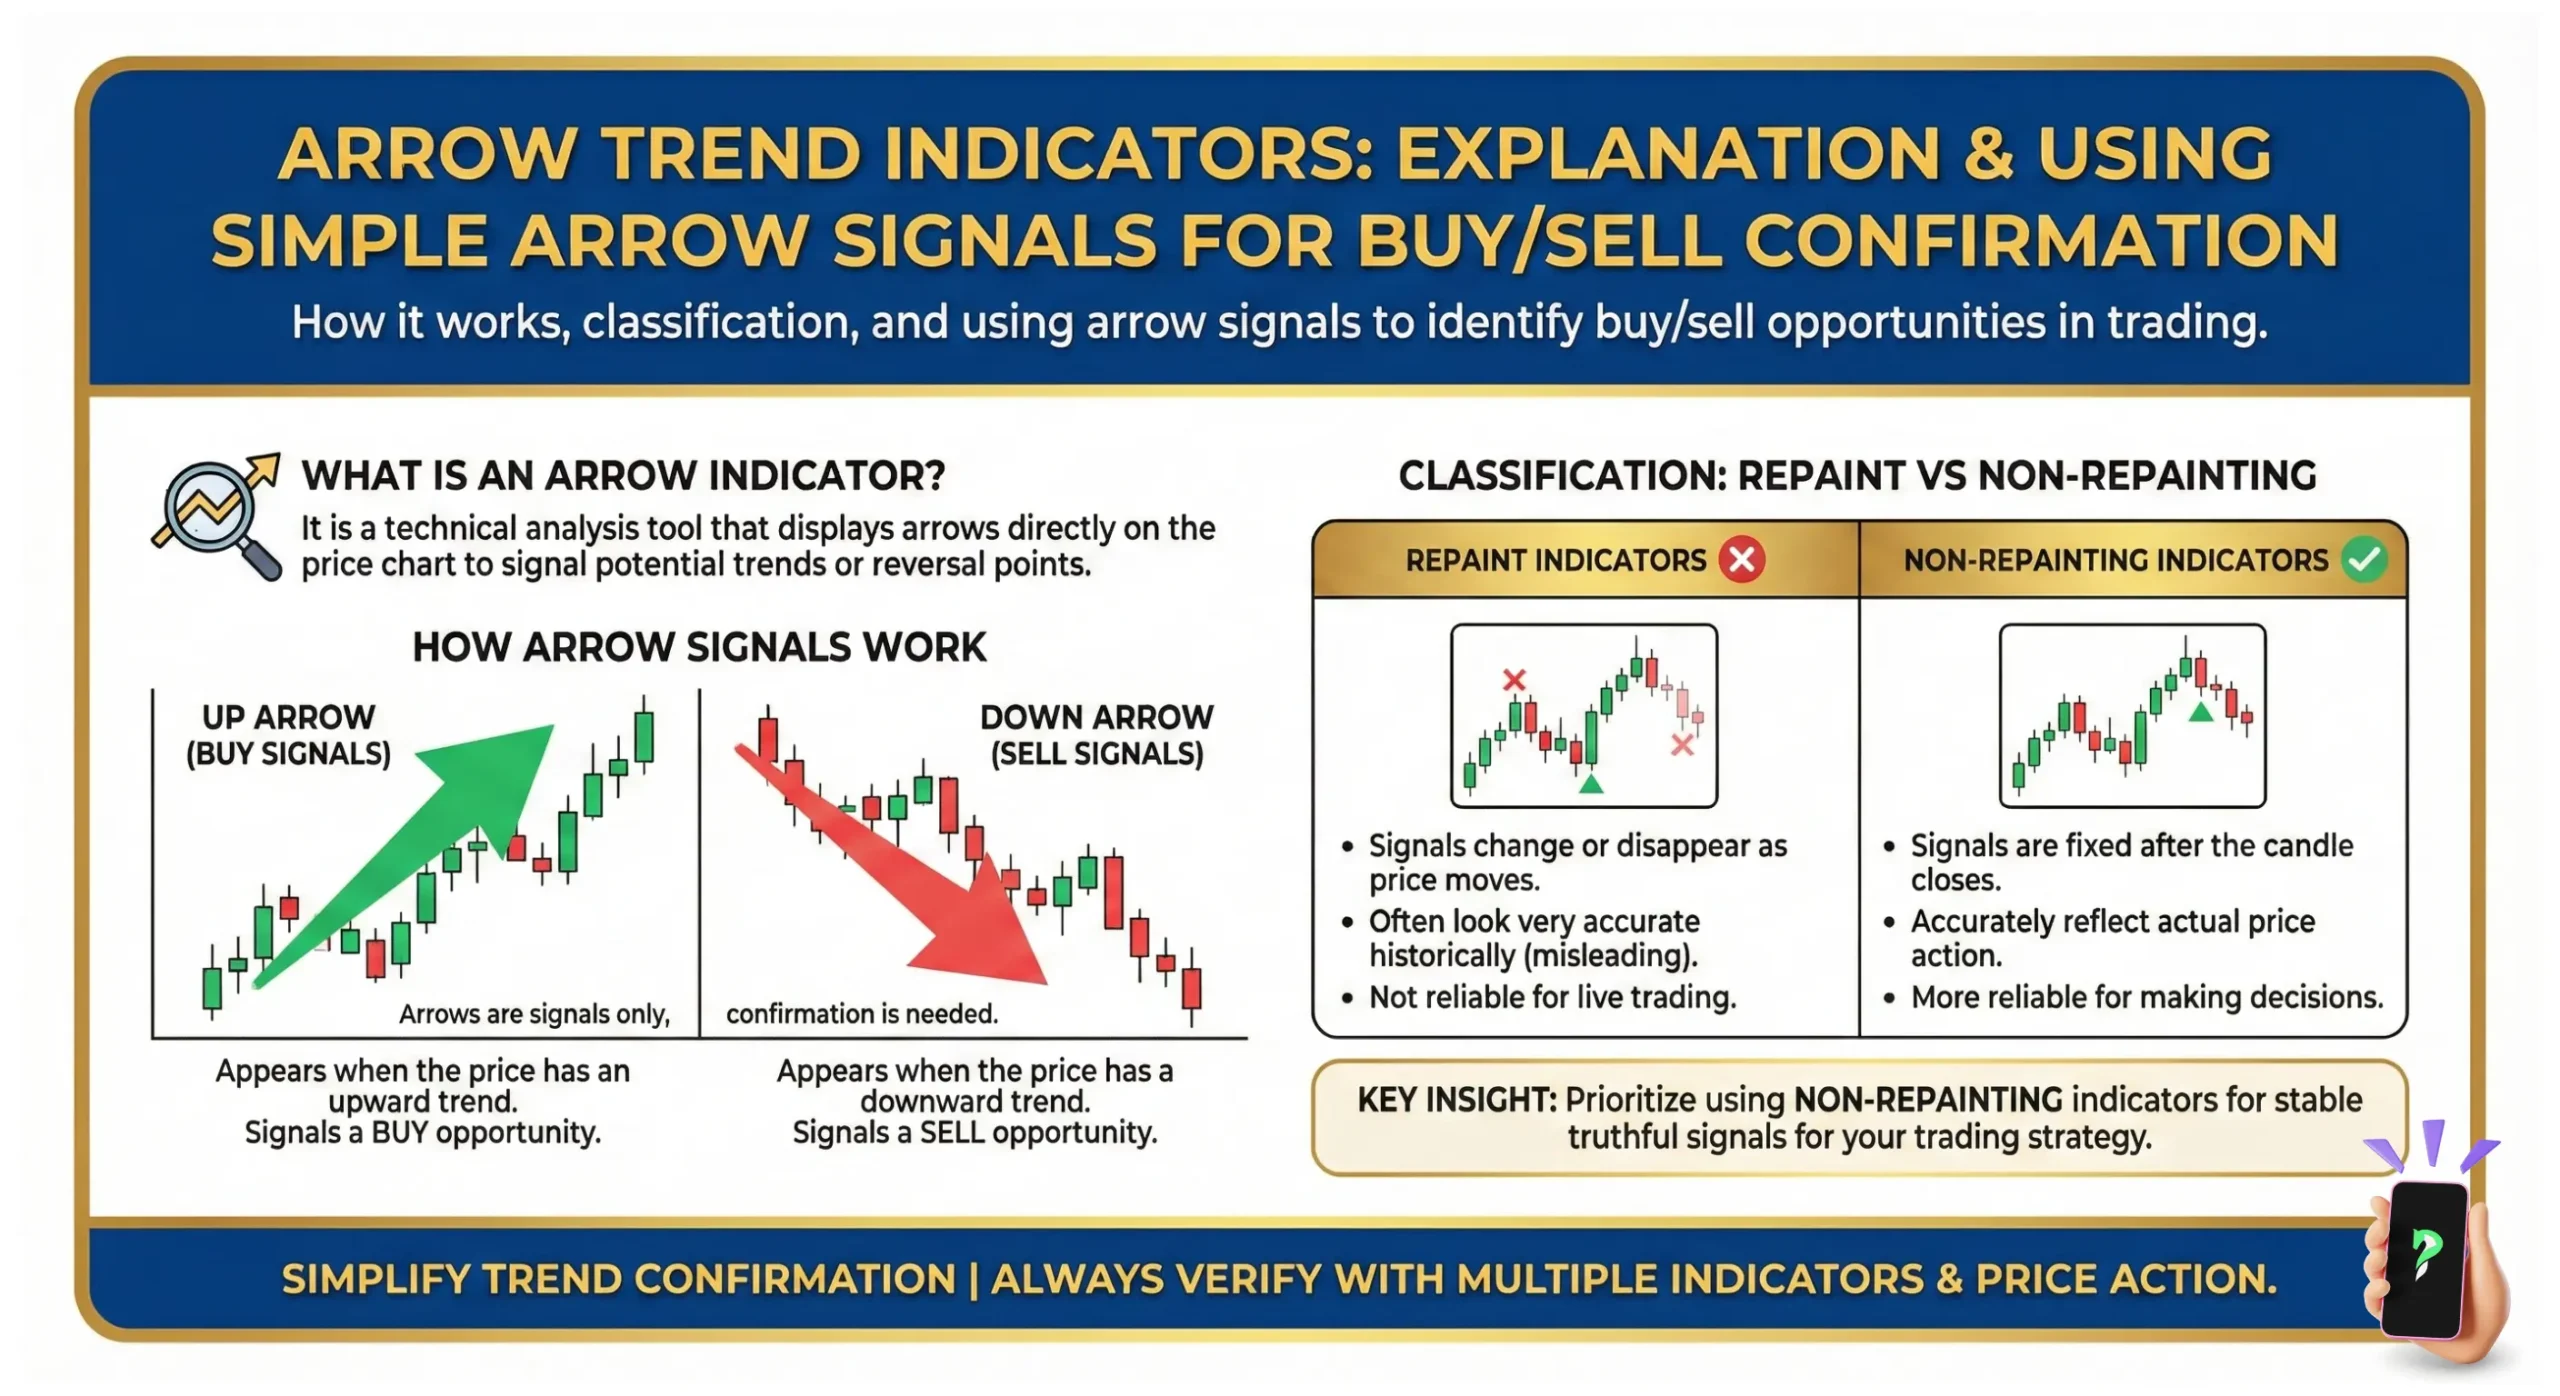
1. What is an arrow trend indicator?
In the simplest terms, an arrow trend indicator is a visual tool that plots signals directly onto your price chart, telling you when a potential buying or selling opportunity might be forming.
Think of it like a traffic light for your trading:
- A green (or blue) arrow pointing up is your green light, suggesting potential upward momentum and a time to consider buying.
- A red arrow pointing down is your red light, suggesting potential downward momentum and a time to consider selling.
Their main purpose is to translate complex mathematical calculations into a single, easy-to-understand signal. This makes them incredibly appealing, especially if you find yourself paralyzed by too much information.
2. Key features of arrow trend indicators
Not all arrow indicators are created equal. There is one fundamental feature that separates a genuinely useful tool from a dangerously misleading one. Understanding this is non-negotiable.
2.1. The crucial feature: “Non-Repainting” vs. “Repainting”
I have seen countless new traders fall into this trap. You find an indicator that looks perfect in the past, showing a flawless history of winning signals, only to find it fails miserably in live trading. The reason is almost always “repainting.”
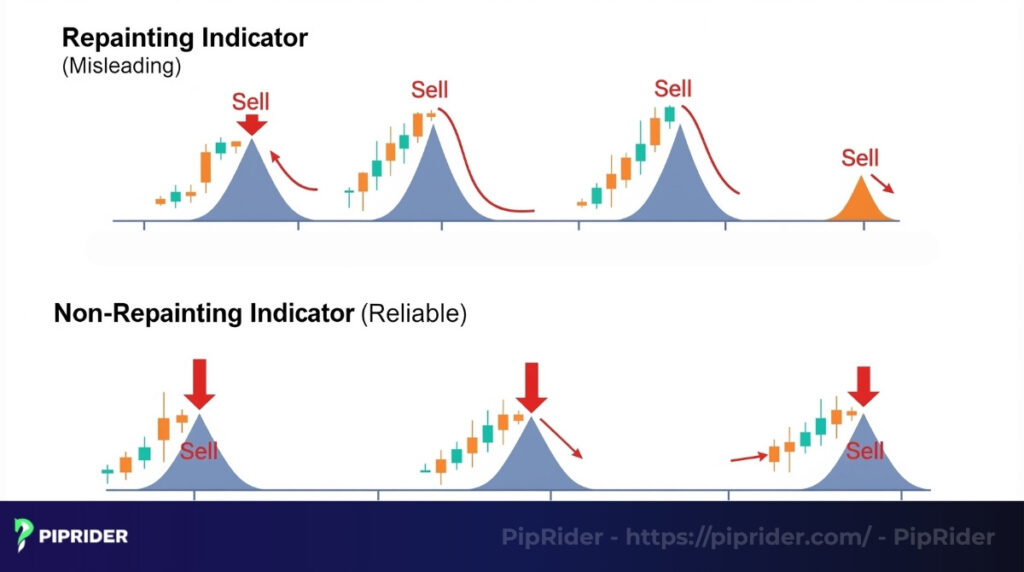
2.2. What exactly is a “repainting” indicator?
Imagine reading a history book where, after an event happens, the text rewrites itself to better fit the outcome. That’s a repainting indicator.
It will plot an arrow on a chart, but if the market moves against that signal, the arrow can move to a different candle or disappear entirely. This makes historical charts look amazing but provides zero predictive value.
2.3. Why must you insist on a “non-repainting” indicator?
A non-repainting tool is honest. Once it plots an arrow on a closed price candle, that arrow is permanent. It will not move or vanish.
This is the only way you can accurately backtest a strategy and trust the signals you see in a live market environment. Every indicator recommended or discussed in this guide is of the non-repainting variety.
3. How an arrow trend indicator works
Those arrows don’t appear by magic. They are the final, visual result of a logical recipe running in the background. As a trader, you need to know what ingredients are in that recipe.
3.1. The core logic: Turning a recipe into a signal
Think of an indicator’s code as a recipe. It takes in ingredients (price data like open, high, low, close) and follows a set of instructions (the algorithm). When the instructions are followed and the conditions are met, the final dish is a signal arrow on your chart.
For example, a very simple recipe might be: “If the closing price of the last candle is higher than the closing price of the 10 candles before it, then draw a buy arrow.”
3.2. Common recipes behind the arrows
Most arrow indicators are simply clever visual wrappers for classic, time-tested technical concepts. Here are the most common “recipes” they use:
- Moving Average Crossover: This is a momentum-based signal. An arrow appears when a short-term, “fast” moving average crosses over a long-term, “slow” one, indicating a potential shift in momentum.
- Oscillator Reversal: This logic comes from tools like the RSI or Stochastic. An arrow is plotted when the oscillator leaves an “extreme” zone—for instance, a buy arrow appears when the RSI crosses up from the oversold area (below 30), suggesting buying pressure is returning.
- Volatility Breakout: This recipe uses tools like Bollinger Bands. It looks for periods when the market is quiet and volatility is low (the bands are narrow). An arrow then appears when the price breaks out of this tight range with force.
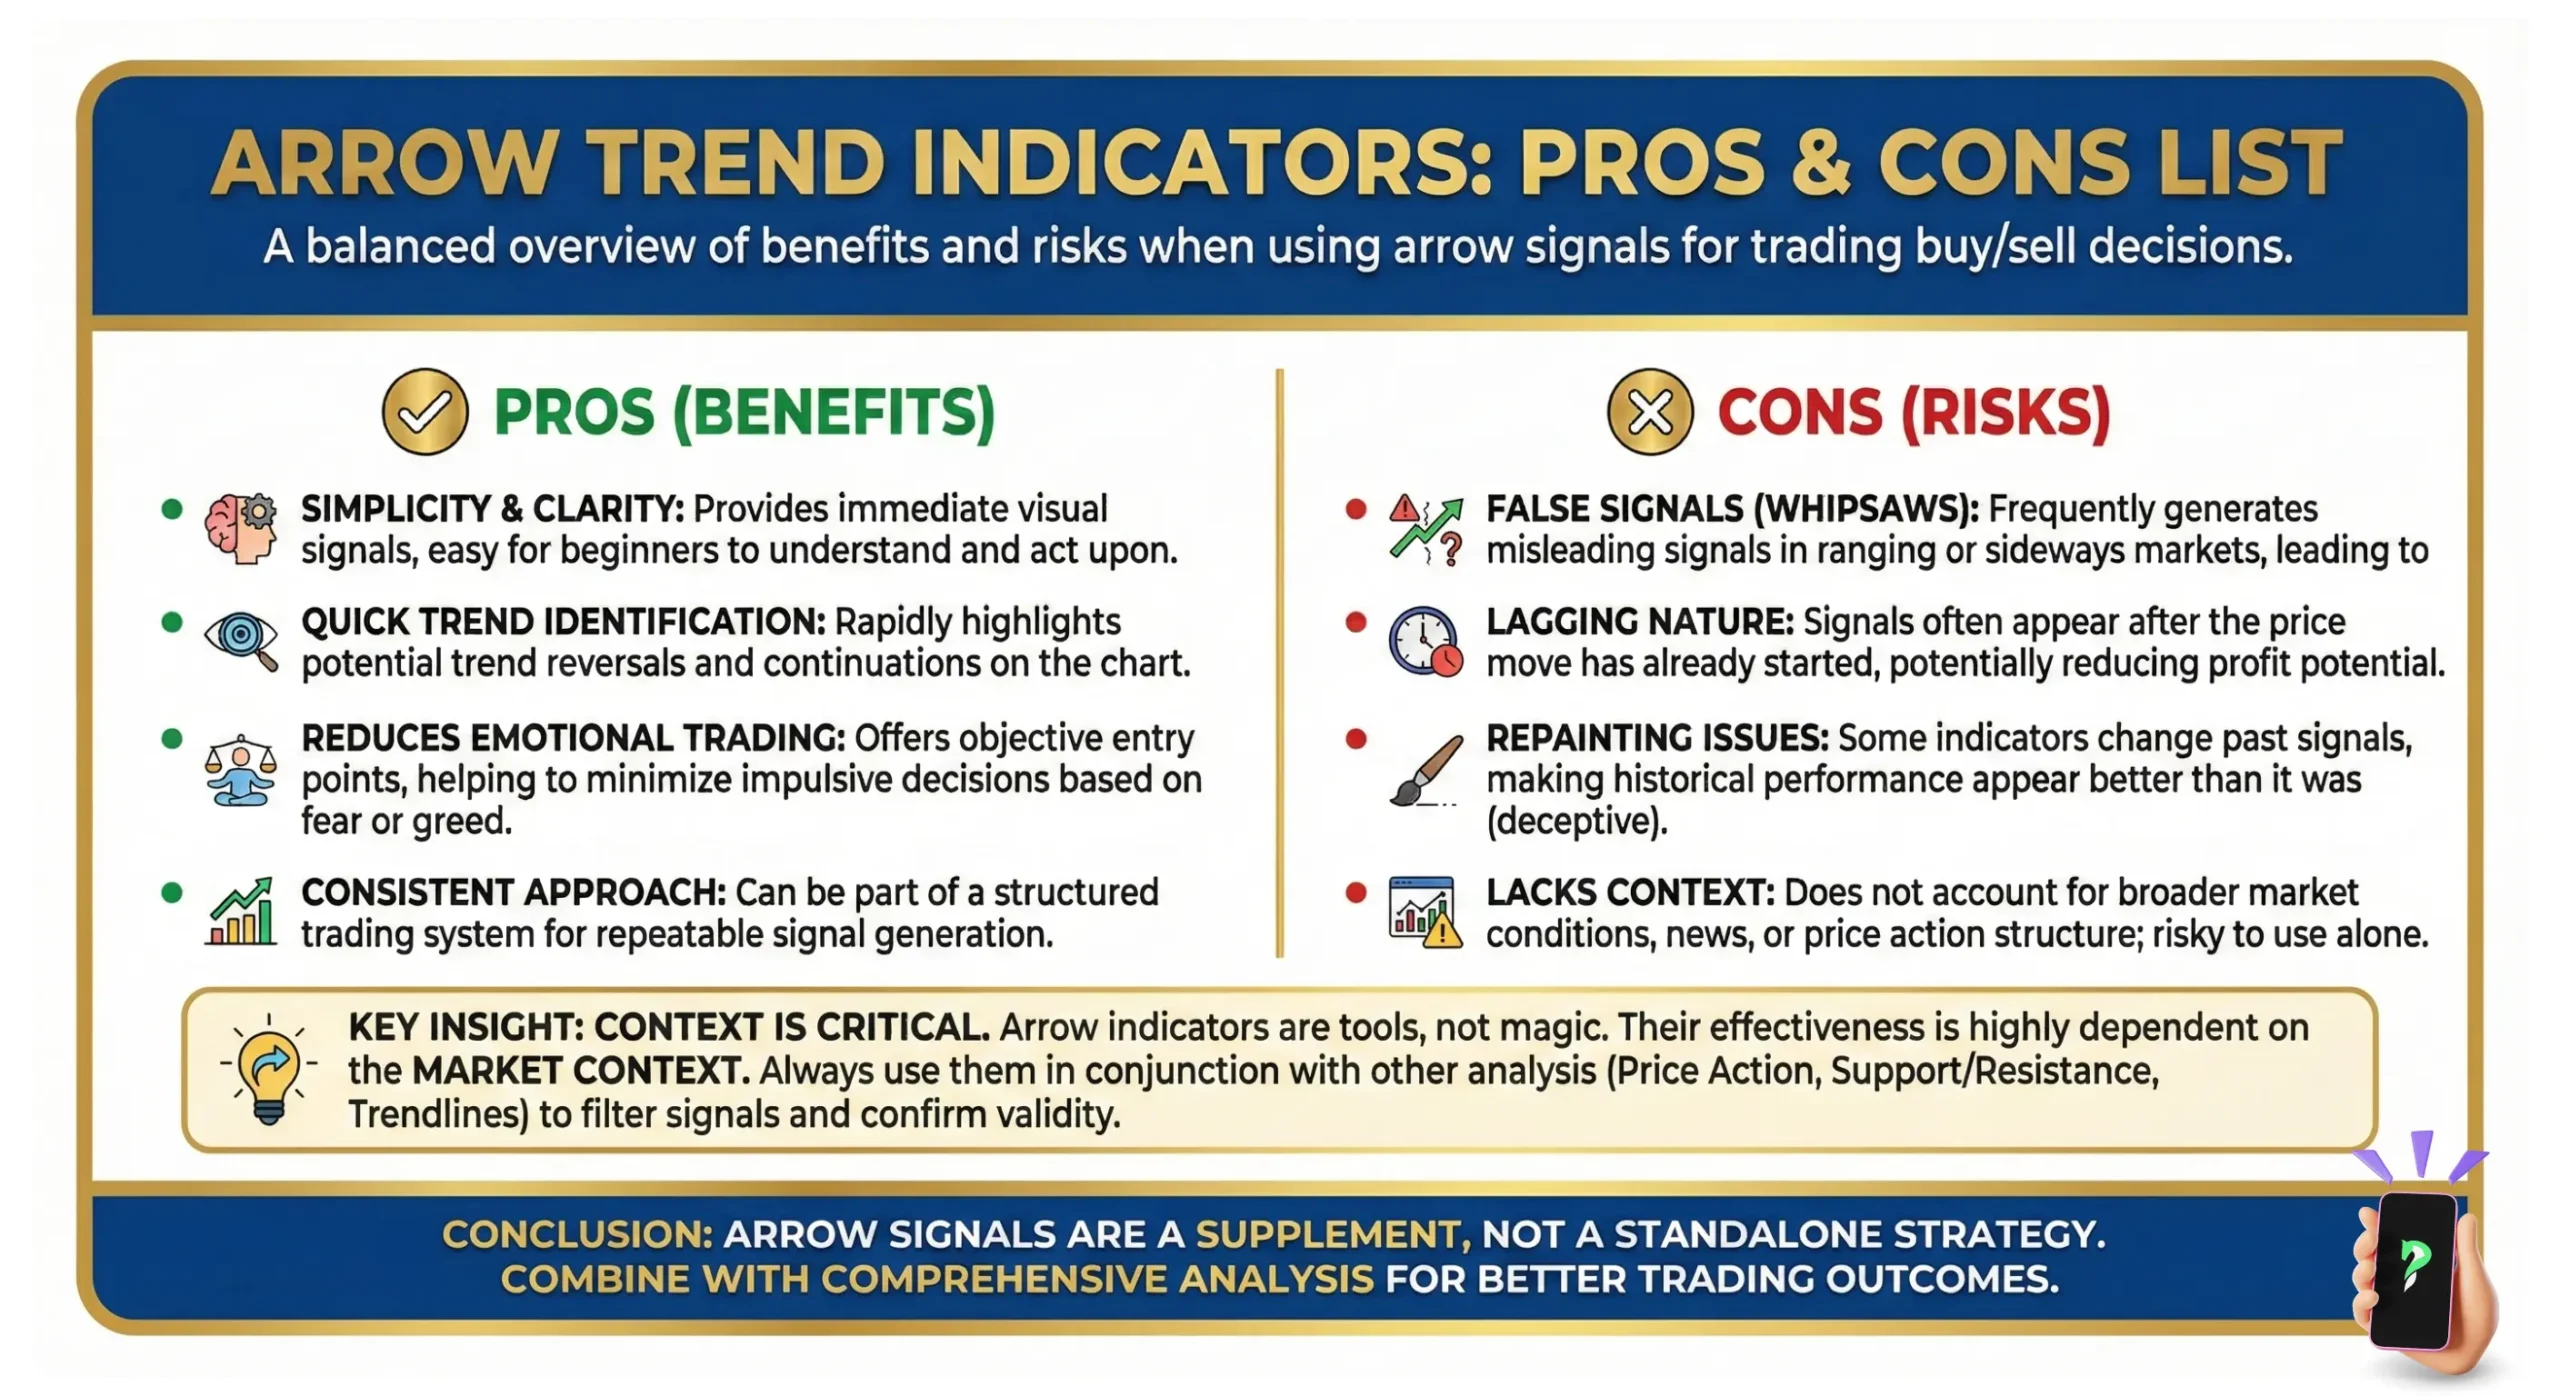
4. Pros and cons of using arrow indicators
To manage your risk and expectations, you must have a balanced view of these tools. They offer powerful advantages but come with significant risks if misunderstood.
4.1. Advantages
When used correctly as part of a larger strategy, these indicators can significantly streamline your trading process. They offer several key benefits that are especially helpful for traders who value clarity.
- Reduces analysis paralysis: The single biggest benefit is clarity. Instead of weighing ten different factors at once, you get a single, clear prompt, which can help overcome hesitation.
- Excellent for scanning: They allow you to quickly scan through many different markets or timeframes, looking for the tell-tale arrow that signals a setup may be forming and deserves a closer look.
- Promotes discipline: Because the signal is objective (the arrow is either there or it isn’t), it can help remove impulsive, emotion-based decisions from your trading.
4.2. Disadvantages and risks
However, it’s equally important to have a clear-eyed view of their limitations and inherent flaws. Ignoring these risks is a fast track to frustration and a depleted trading account.
- All arrow indicators are lagging: They are, by their very nature, reactive. They analyze price data that has already happened to give you a signal. You will never catch the exact bottom or top with an arrow; they are designed to get you into a move that is already underway.
- They generate many false signals in choppy markets: When the market is moving sideways without a clear trend, most arrow indicators will produce a frustrating series of losing buy and sell signals. This is their kryptonite.
- They can create lazy habits: This is the biggest danger I’ve seen. Relying only on arrows prevents you from learning the essential skills of reading price action, understanding market structure, and developing a true feel for the market.
5. 5 Popular types of arrow trend indicators
While names vary, most arrow indicators fall into a few conceptual categories. Understanding these types is key to choosing the right tool for your strategy.
5.1. Super Trend Indicator
This tool uses market volatility (ATR) to plot a trailing line that defines the current trend. An arrow appears when the price decisively breaks this line, signaling a potential trend flip.
- Best for: Swing traders who want to ride a clear, sustained trend.
- Be aware: It generates many false signals (whipsaws) in sideways markets.
5.2. Moving Average Crossover Arrows
A classic momentum tool. It plots an arrow when a short-term “fast” moving average crosses over a long-term “slow” one, indicating a potential shift in momentum.
- Best for: New traders, due to its simple and transparent logic.
- Be aware: Also very prone to whipsaws and confusion in non-trending markets.
5.3. Oscillator Reversal Arrows
This type seeks to identify turning points by measuring momentum exhaustion with tools like the RSI or Stochastic. An arrow appears when the oscillator leaves an “overbought” or “oversold” zone.
- Best for: Range-bound traders looking to identify tops and bottoms.
- Be aware: This is an inherently risky, counter-trend strategy that requires strong confirmation.
5.4. Volatility Breakout Arrows
This indicator looks for periods of low volatility (like a Bollinger Band squeeze). It then plots an arrow when the price breaks out of this tight range with force, signaling the start of a new move.
- Best for: Breakout traders who patiently wait for high-momentum setups.
- Be aware: False breakouts are a common risk; confirmation with volume is recommended.
5.5. Half Trend Indicator
A “smarter” trend-following tool. It identifies the primary trend, then waits for a pullback to a baseline before plotting an arrow, aiming for a lower-risk entry within an established trend.
- Best for: Prudent trend traders who prefer quality over quantity of signals.
- Be aware: You might miss the very beginning of a new trend, as it waits for confirmation.
6. How to install and customize an arrow trend indicator
Adding a new tool to your platform is a simple process, but it’s important to know how to customize it to fit your needs. The steps below are universal, with a specific example for the popular MT4 platform.
Step 1: Get the indicator file
First, you need the indicator itself. You can download a pre-built indicator from a trusted community (like the MQL5 market) or, for advanced users, write your own using your platform’s language (Pine Script for TradingView or MQL4 for MetaTrader).
Step 2: Install the indicator
You need to place the file where your platform can read it.
For example, on MetaTrader 4 (MT4):
- In the top menu, go to File > Open Data Folder.
- A window will open. Navigate to the MQL4 folder, and then open the Indicators folder.
- Copy your indicator file (.mq4 or .ex4) and paste it into this Indicators folder.
- To complete the process, restart the platform or simply right-click the Navigator window and select ‘Refresh’ to load the new tool.
Step 3: Activate the indicator on your chart
Now that it’s installed, your new tool should appear in the ‘Indicators’ list, typically found in the Navigator panel. Drag it onto the chart you want to analyze.
Step 4: Customize the indicator
This is a vital step. When you add the indicator, a settings box will appear. Here you can:
- Change the inputs: Adjust the core logic. For a moving average crossover indicator, you could change the periods from 10/20 to 20/50 to look for longer-term signals.
- Adjust the appearance: Change the colors, size, and style of the arrows. Make them work for your eyes and your chart layout.
- Set up alerts: Configure the platform to send you a notification when an arrow appears. This is a huge time-saver.
7. How to choose a good arrow trend indicator for Forex trading
Arrow indicators might seem like a dream: simple signals telling you exactly when to buy or sell. I’ve personally felt that pull, hoping a perfect arrow would solve all my trading problems. But the truth is, finding a “good” one isn’t about magic accuracy. It’s about picking a tool that genuinely fits your strategy and, crucially, understanding its limits.
A truly “good” arrow indicator isn’t always right; it’s reliable, transparent, and works well with your overall trading plan. Here’s how I approach picking one:
7.1. Always pick non-repainting indicators
This is, in my opinion, the most critical factor. A “repainting” indicator changes its signals (the arrows) after the candle closes, looking perfect in hindsight but useless in real-time.
I’ve seen too many traders get burned by repainting indicators that show flawless entries on historical charts but fail completely in live trading. A non-repainting indicator’s signals stay put once the candle closes, what you see is what you get, which is what you need.
7.2. Understand indicator’s logic
Don’t just download an indicator because it looks fancy. I always dig into how an indicator works. Is it based on moving average crossovers, RSI levels, or specific candle patterns? If you don’t understand the logic, you can’t truly trust its signals. I avoid “black box” indicators where the developer keeps the secrets; if I can’t understand it, I can’t rely on it.
7.3. Test it thoroughly (Start with a demo account)
Even if an indicator looks good on paper, it’s useless until you test it yourself.
- Backtest: See how it performed on past data. Did its signals align with profitable moves? How many false signals did it give?
- Forward test (Demo account): This is non-negotiable for me. I never, ever use an indicator on a live account until I’ve seen it perform consistently in a real-time demo environment. Check if the arrows appear as expected and don’t repaint.
7.4. Use arrow trend indicator as a confirmation tool
A “good” arrow indicator should support your existing analysis, not be your only decision-maker.
- Combine for Confluence: Use the arrow as a confirmation. If you’ve already identified a strong uptrend through price action and a key support level holds, then a buy arrow appearing becomes a powerful confirmation. It’s a valuable piece of the puzzle, but never the whole picture for me.
- Risk Management: An arrow won’t tell you where to place your stop-loss or take-profit. I always rely on market structure (like support/resistance or swing highs/lows) and ATR for my risk management, regardless of what an arrow shows.
In short, choosing a good arrow indicator isn’t about finding a magical solution. It’s about finding a reliable, transparent tool that fits your trading style and passes your strict testing. It’s a process of careful selection and validation.
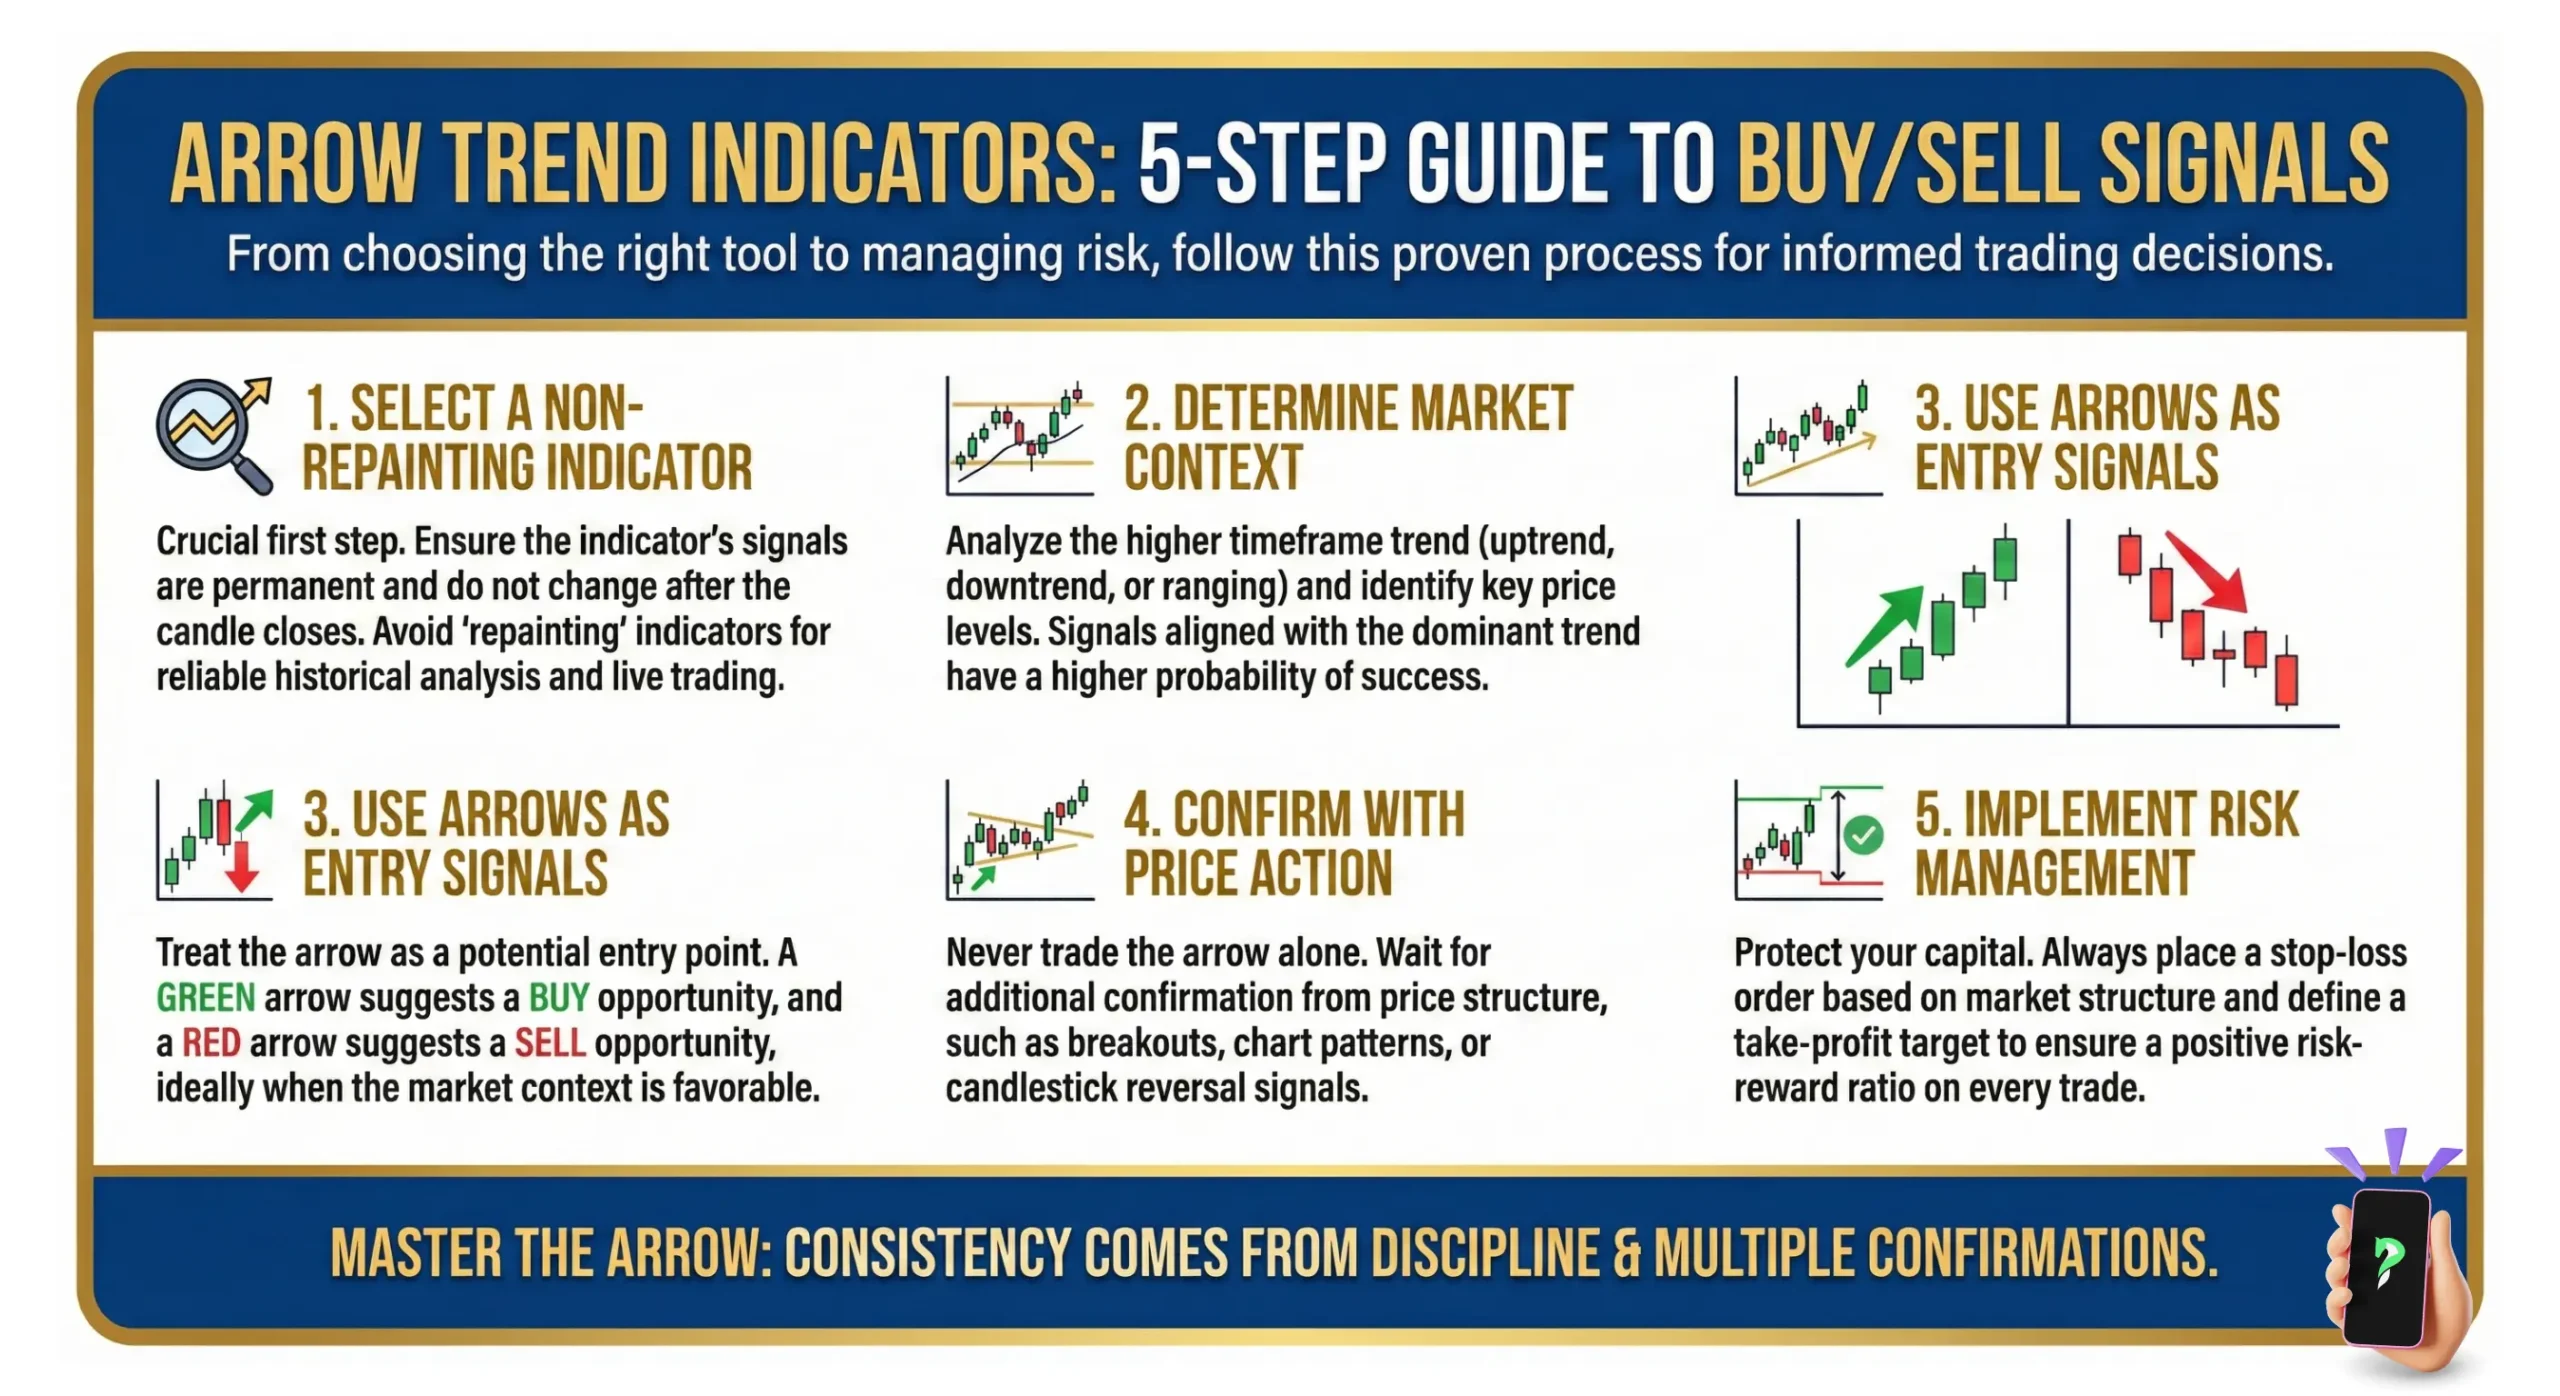
8. How to use arrow trend indicators correctly
Arrow indicators are known for their simplicity, both in appearance and application. However, it’s a mistake to believe that using them guarantees error-free or consistently profitable trades. It’s crucial to understand that losses are an inherent part of the trading process.
All technical analysis tools, including arrow indicators, are merely guidelines that can help traders minimize losses. A trader’s experience, personal qualities, and existing skills significantly impact trading outcomes.
Therefore, before you start using these algorithms in Forex trading, you need to accept that you’re not getting a magical method for unlimited capital growth. Moreover, when using arrow indicators, it’s vital to follow certain rules:
- Combine multiple tools: It’s easy to see a green arrow on a chart and immediately open a buy trade. However, it’s important to ensure other indicators provide similar signals. These don’t necessarily have to be other arrow indicators; suitable tools include RSI, Stochastic, MACD, and others.
- Suitable for all traders: If the first condition is met, this type of algorithm can suit any Forex trader without exception. For instance, they can help beginners navigate the market and grasp key trading principles.
- Each indicator is unique: Although all arrow indicators have a similar look, each one is unique. While some are considered universal, most indicators are designed for specific strategies.
- Market condition matters: In practice, most arrow indicators work better during periods of high volatility and clear trends. In a flat (ranging) market, they can provide false signals. Conversely, some arrow indicators are specifically suited for flat market conditions.
- Timeframe impacts quality: The larger the timeframe, the fewer signals an arrow indicator provides. However, the quality of these signals is higher compared to smaller periods.
- Entry rules: Most often, a trader needs to open a trade on the candle or bar following an arrow. Sometimes, arrow algorithms might embed other recommendations.
Test on a demo account first: Before switching to a real trading account using arrow indicators, it’s essential to thoroughly test them on a demo account.
9. Real-world example: Analyzing a trade with an arrow indicator
Let’s walk through a thought process. You’re watching the Gold (XAU/USD) chart on the H1 timeframe and a blue buy arrow from your HalfTrend indicator appears.
- The signal: The arrow appears. Pause. Do not click the buy button. It’s time to be an analyst, not a gambler.
- Confirmation 1 (Market structure): You zoom out slightly. You see that the price has just pulled back to a key horizontal support level that has held up twice before in the last 48 hours. This adds significant weight to the trade idea.
- Confirmation 2 (Price action): You look closely at the candle with the arrow. It’s a “pin bar” with a long lower wick, showing that buyers aggressively stepped in at that support level and rejected lower prices. This adds significant weight to the trade idea.
- The decision: You now have a high-probability setup. You have three pieces of evidence pointing in the same direction: the arrow, a key support level, and bullish price action. You can now enter a buy trade with confidence, placing your stop loss just below the low of that pin bar.
10. Frequently asked questions (FAQs)
Let’s address some of the most common questions I hear from traders.
11. Conclusion: Are arrow trend indicators worth using?
So, what’s the final verdict? Arrow trend indicators are indeed a valuable asset, but only when they are used with the correct approach. They are exceptional tools for simplifying your charts, identifying potential opportunities, and building objective, rules-based trading habits.
However, they are not a replacement for your brain. My final piece of advice from years in the market is this: treat these tools as signal generators, not decision-makers. Your job as a trader is to take the signal they generate and validate it against your knowledge of the market.
Use them to support your analysis, not to substitute it. Test them, understand their flaws, and integrate them wisely. Do that, and they can become an invaluable asset in your trading journey. For even more valuable insights, dive into Piprider’s Best Technical Indicators category!
Infographic Section
-
Arrow Trend Indicators: Pros and Cons List -
Arrow Trend Indicators: 5-Step Guide -
Arrow Trend Indicators: Explanation


