
As a trader, your chart can often feel like a chaotic storm of lines, numbers, and conflicting patterns. In the quest for clarity, many find themselves overwhelmed. This is precisely where arrow trend indicators offer a beacon of simplicity, designed to cut through the noise with clear, visual trading signals.
But they are not a magic bullet. To use them effectively, you need to understand what they are, how they truly work, and where their weaknesses lie. This guide is my comprehensive breakdown, built from years of practical experience. We will go beyond a simple definition to give new trader a framework for using these tools wisely, not blindly.
Key Takeaways
-
- Introduce arrow indicators as a powerful tool to provide clear buy/sell signals for traders.
- Emphasize the critical difference between reliable “non-repainting” indicators and misleading “repainting” ones
- The guide clearly outlines the key advantages and the most significant disadvantages.
- Establishes that the most important rule is confluence, never trading on an arrow signal alone.
- Category the 5 main types of arrow indicators by their function and provides practical steps for installation and use.
- Conclude that arrow indicators should be treated as “signal generators,” not “decision-makers”.
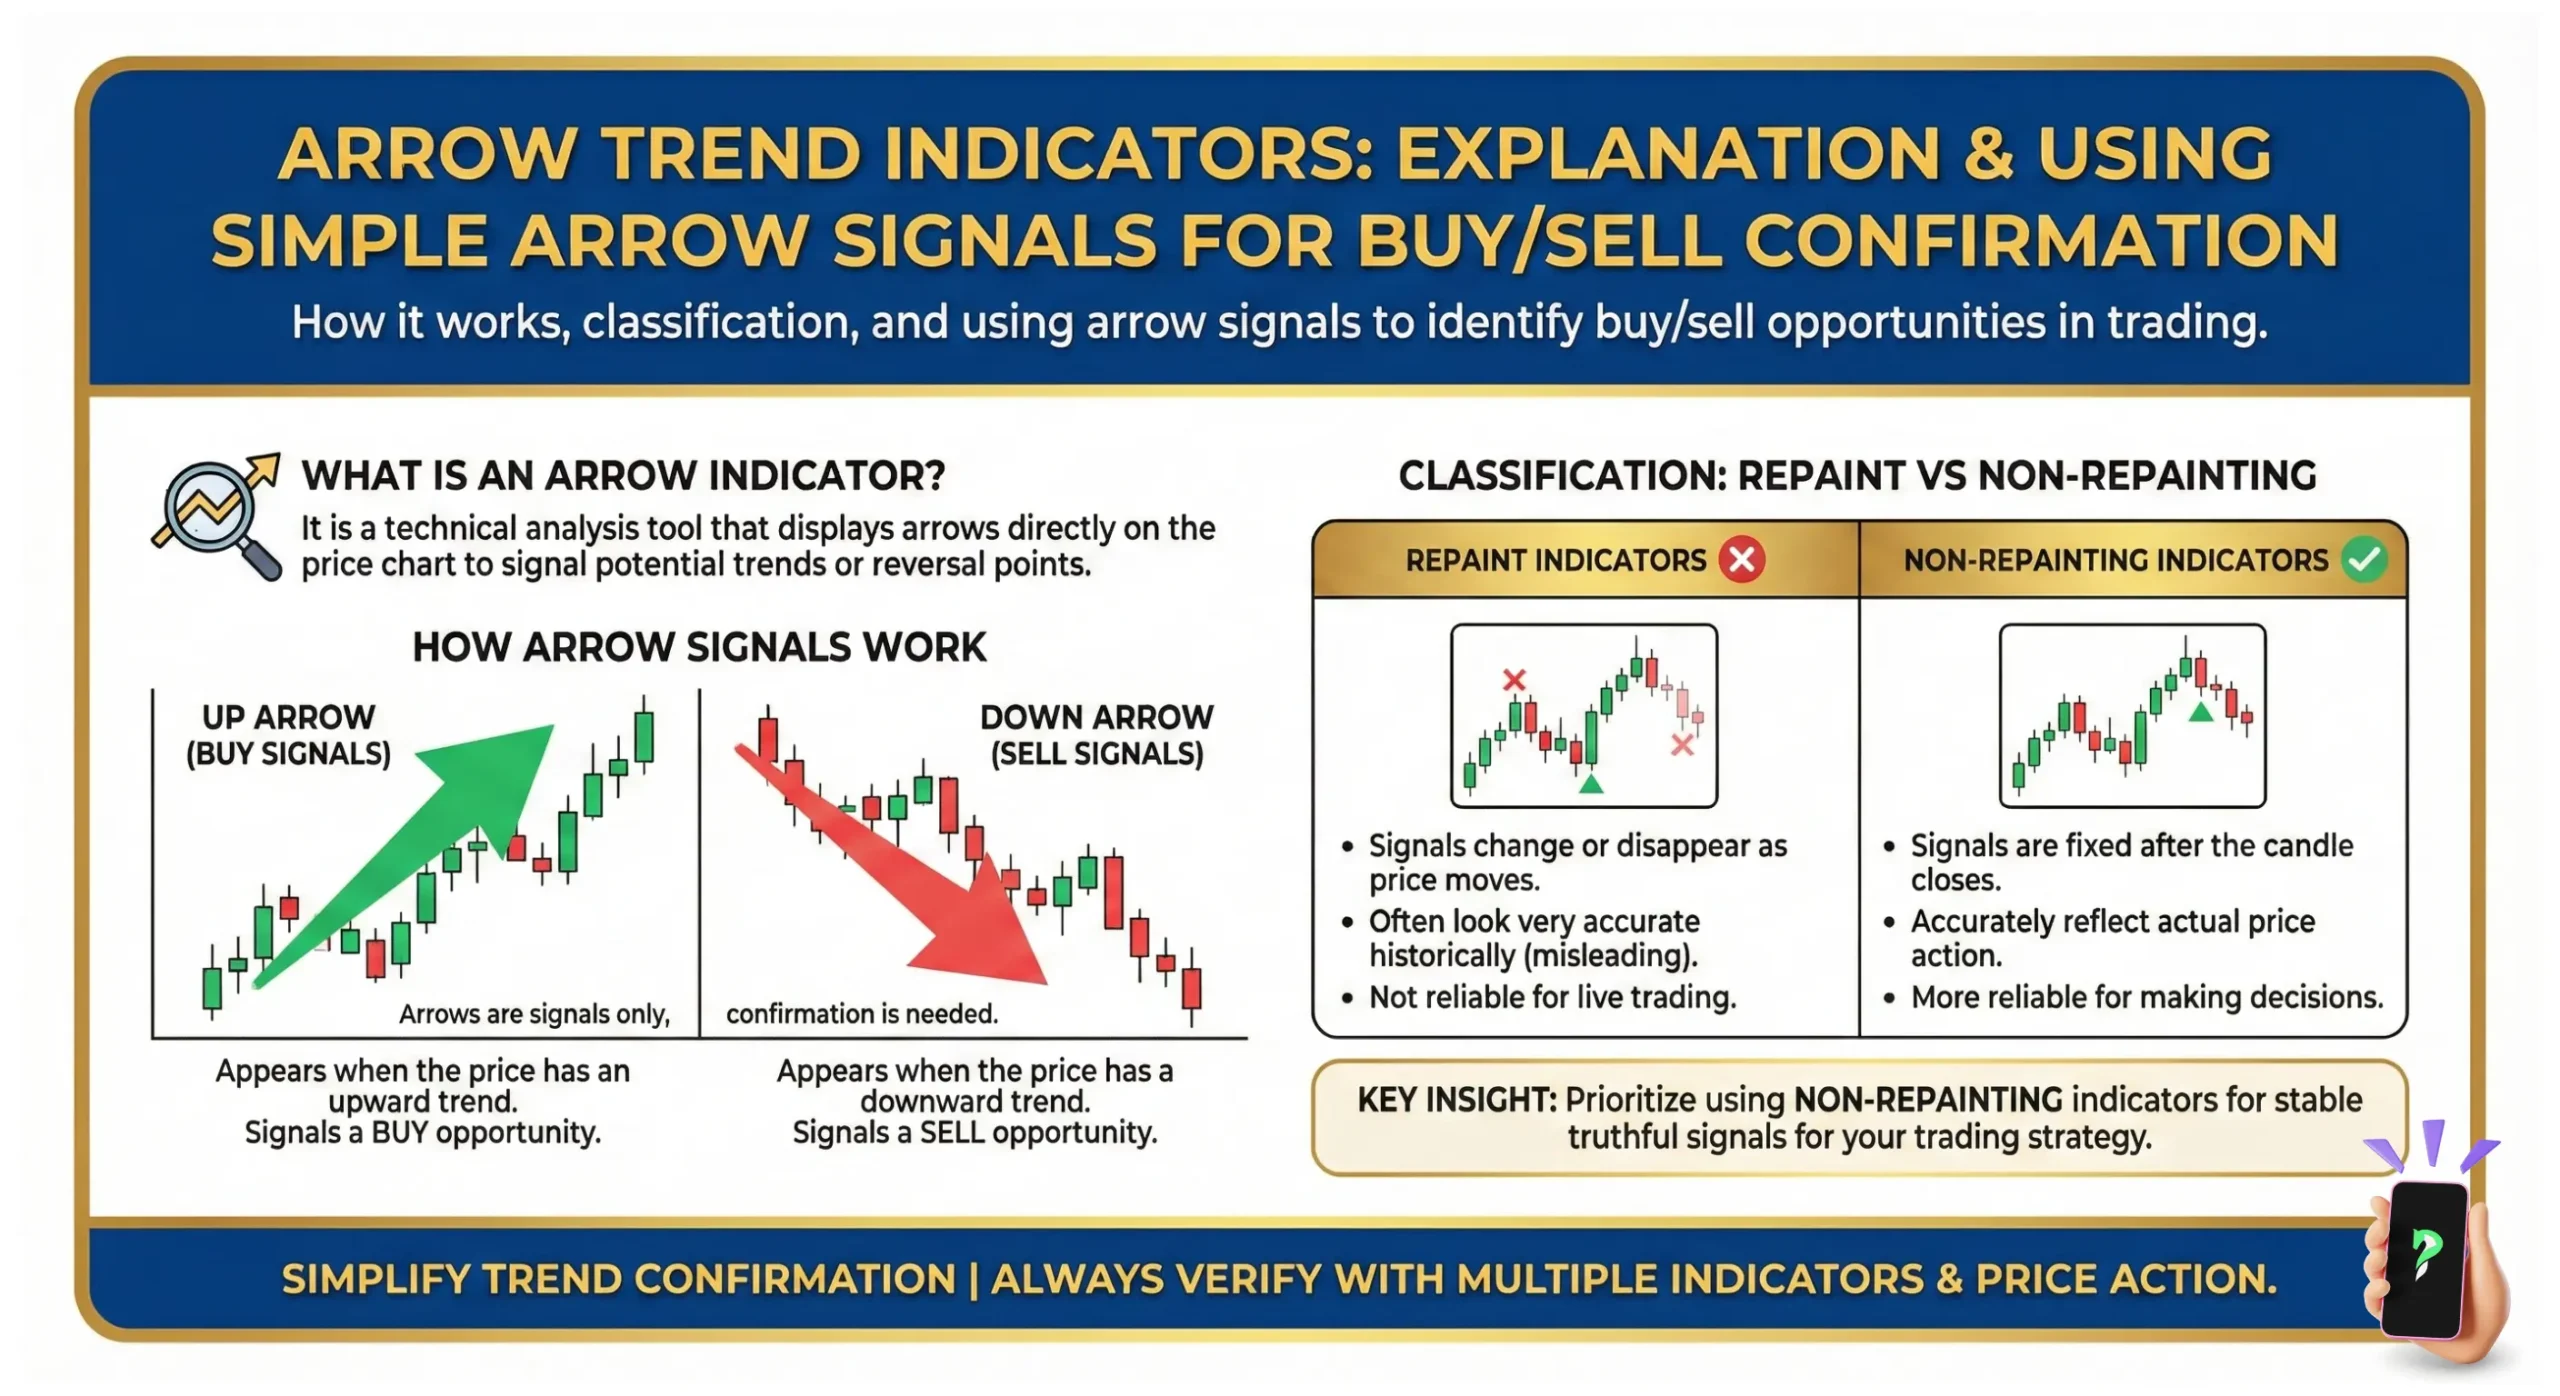
1. What is an arrow trend indicator?
Quick Summary
- Role: Arrow indicators serve as signal prompts, not absolute trade commands.
- Best use: Exceptional for scanning multiple markets and timeframes to identify potential setups quickly.
- Caution: They are “signal generators” meant to support your analysis, not replace it.
In the simplest terms, an arrow trend indicator is a visual tool that plots signals directly onto your price chart, telling you when a potential buying or selling opportunity might be forming.
Think of it like a traffic light for your trading:
- A green (or blue) arrow pointing up is your green light, suggesting potential upward momentum and a time to consider buying.
- A red arrow pointing down is your red light, suggesting potential downward momentum and a time to consider selling.
Their main purpose is to translate complex mathematical calculations into a single, easy-to-understand signal. This makes them incredibly appealing, especially if you find yourself paralyzed by “analysis paralysis” or an overwhelming amount of data on your screen.
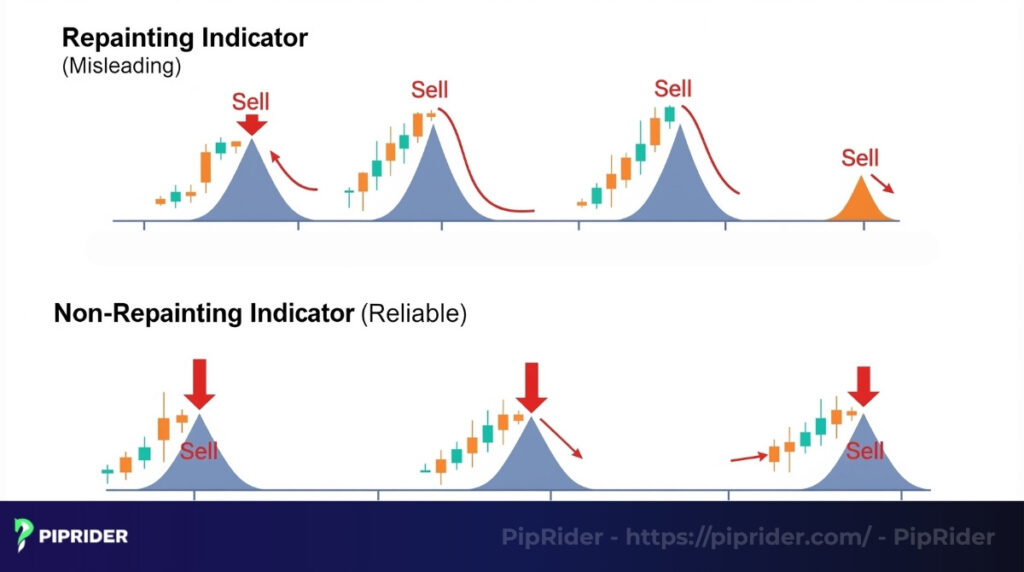
2. Non-Repainting vs. Repainting: The Golden Rule
Not all arrow indicators are created equal. There is one fundamental feature that separates a genuinely useful tool from a dangerously misleading one. Understanding this is non-negotiable for your capital safety.
The Golden rule: Never use a repainting arrow indicator for live trading decisions or backtesting. A “non-repainting” tool ensures that once an arrow is plotted on a closed price candle, that signal is permanent. It will not move, vanish, or rewrite itself based on future price action.
I have seen countless new traders fall into the “repainting trap.” You find an indicator that looks perfect in the past, showing a flawless history of winning signals, only to find it fails miserably in live trading.
What exactly is a “repainting” indicator? Imagine reading a history book where, after an event happens, the text rewrites itself to better fit the outcome. That is a repainting indicator. It will plot an arrow on a chart, but if the market moves against that signal, the arrow can move to a different candle or disappear entirely. This makes historical charts look amazing but provides zero predictive value.
Why must you insist on a “non-repainting” indicator? A non-repainting tool is honest. This is the only way you can accurately backtest a strategy and trust the signals you see in a live market environment. Every indicator recommended or discussed in this guide is of the non-repainting variety.
3. How Arrow Indicators Actually Work (The Logic)
Those arrows don’t appear by magic. They are the final, visual result of a logical “recipe” running in the background. As a trader, you need to know what ingredients are in that recipe to trust the signal.
Think of an indicator’s code as a set of instructions. It takes price data (open, high, low, close) and follows an algorithm. When the conditions are met, the final result is a signal arrow on your chart.
Common Recipes Behind the Arrows
Most arrow indicators are visual wrappers for classic, time-tested technical concepts. Understanding the logic helps you know when a signal is valid or likely to fail.
| Indicator Logic | What It Actually Detects |
|---|---|
| Moving Average Crossover | Momentum shifts and potential new trend formation |
| Oscillator Reversal (RSI/Stochastic) | Market exhaustion and potential mean reversion (Overbought/Oversold) |
| Volatility Breakout (Bollinger Bands) | Volatility expansion and the start of a high-momentum move |
| ATR-based Trend Following | Changes in volatility-adjusted trend direction (e.g., SuperTrend) |
By understanding these recipes, you can better align your indicator with the current market environment. For example, a “Volatility Breakout” arrow is far more reliable when the market has been quiet (low volatility) than in the middle of a chaotic, news-driven spike.
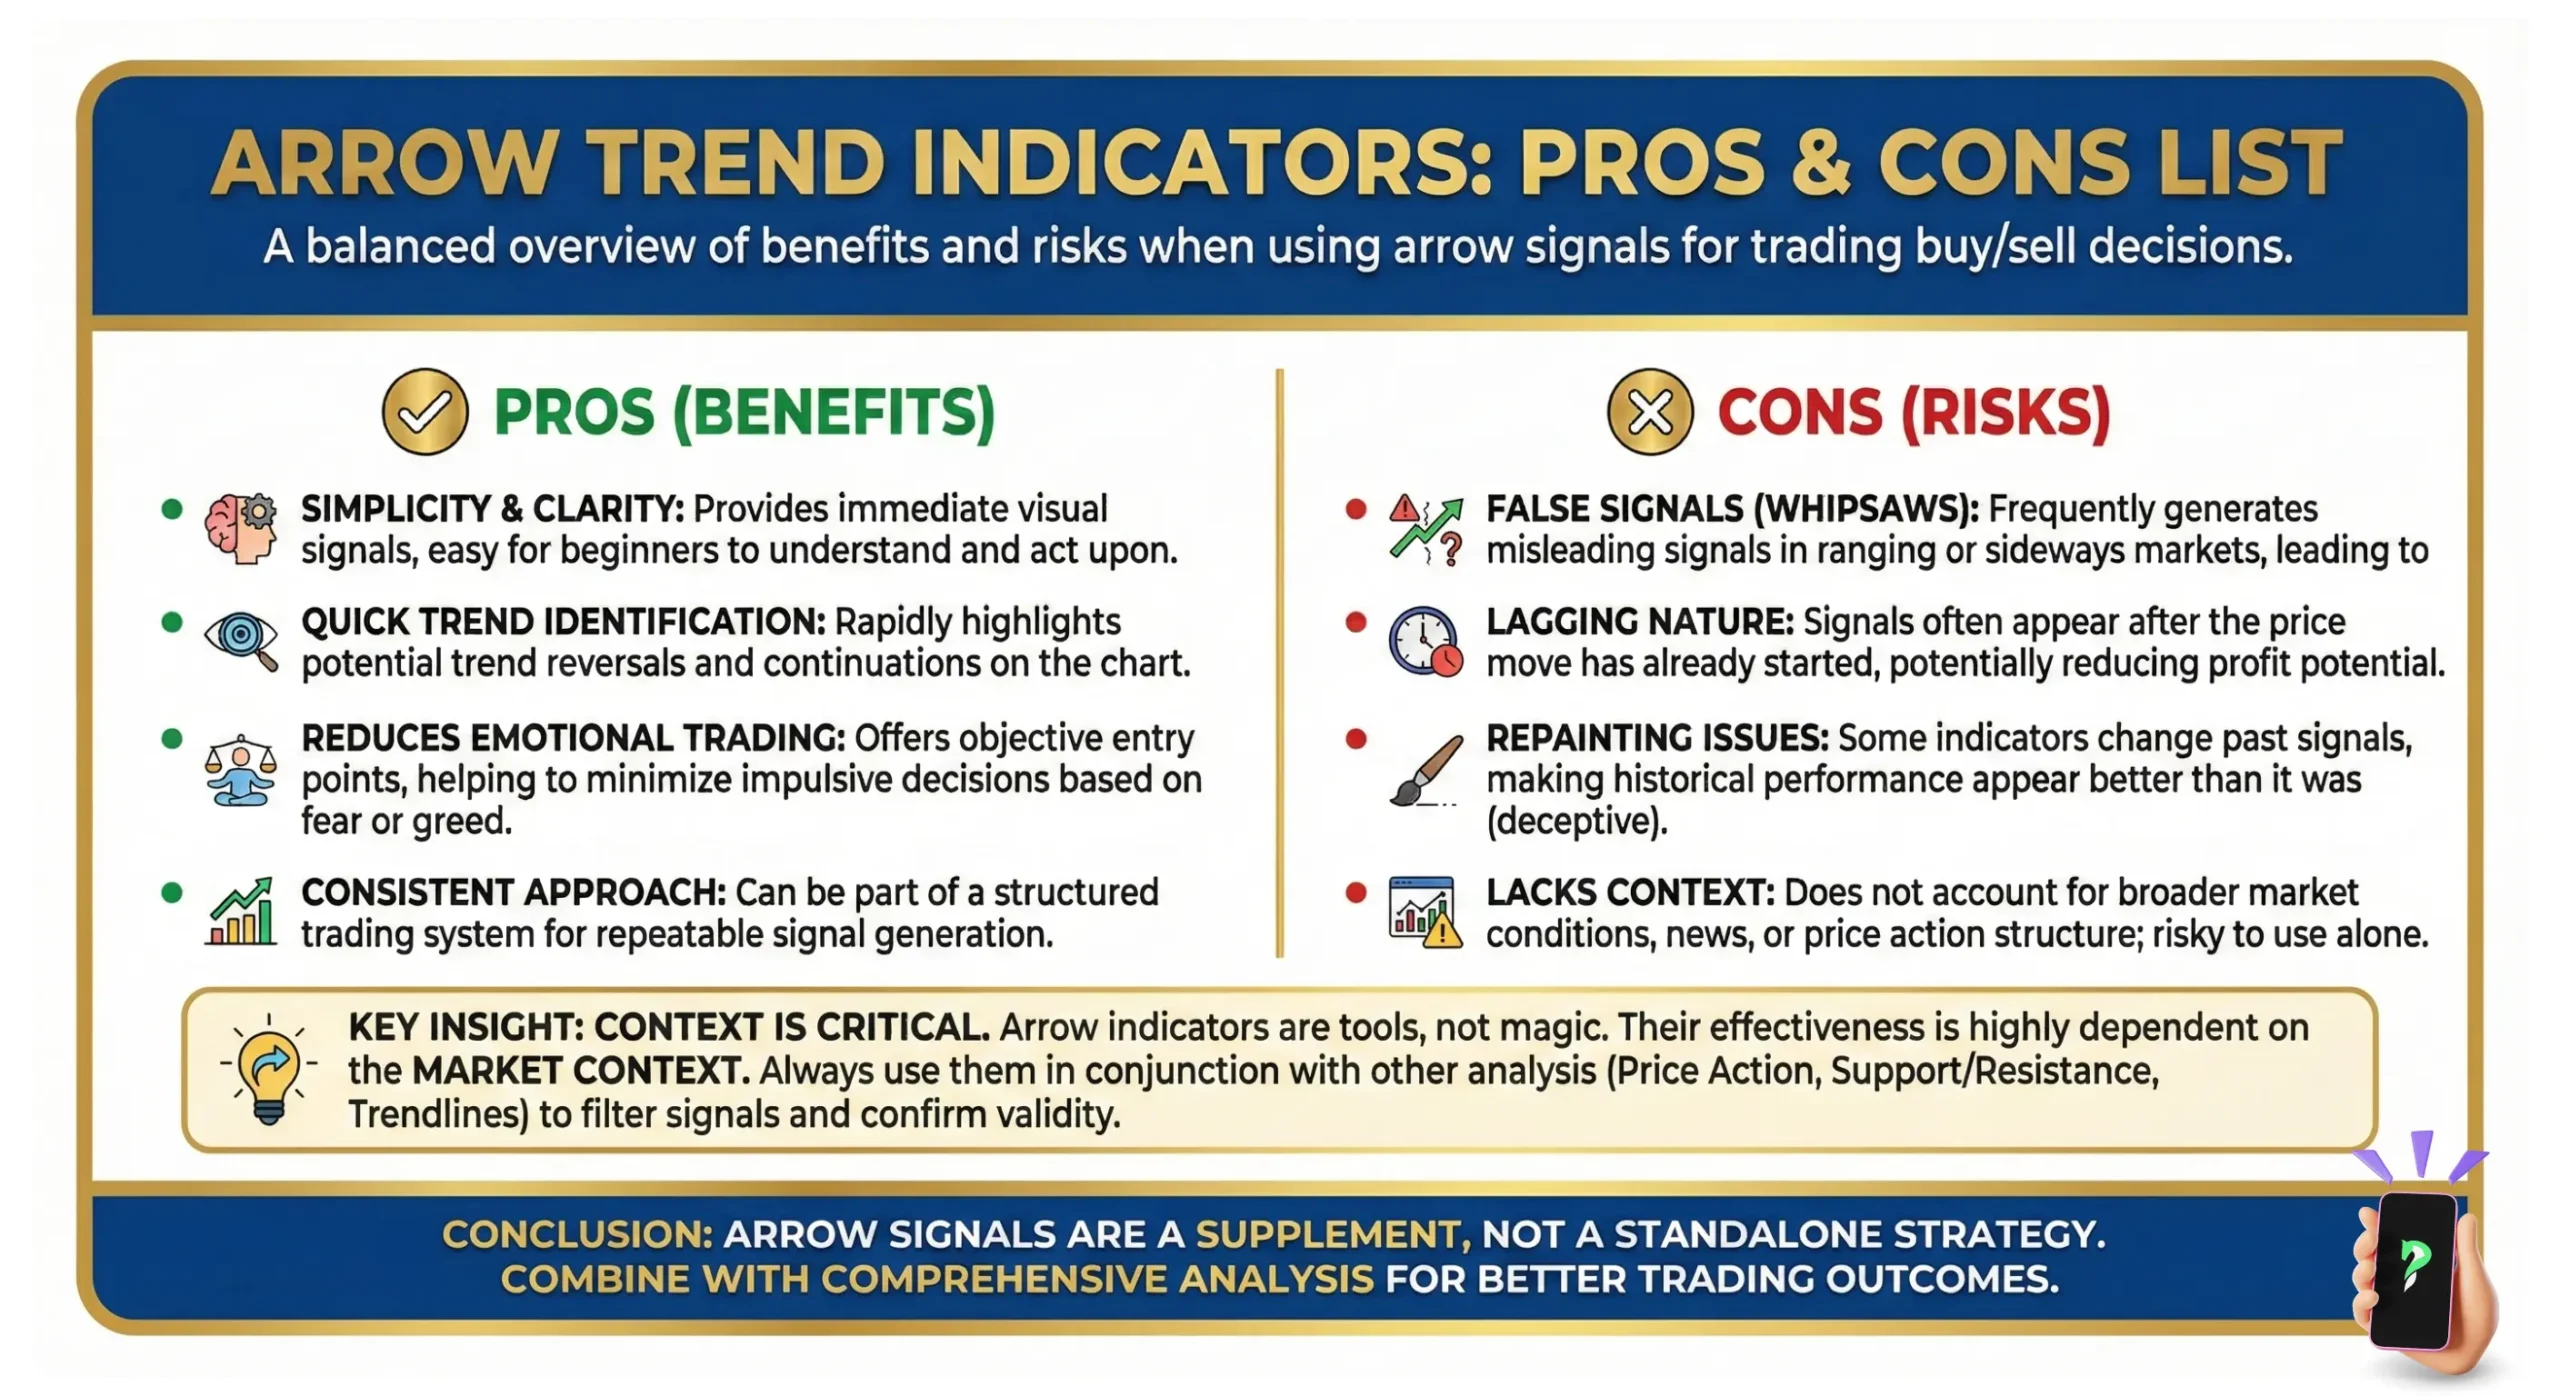
4. Pros and Cons of Arrow Trend Indicators
To manage your risk and expectations, you must have a balanced view of these tools. They offer powerful advantages but come with significant risks if misunderstood.
4.1. Advantages
When used correctly as part of a larger strategy, these indicators can significantly streamline your trading process.
- Reduces analysis paralysis: The single biggest benefit is clarity. Instead of weighing ten different factors at once, you get a single, clear prompt.
- Excellent for scanning: They allow you to quickly scan through many different markets or timeframes looking for potential setups.
- Promotes discipline: Because the signal is objective, it can help remove impulsive, emotion-based decisions from your trading.
4.2. Disadvantages and risks
However, it is equally important to have a clear-eyed view of their limitations.
- All arrow indicators are lagging: They analyze price data that has already happened. You will rarely catch the exact bottom or top with an arrow.
- False signals in choppy markets: When the market moves sideways without a clear trend, most arrow indicators will produce a frustrating series of losing signals.
- They can create lazy habits: Relying solely on arrows may prevent you from learning essential skills like reading price action and market structure.
Key takeaway: Arrow indicators simplify decisions, but they do not simplify the market.
5. 5 Popular types of arrow trend indicators
While names vary, most arrow indicators fall into a few conceptual categories. Understanding these types is key to choosing the right tool for your strategy.
- Super trend indicator: Uses market volatility (ATR) to plot a trailing line. An arrow appears when price breaks this line, signaling a potential trend flip.
- Moving average crossover arrows: A classic momentum tool. It plots an arrow when a short-term “fast” moving average crosses a long-term “slow” one.
- Oscillator reversal arrows: Seeks turning points by measuring momentum exhaustion (e.g., RSI or Stochastic). Arrows appear when the tool leaves “extreme” zones.
- Volatility breakout arrows: Identifies periods of low volatility (Bollinger Band squeeze) and plots an arrow when price breaks out with force.
- HalfTrend indicator: A trend-following tool that aims for lower-risk entries by waiting for pullbacks to a baseline before signaling.
Summary: Which Type Should You Use?
| Indicator Type | Best Market Condition | Suitable For | Main Weakness |
|---|---|---|---|
| Super Trend | Strong, sustained trends | Swing Traders | Whipsaws in flat markets |
| MA Crossover | New trend formation | Beginners | Lagging entry points |
| Oscillator Reversal | Range-bound markets | Reversal Traders | Risky in strong trends |
| Volatility Breakout | Post-consolidation | Breakout Traders | Frequent false breakouts |
| HalfTrend | Established trends | Prudent Traders | May miss early trend starts |
6. Which Arrow Indicator Fits Your Trading Style?
Choosing the right indicator is about finding a tool that aligns with your market outlook and personality. Use the framework below to narrow down your options:
| Trading Style | Recommended Type | Primary Reason | Main Risk |
|---|---|---|---|
| Beginner | MA Crossover Arrows | Simple logic; easy to verify with basic chart analysis. | Frequent whipsaws in sideways markets. |
| Swing Trader | Super Trend / Half Trend | Designed to capture and hold larger, sustained trend moves. | Lagging entry; can get in late to a move. |
| Breakout Trader | Volatility Breakout Arrows | Captures volatility expansion after quiet consolidation. | False breakouts (fakeouts) that reverse quickly. |
| Range Trader | Oscillator Reversal Arrows | Ideal for identifying “oversold” or “overbought” turning points. | Extremely dangerous in strong, trending markets. |
7. How to Choose a Good Arrow Indicator
Finding a “good” arrow indicator isn’t about finding a magic oracle; it’s about picking a tool that is reliable, transparent, and compatible with your plan. Use this 7-point Evaluation Checklist before adding any new tool to your strategy:
- Is it non-repainting? Verify that signals remain fixed after the candle closes.
- Is the logic transparent? Avoid “black-box” systems. You must understand if it’s based on MAs, RSI, or Volatility.
- Does it fit your typical market condition? Ensure the logic matches the environment you trade (e.g., don’t use a range tool in a trending market).
- Has it been thoroughly demo tested? Never trade a new indicator on a live account until you see its real-time behavior.
- Is the alert quality reliable? Signals must trigger consistently with visual and/or audio alerts to avoid missed entries.
- Does it suit your chosen timeframe? A tool designed for H4 may perform poorly for 1-minute scalping due to market noise.
- Can you logically explain the entry? If you can’t describe why the arrow appeared, you cannot trust the signal.
By applying this checklist, you filter out misleading “get rich quick” indicators and focus on robust technical tools.
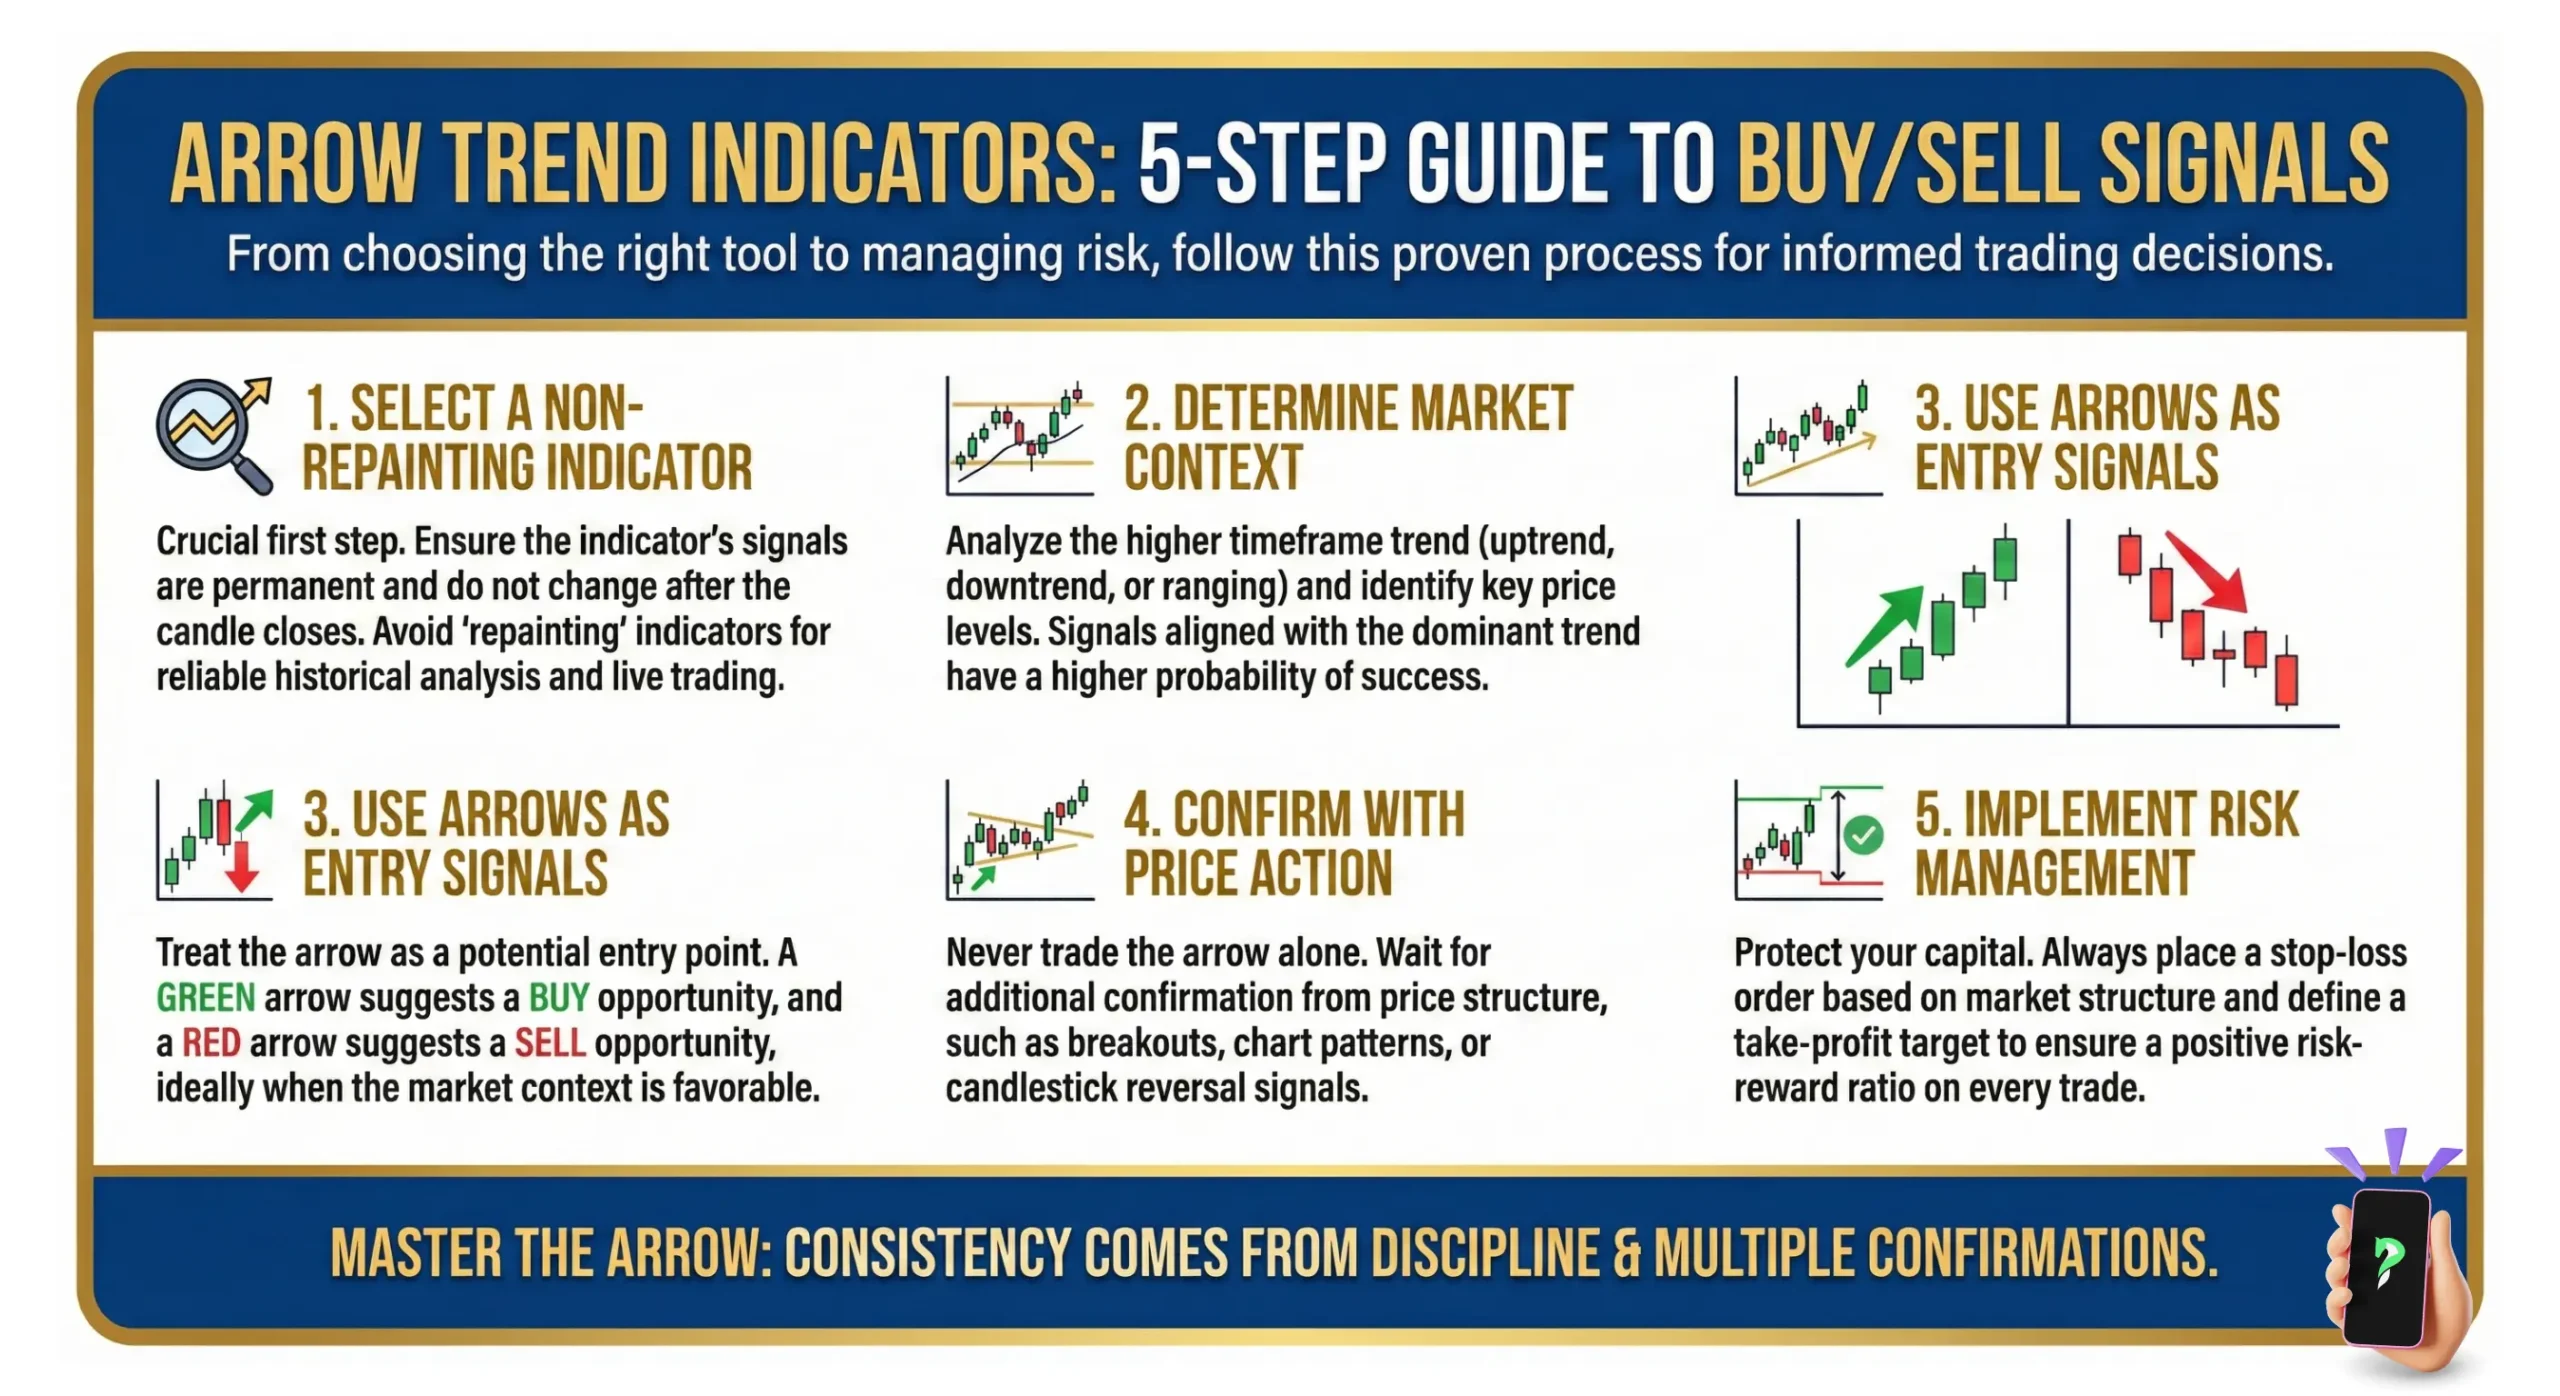
8. How to Use Arrow Indicators Safely (The Playbook)
Arrow indicators are simple to see, but using them correctly requires a disciplined workflow. Never click the buy or sell button just because a colored arrow appears. Instead, follow this 5-step Safe Entry Playbook:
Step 1: Identify the Market Context
Before looking at signals, determine the state of the market. Is it trending strongly, or is it trapped in a range?
- Action: Check if your chosen arrow type (e.g., Trend-following) actually suits the current market environment. If volatility is non-existent, most signals should be ignored.
Step 2: Check for Confluence
An arrow is just one piece of evidence. You need “confluence”—multiple factors pointing in the same direction—to increase your probability of success.
- Action: Look for overlap with key Support/Resistance levels, trendlines, or secondary indicators like RSI or MACD. If the arrow says “Buy” at a major Resistance level, the signal is high-risk.
Step 3: Wait for the Candle to Close
This is the most common mistake made by beginners. Many indicators plot arrows while the candle is still moving (the “live” candle), but the signal might disappear if price fluctuates.
- Action: Only enter a trade on the next candle after the arrow candle has fully closed. This ensures the signal is confirmed and “locked in” (assuming the tool is non-repainting).
Step 4: Define Your Risk (Stop-Loss)
An arrow tells you when to enter, but it rarely tells you where to get out if you are wrong.
- Action: Place a stop-loss based on market structure—typically just below a recent swing low for buy trades or above a swing high for sell trades. Aim for a minimum Risk-to-Reward (R:R) ratio of 1:2.
Step 5: Manage the Trade
Once you are in, have a plan for exit. Don’t wait for a reverse arrow to exit, as that often gives back a large portion of your profits.
- Action: Use trailing stops or fixed profit targets at key historical levels. If a signal candle is immediately invalidated by a strong move in the opposite direction, exit quickly to protect your capital.
9. When Arrow Indicators Work Best vs. When They Fail
Use the summary below to decide when to trust your indicator and when to stay on the sidelines.
Arrow Indicators Work Best When:
- The market is in a clear, sustained trend.
- Volatility is healthy and stable (not erratic).
- You use them purely as confirmation for an existing setup.
- Signals appear on larger timeframes (H1, H4, D1).
- Market structure (Support/Resistance) supports the signal direction.
Arrow Indicators Often Fail When:
- The market is sideways, “flat,” or choppy.
- You enter immediately during a high-impact news event.
- You chase every single signal without confluence.
- The indicator is “repainting” (signals move or vanish).
- You ignore higher timeframe trends (trading against the big move).
10. Case Study: Trading a Buy Arrow on Gold (XAU/USD)
Let’s look at a practical application using the H1 timeframe on Gold. Imagine a blue buy arrow appears from a HalfTrend indicator. Here is how a disciplined trader processes that signal:
- Market context: Price has been in a macro bullish structure on the daily chart. On the H1 chart, price has just pulled back to a key horizontal support level that held twice in the previous 48 hours.
- The signal: A buy arrow appears exactly at this support zone.
- Confluence check: Looking closely, the arrow candle is a “bullish pin bar” with a long lower wick, indicating rejection of lower prices at support.
- Execution:
- Entry: Open a buy trade at the start of the next candle ($1920.50$).
- Stop-Loss: Placed $5$ pips below the low of the pin bar ($1915.00$).
- Take-Profit: Targeted at the nearest recent resistance level, providing a $1:2.5$ Risk-to-Reward ratio.
- Lesson learned: The arrow was not the sole reason for the trade. It acted as the final confirmation that validated the support level and bullish price action.
11. How to Install and Customize an Arrow Indicator
Adding a new tool to your platform is straightforward. Follow this 4-step checklist to get started, specifically for the popular MetaTrader 4 (MT4) platform:
- Get the file: Download your chosen indicator file (usually ending in
.mq4or.ex4). - Access the folder: Open your platform, go to File > Open Data Folder, then navigate to MQL4 > Indicators.
- Paste & Refresh: Paste your file into the folder. In the platform’s ‘Navigator’ window, right-click ‘Indicators’ and select Refresh.
- Activate & Customize: Drag the indicator onto your chart. In the settings box, adjust Inputs (for logic periods) and Colors (to make arrows visible) before enabling Alerts.
12. Frequently asked questions (FAQs)
Let’s address some of the most common questions I hear from traders.
13. Conclusion: Building Your Strategic Hub
Arrow trend indicators are valuable signal generators, but they should never be the sole decision-makers in your trading. Their true power lies in their ability to simplify complex data and provide objective confirmation for a well-researched trade idea.
To become a consistently profitable trader, use this guide as a starting point to build your own strategic hub:
- Master the basics: Learn the logic behind RSI, MACD, and ATR to understand what your arrows are truly measuring.
- Refine your strategy: Combine your favorite arrow tool with Price Action and Support & Resistance for a complete playbook.
- Equip Your Workspace: Browse Best MT4 Indicators or explore our TradingView Guide to find tools that fit your style.
Treat the arrow as the “final check” in your checklist. When you combine visual clarity with deep market knowledge, you transform from a reactive trader into a strategic one.
Infographic Section
-
Arrow Trend Indicators: Pros and Cons List -
Arrow Trend Indicators: 5-Step Guide -
Arrow Trend Indicators: Explanation


