
In trading, volatility is the one thing you can always count on. But how do you measure it? Understanding market volatility is key to managing risk, and the ATR indicator is one of the most reliable tools for the job. It gives you a clear, numerical way to gauge how much an asset’s price is moving.
This A-Z guide will walk you through everything you need to know. We’ll cover what it is, how it’s calculated, and most importantly, how you can use it to make smarter trading decisions.
Key Takeaways
- The Average True Range indicator is a tool for measuring market volatility, not for determining the direction of a trend.
- Its most powerful application is setting adaptive stop-losses using a multiple of the ATR value, such as two or three times the ATR.
- To maintain consistent risk, traders use the ATR to adjust position sizes, trading smaller in high-volatility markets and larger in low-volatility markets.
- A sudden spike in the ATR can be used to confirm the strength and conviction behind a price breakout, rather than as a signal to predict one.
- Unlike simpler calculations, the ATR provides a more complete picture of volatility because its formula accounts for price gaps between trading sessions.
1. What is the average true range (ATR)?
To get a clear measure of market volatility, traders turn to the Average True Range (ATR). This technical indicator provides a single value that represents the average size of an asset’s price movements over a specific number of periods, with 14 being the most common setting.
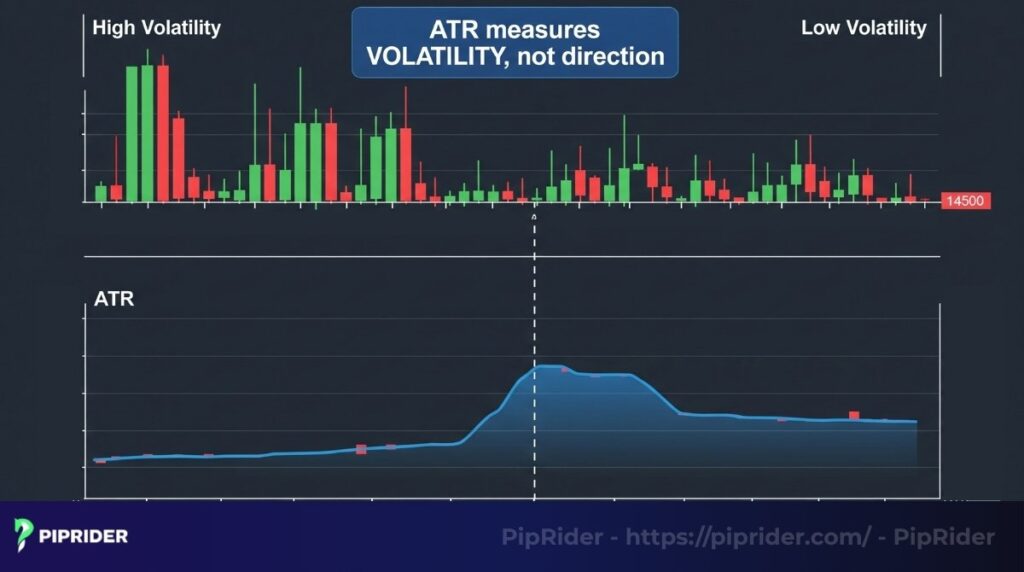
The most important takeaway is that ATR reveals how muchthe price is moving (its volatility), but it will not tell youwhich wayit’s headed (the trend). In my personal trading, this distinction is absolutely crucial; I see many new traders try to use ATR to predict direction, which it simply isn’t designed for. Its real power lies in helping you understand the market’s “breathing room” and adjusting your risk accordingly.
The indicator was developed by the renowned technical analyst J. Welles Wilder Jr. He first introduced it in his 1978 book, “New Concepts in Technical Trading Systems.” This book also introduced other classic indicators like the RSI and Parabolic SAR, cementing Wilder’s legacy in the trading world.
2. What does the ATR tell you?
The value of the ATR gives you direct insight into the market’s current state of volatility. It provides context to price movements.
2.1. Interpreting a high ATR value
A high ATR value is a clear signal that the market is experiencing significant price swings. This means that, on average, the price is covering a much larger distance within each period, whether that’s an hour, a day, or a week.
Such conditions typically arise during periods of strong trending movements, major economic news releases, or unexpected geopolitical events that inject uncertainty and rapid shifts into the market.
- For instance, let’s say the EUR/USD pair typically has an ATR of 0.0015 (15 pips). If that value suddenly shoots up to 0.0050 (50 pips), it’s a clear sign that the average price movement per session has more than tripled.
2.2. Interpreting a low ATR value
Conversely, a low ATR reading suggests that the market is relatively quiet and exhibiting low volatility. In these conditions, price movements within each period are much smaller and less aggressive.
This often indicates periods of consolidation, where buyers and sellers are in a state of equilibrium, or during times of low trading volume, such as during holiday periods or late in trading sessions.
- Example: Continuing with EUR/USD, if its typical ATR is around 70 pips during the London session, but it drops to 20 pips during the late Asian session, it tells you the market is calm and consolidating. This often happens during sideways trends or periods of low trading volume.
2.3. A visual example on a chart
Imagine looking at a chart for a stock like Tesla.
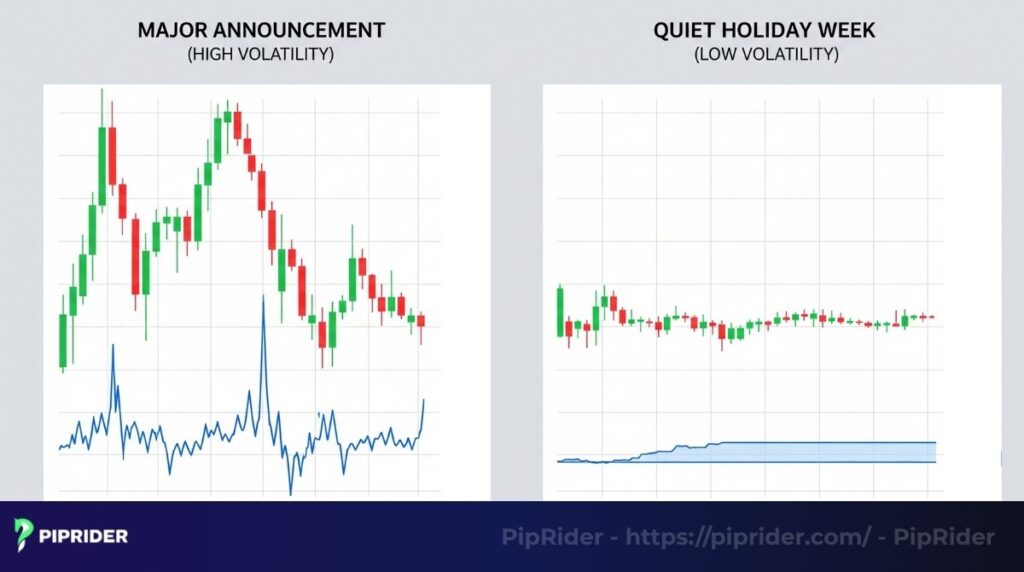
On a day with a major announcement, you would see long candle bars and the ATR line below the chart would spike upwards. On a quiet holiday week, the candles would be much shorter, and the ATR line would be flat or trending down.
3. How to calculate the ATR indicator
While your trading platform does the work for you, understanding the calculation helps you appreciate what the indicator is actually telling you. It’s a two-step process.
Step 1: Grasping the concept of “True Range” (TR)
The calculation starts with the “True Range.” The word “true” is key here because, unlike a simple high-low calculation, it also factors in price gaps that can occur between trading sessions.
Step 2: Breaking down the True Range (TR) formula
To find the True Range, you must calculate three separate price ranges. The TR is simply the highest number that results from these three calculations:
- First, the simple range of the current session (its high minus its low).
- Second, the span from the current session’s high to the previous session’s closing price.
- Third, the span from the current session’s low to the previous session’s closing price.
4. A calculation example of ATR indicator
To truly grasp how the Average True Range (ATR) works, it helps to walk through a practical example. Below is a step-by-step calculation showing how to derive the True Range (TR) for each day and then use those values to compute the ATR over a specified period.
| Day | High | Low | Close | Calculation of TR (Max of 3 values) | TR Value |
| 1 | 10 | 7 | 9 | (High – Low) = $10 – $7 = 3 | $3 |
| 2 | 12 | 8 | 11 | (High – Low) = $12 – $8 = 4 (High – Prev Close) = $12 – $9 (from Day 1) = 3 (Low – Prev Close) = abs($8 – $9) (from Day 1) = 1 Max = 4 | $4 |
| 3 | 11 | 9 | 10 | (High – Low) = $11 – $9 = 2 (High – Prev Close) = $11 – $11 (from Day 2) = 0 (Low – Prev Close) = abs($9 – $11) (from Day 2) = 2 Max = 2 | $2 |
- Calculating the initial ATR: For the very first ATR value (using a 3-period example), you just take the simple average of the first 3 TRs: (3 + 4 + 2) / 3 = 3.33.
- Calculating subsequent ATRs: From the fourth day onwards, the smoothing formula is used to keep the average rolling: ATR = (Previous ATR * (n – 1) + Current TR) / n.
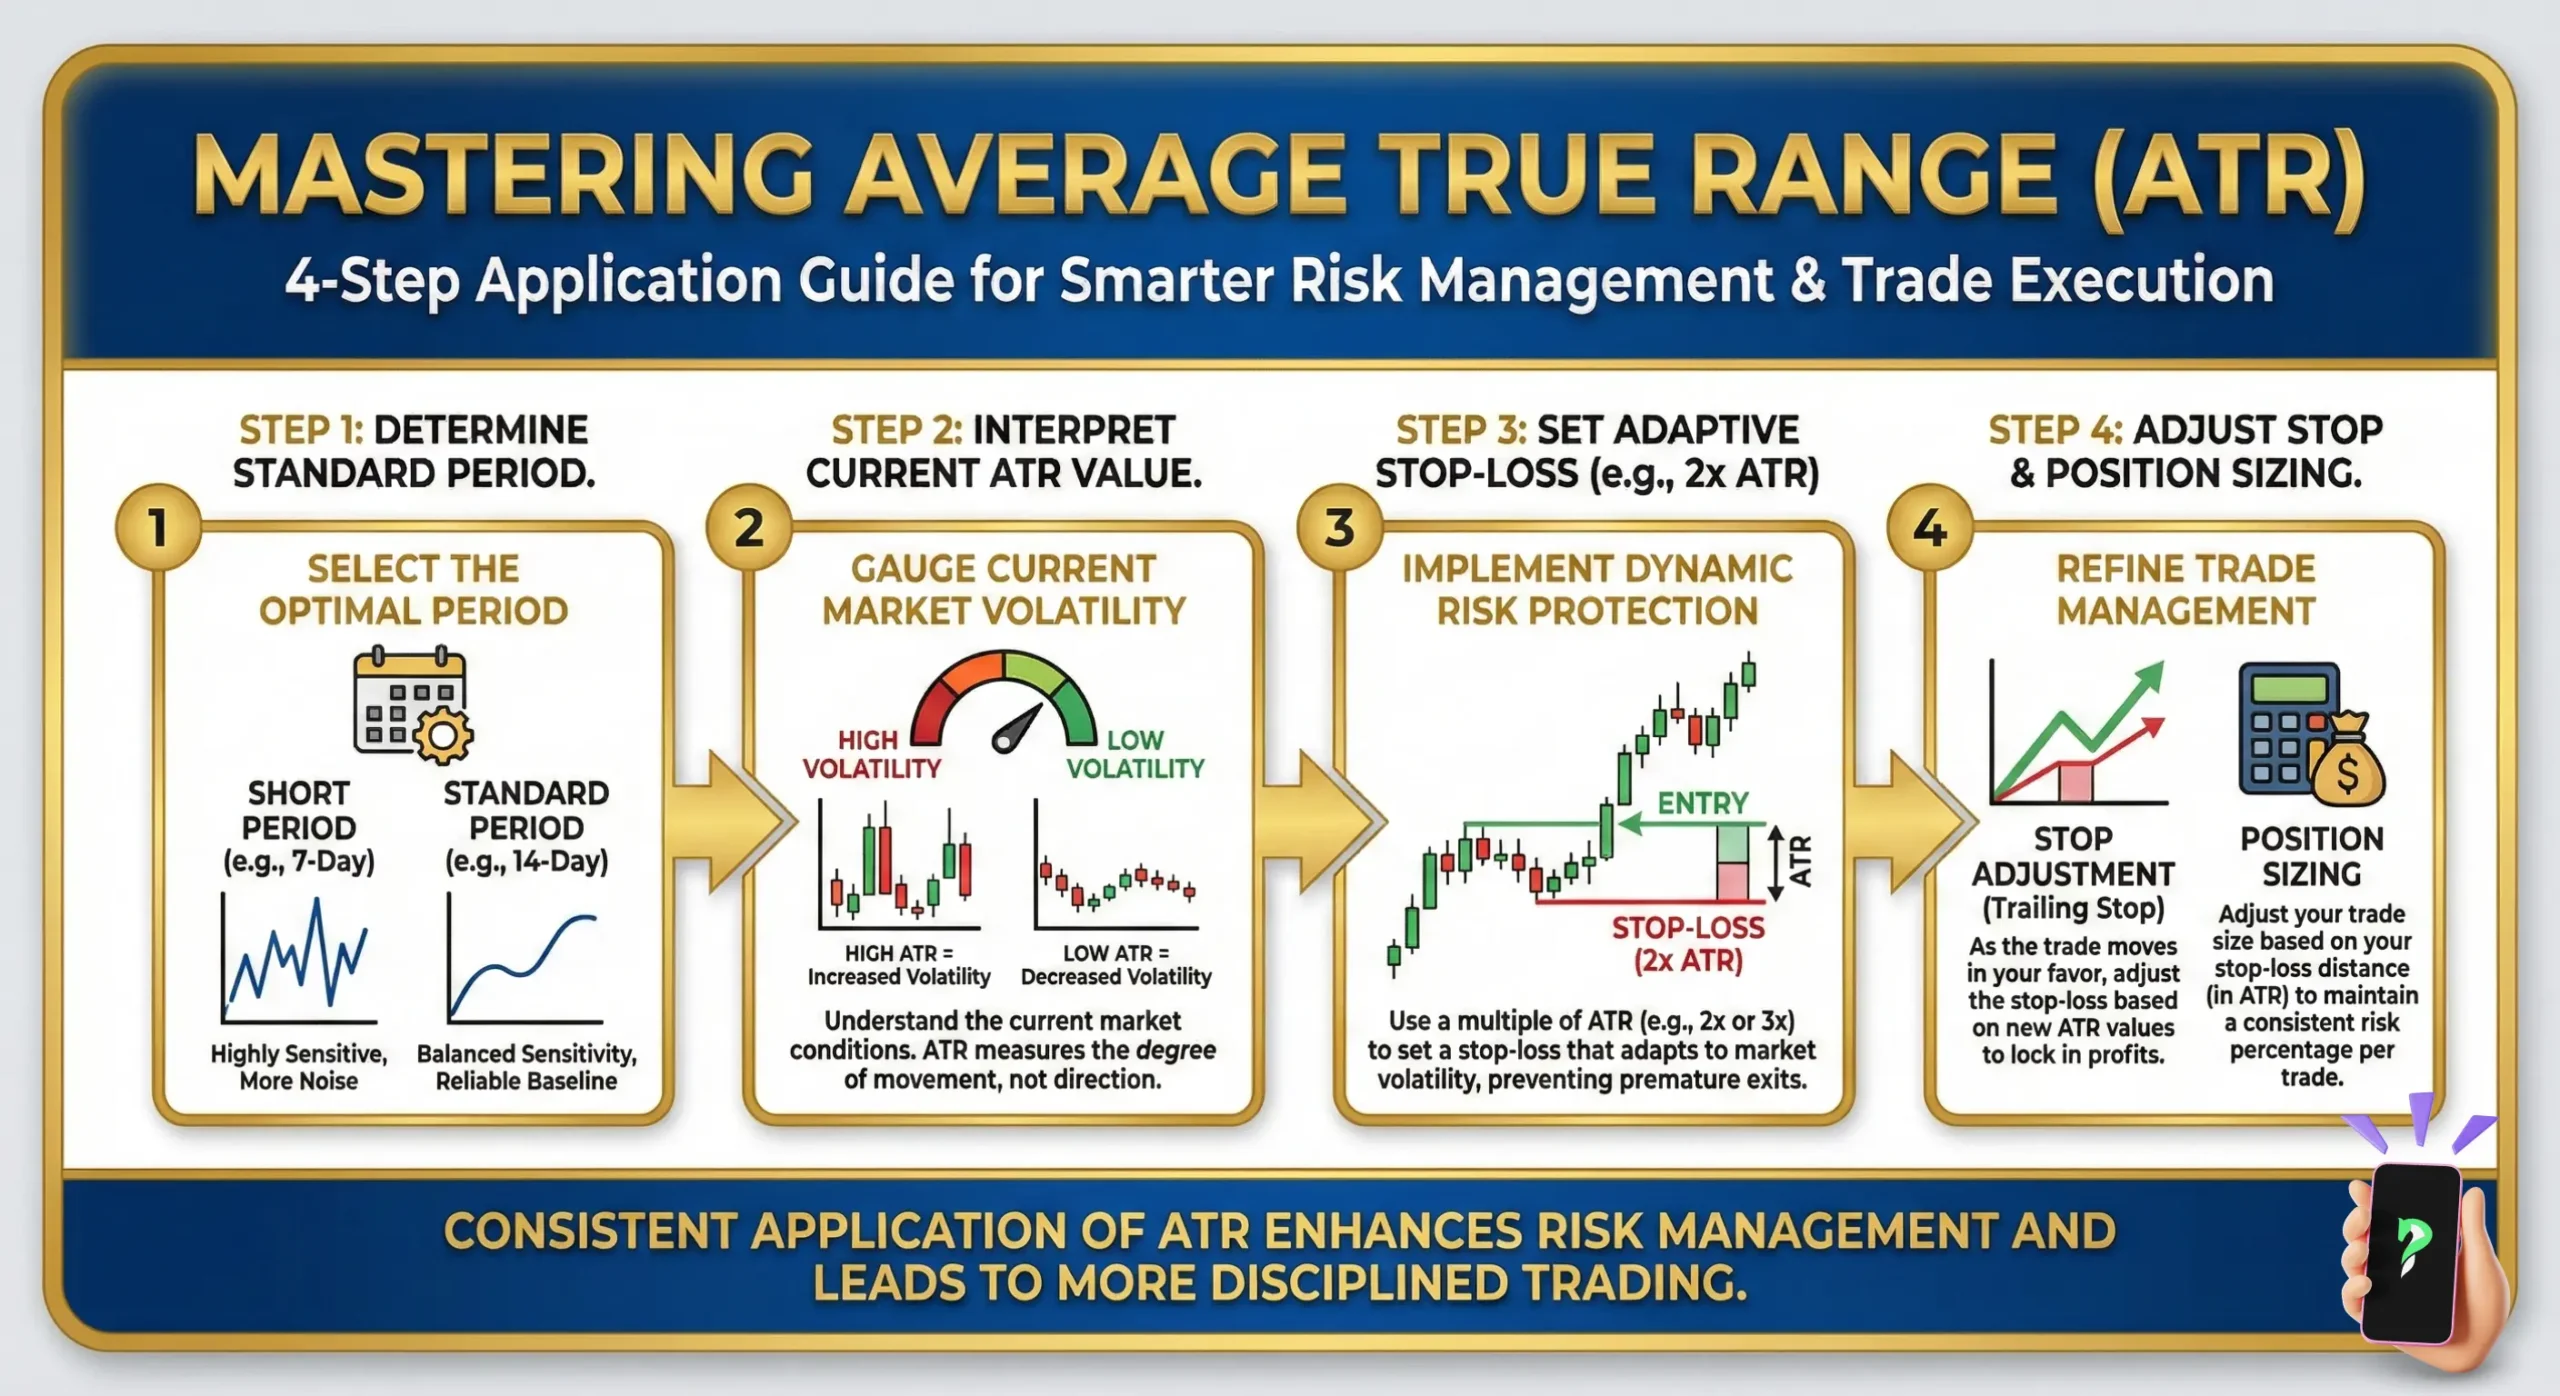
5. Practical applications of the ATR indicator in trading
This is where the theory becomes practical. The ATR is not a standalone signal for buying or selling; it is a support tool for managing your trades.
5.1. Setting dynamic stop-loss orders
Its primary and most celebrated role is in the field of risk management. Instead of a fixed stop-loss that fails to adapt, the ATR allows you to set a stop-loss that respects the market’s current volatility.
- The logic: In a high-volatility market, you need a wider stop to avoid being shaken out by random noise. Conversely, when the market is calm (low ATR), a tighter stop-loss can be used to protect capital more effectively.
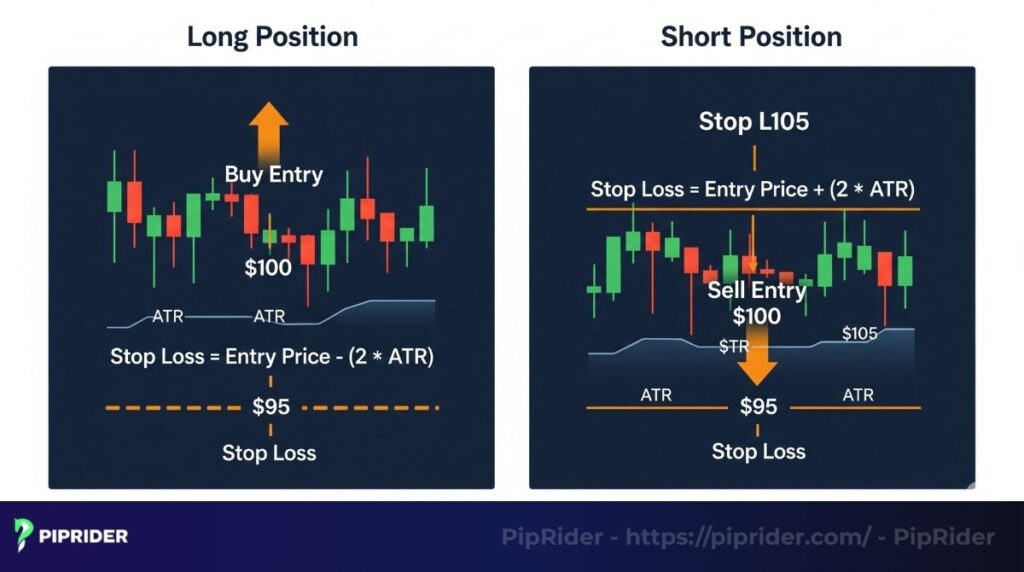
- The application is straightforward:
- When you’re buying (long position), the stop-loss is placed below your entry by subtracting a multiple of the ATR.
- When you’re selling (short position), the logic is reversed: the stop-loss is placed above your entry by adding a multiple of the ATR.
(Note: “X” is typically 2 or 3).
- Personal insight: I personally start with a 2x ATR multiple. If I’m trading a very volatile asset like a cryptocurrency or an exotic pair, I might widen it to 3x. This gives the trade room to breathe and prevents getting stopped out on a meaningless price spike that is still within the asset’s normal daily movement.
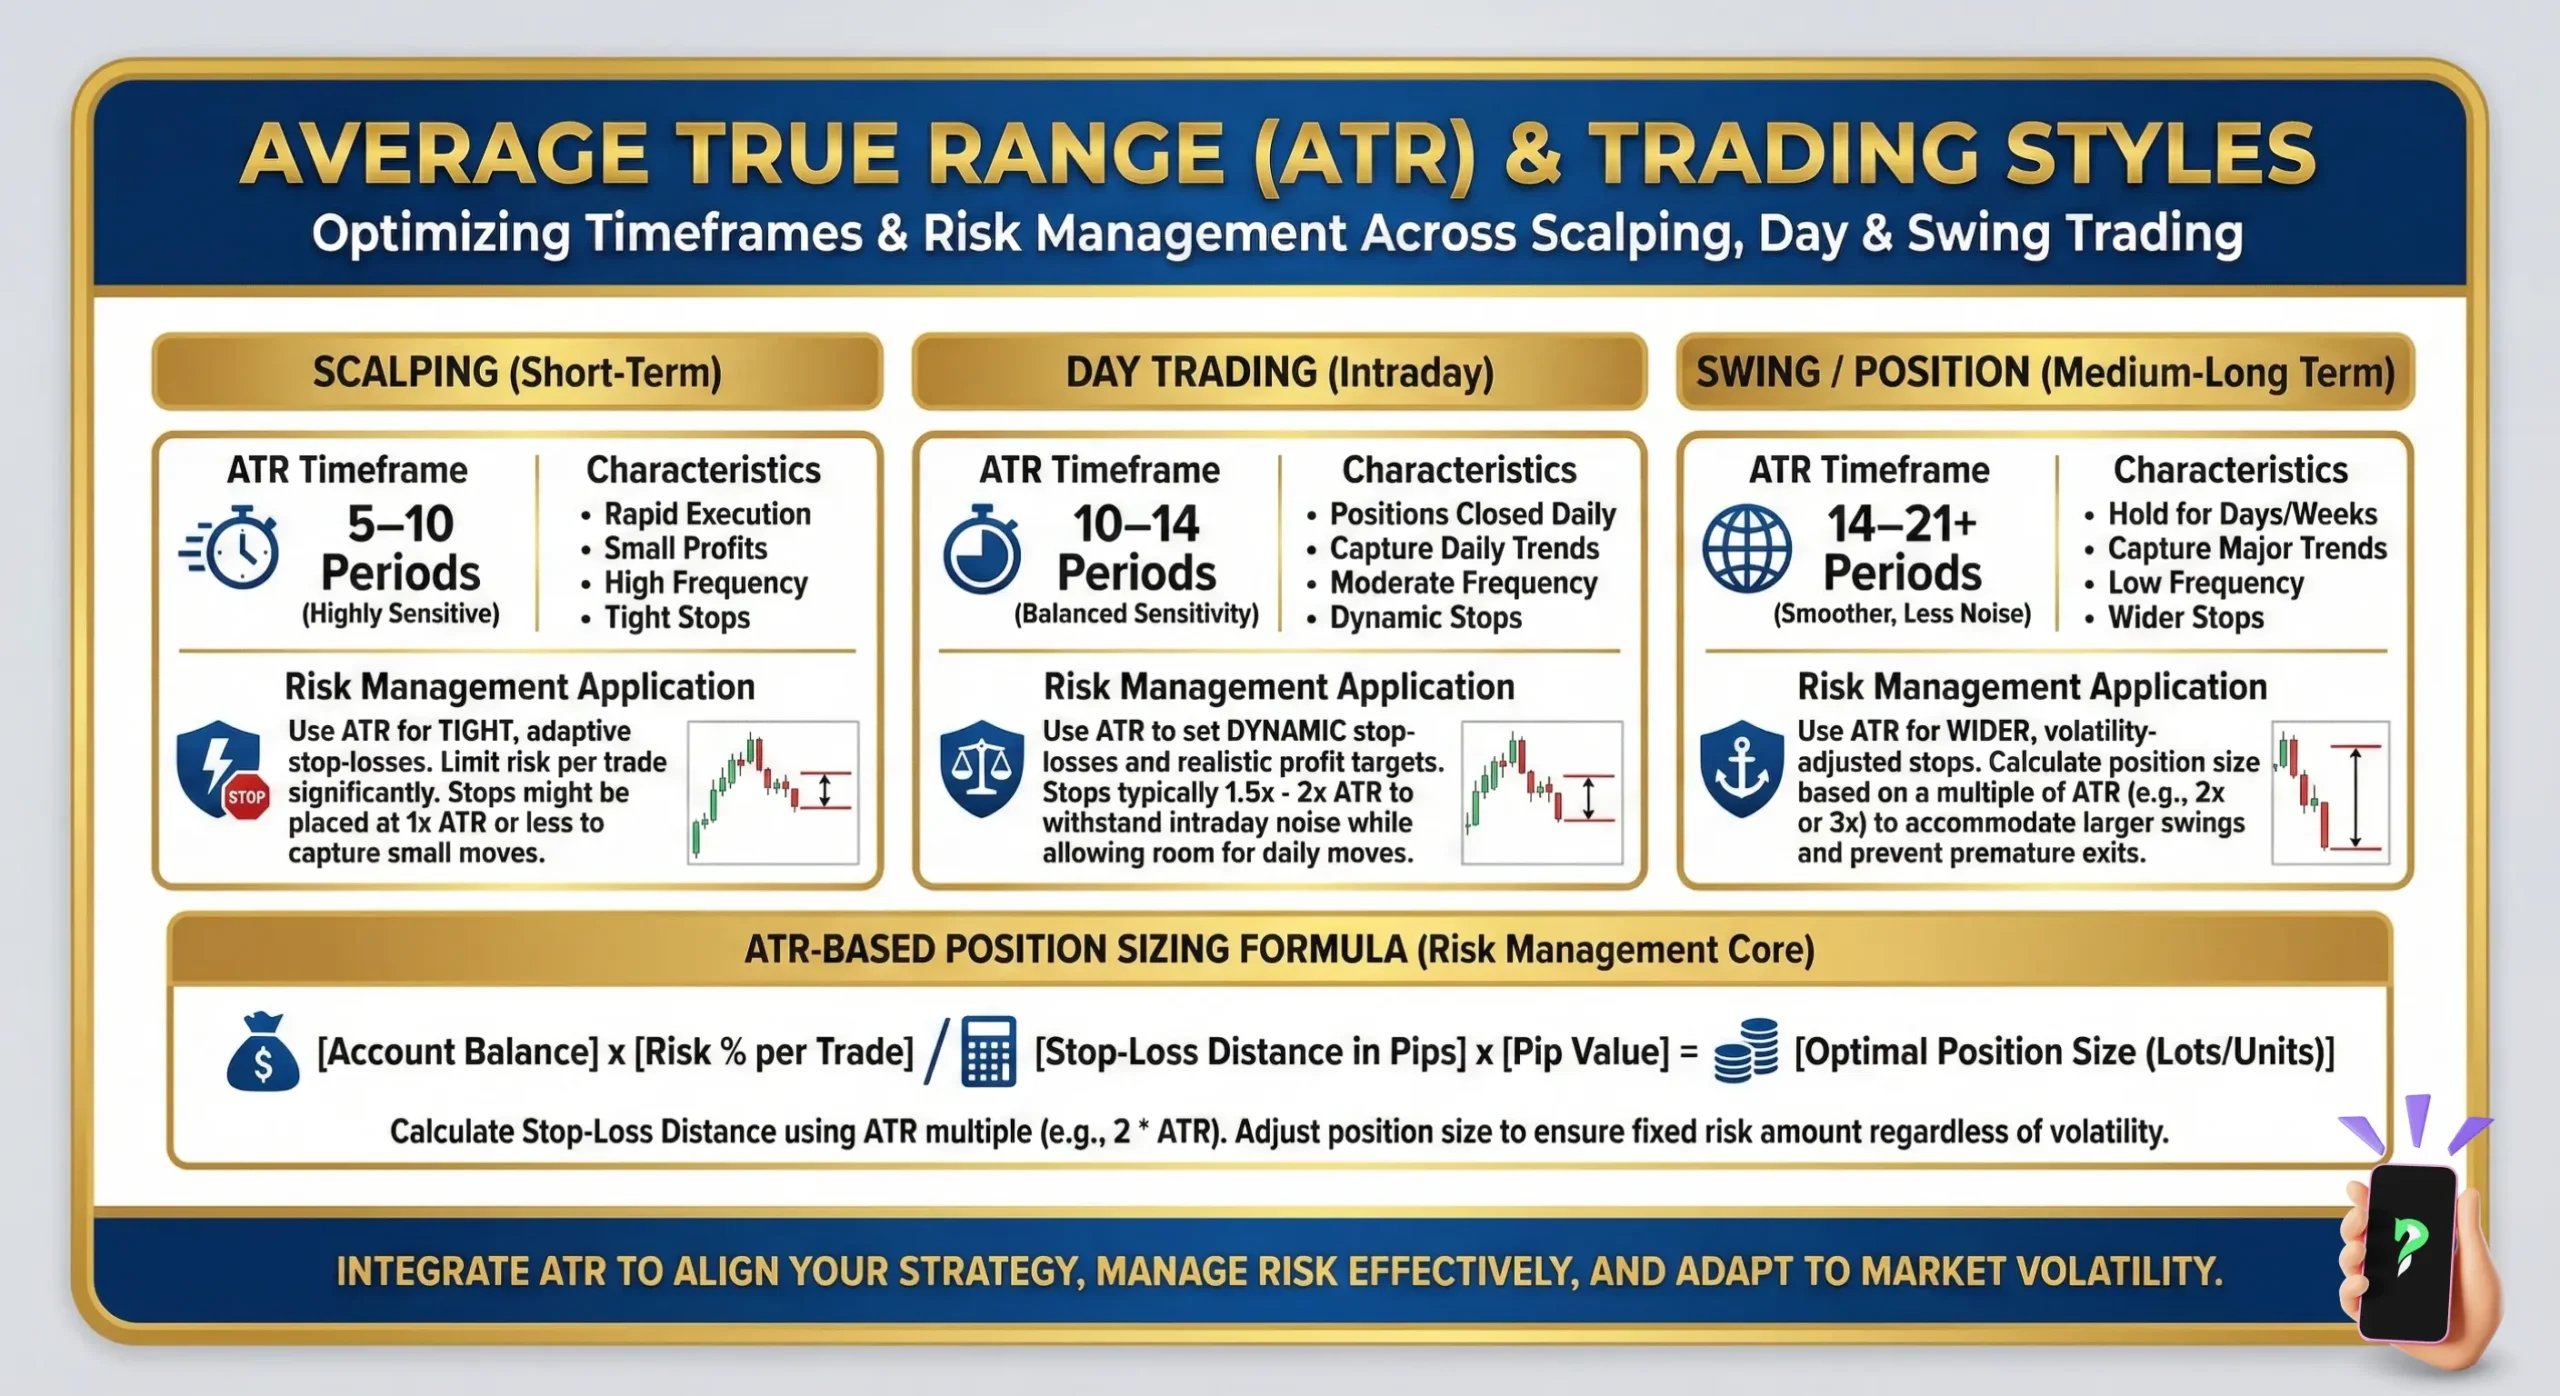
5.2. Determining position size
Smart traders risk the same percentage of their account on every trade. The ATR helps you adjust your position size to achieve this.
- The logic: If a stock is very volatile (high ATR), you need to buy fewer shares to maintain your risk limit. If it’s very stable (low ATR), you can buy more shares.
- An actionable formula:
- First, define your risk per trade (e.g., 1% of a $10,000 account = $100).
- Next, determine your stop-loss distance in dollars (e.g., 2 * ATR value).
- Position Size = Risk Amount / Stop-Loss Distance
- Example: Your risk is $100. For a stock with a $1.50 ATR, your stop-loss distance in dollars would be calculated as (2 * $1.50) = $3. Your position size would then be: $100 / $3 ≈ 33 shares.
5.3. Confirming the strength of a breakout
A genuine breakout should be accompanied by a surge in momentum and volatility.
- The key is to observe the ATR indicator before the price breaks out. If it’s low and flat, it means the market is consolidating. As the price breaks a key level, if you see the ATR value spike upwards significantly (e.g., doubling or tripling from its recent average), it adds strong confirmation that big players are behind the move.
6. Best ATR indicator strategies
ATR becomes truly powerful when combined with indicators that give context on trend direction or momentum.
6.1. Riding trends with Moving Averages and ATR
This strategy combines a Moving Average to identify the trend direction with the ATR for dynamic trade management.
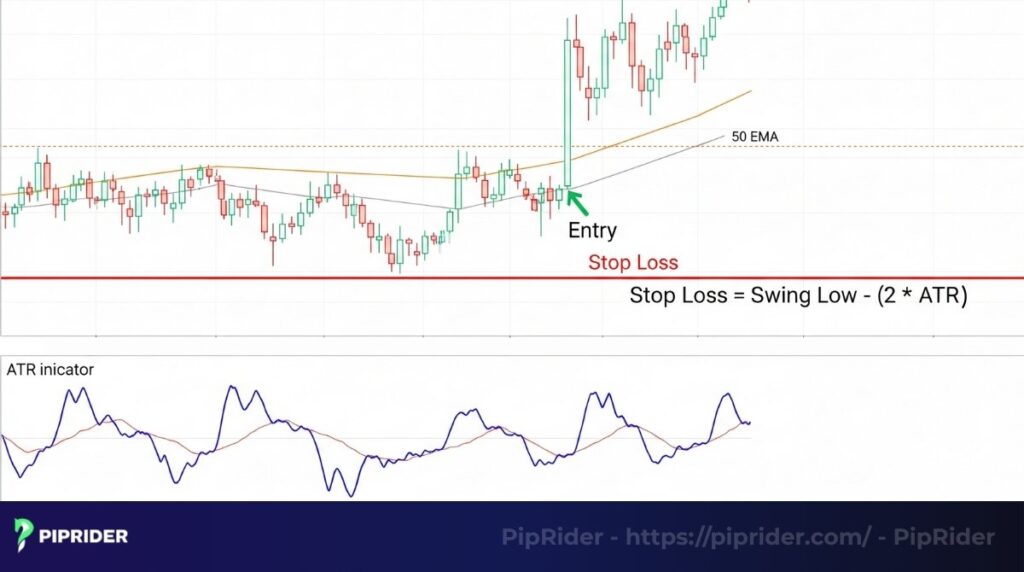
- The game plan: Use a 50-period Exponential Moving Average (EMA) to establish the dominant trend. When the price is above the 50 EMA, you only look for buys. When price pulls back to the EMA, you can enter a trade and place your stop-loss at a 2x ATR distance below the swing low.
- Advantages of this combination:
- Keeps you on the right side of the market: The MA acts as a filter, preventing you from trading against the dominant trend.
- Improves risk management: The ATR-based stop-loss adapts to the trend’s volatility, giving strong trends more room to move and tightening stops during weaker periods.
6.2. Volatility filtering with RSI/MACD and ATR
This strategy uses the ATR as a final “gatekeeper” to decide whether a momentum signal from RSI or MACD is worth taking.
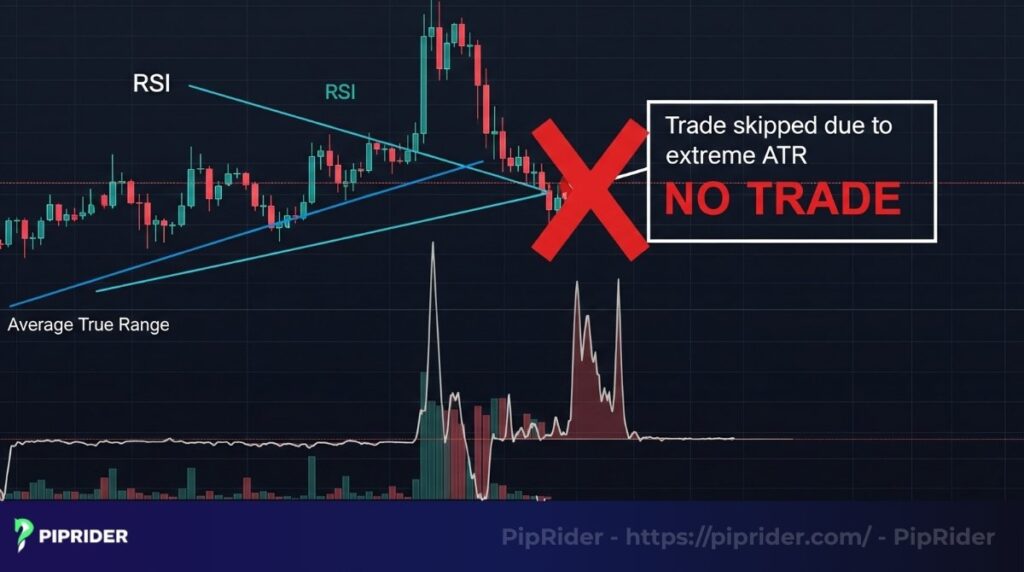
- The strategy: Use the RSI to spot an entry signal, like a bullish divergence. But before jumping into the trade, glance at the ATR. If the ATR is at an extreme, multi-month high, it signals dangerously chaotic volatility. You might skip the trade, even if the signal is good, to avoid being stopped out by irrational price swings.
- Advantages of this combination:
- Reduces “whipsaw” losses: It helps you avoid entering trades in markets that are too chaotic, where even good signals can fail due to random noise.
- Adds a layer of risk confirmation: It answers a critical question: “Is the potential reward from this momentum signal worth the current volatility risk?”
6.3. Breakout confirmation with Bollinger Bands and ATR
Pairing these two indicators creates a powerful strategy for pinpointing high-probability breakout trades.
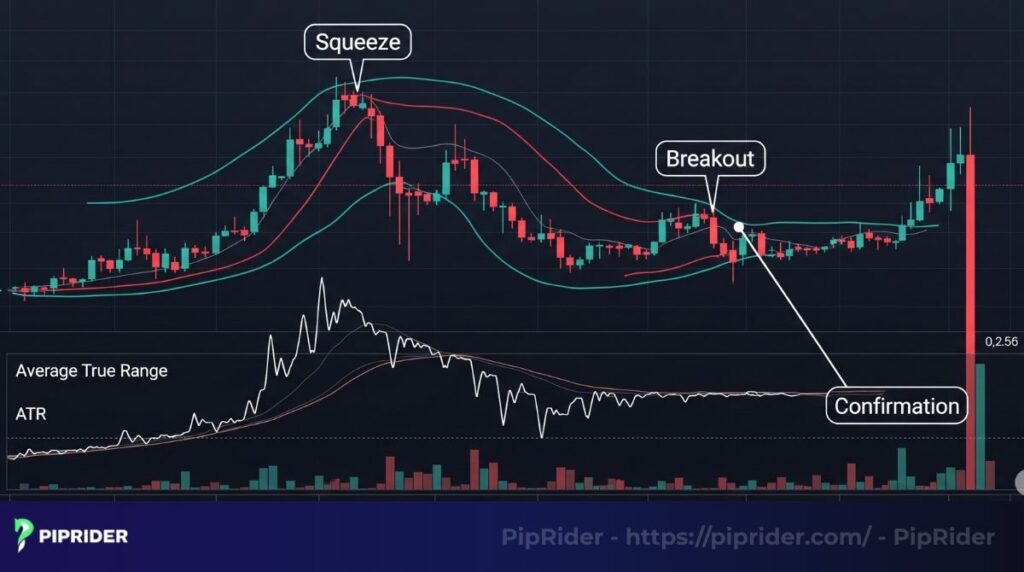
- The strategy:
- Identify the Squeeze: Wait for the Bollinger Bands to narrow significantly. At the same time, the ATR will be at a very low level. This is the market coiling up.
- Wait for the Breakout: Watch for a powerful price candle to close outside of the upper or lower band.
- Confirm with ATR: At the moment of the breakout, look for a sharp spike in the ATR value. This acts as confirmation that the breakout has genuine momentum and isn’t just a false signal.
- Advantages of this combination:
- High-probability setups: Combining a volatility contraction (Squeeze) with a volatility expansion (ATR spike) creates a very strong, dual-confirmation signal.
- Filters out false breakouts: Many breakouts fail. The ATR spike acts as a filter, confirming that there is enough power to sustain the move.
7. Benefits and limitations of the ATR indicator
No indicator is perfect. Understanding the pros and cons is essential for using it effectively.
7.1. Benefits of trading with the ATR
Here are the key advantages of incorporating the ATR indicator into your trading strategy:
- Objective measurement: It provides a clear, numerical value for volatility, removing guesswork.
- Universal application: It can be used in any market (forex, stocks, crypto) and on any time frame.
- Excellent for risk management: Its primary strength lies in helping you define risk through stop-loss placement and position sizing.
7.2. Limitations to consider
While powerful, the ATR indicator also has its drawbacks that traders should be aware of:
- It’s a lagging indicator: ATR tells you about past volatility, not what will happen in the future.
- It does not indicate trend direction: An increasing ATR can happen during a powerful rally just as easily as it can during a steep sell-off.
- Its value is relative: An ATR value of $2 is huge for a $20 stock, but tiny for a $1,000 stock. You must always consider the ATR in relation to the asset’s price.
8. How to set up ATR for Forex trading
Getting the Average True Range (ATR) indicator onto your Forex trading chart is a straightforward process on most platforms. ATR is a crucial tool for understanding market volatility, helping you make more informed decisions about stop-loss placement and position sizing, rather than predicting direction.
8.1. Setting up ATR on MetaTrader 4 (MT4) / MetaTrader 5 (MT5)
MetaTrader is a go-to platform for many Forex traders, and ATR comes built-in.
Step 1: Launch your platform: Open your MT4 or MT5 application on your computer.
Step 2: Choose your chart: Open the currency pair chart you want to analyze (e.g., EUR/USD, GBP/JPY). You can do this by clicking “File” > “New Chart” or simply dragging the pair from the “Market Watch” window.
Step 3: Add the ATR indicator:
- From the top menu bar, click “Insert.”
- Hover over “Indicators.”
- Select “Oscillators.”
- Click on “Average True Range.”
Step 4: Configure ATR settings: A settings window will pop up. Here’s what to look for:
- “Period”: This is the number of past candles used for the calculation. The standard, creator-recommended value is 14. You can stick with this or experiment (e.g., a shorter period like 7 for more responsiveness, or 20 for a smoother line) based on your strategy.
- “Style”: Customize the color and thickness of the ATR line.
- “Levels”: Generally not used for ATR, but you can add fixed levels if you have a specific strategy.
- Click “OK” to apply ATR to your chart.
You’ll see ATR appear in a separate panel below your main price chart.
8.2. Setting up ATR on TradingView
TradingView is a highly popular web-based charting platform known for its intuitive interface.
Step 1: Open your chart: Go to TradingView in your web browser and open the Forex chart you wish to analyze.
Step 2: Access indicators: On the top toolbar of your chart, find and click the “Indicators” icon (or simply press the / key on your keyboard).
Step 3: Search for ATR: In the search box that appears, type “Average True Range” or “ATR.”
Step 4: Add to chart: The indicator will appear in the list. Click on it.
Step 5: Adjust settings (Optional): ATR will immediately appear on your chart. To tweak its settings, hover your mouse over “Average True Range (ATR)” (usually in the top-left corner or directly on the indicator itself), then click the “Settings” icon (a gear symbol).
- “Length”: Similar to “Period” in MetaTrader, 14 is the default and a great starting point.
- “Style”: Customize the line’s appearance.
- Click “OK” or close the settings window to save your changes.
ATR will then be displayed in its own panel beneath your main price chart.
8.3. Key personal insights for using ATR:
- Beyond direction: Remember, ATR isn’t about where the price is going; it’s about how much it’s moving. A high ATR means wild swings, while a low ATR indicates a quiet market.
- Your risk manager: I primarily use ATR as my personal risk management tool. It helps me place smart stop-losses that respect the market’s natural volatility, preventing me from getting “wicked out” prematurely. It’s also invaluable for adjusting position sizes, ensuring I don’t risk too much when volatility is high.
- Market context: I also use it to get a quick feel for market conditions. If the ATR is unusually high, I know I’m in for a potentially wild ride and might adjust my strategy accordingly.
- Confluence is king: Like any indicator, ATR shines brightest when used with other analysis. I always combine it with my price action analysis or trend indicators to build a complete trading picture. It’s a fantastic puzzle piece, but never the whole puzzle.
9. Common questions about the ATR answered (FAQs)
Let’s answer a few common questions that traders have.
10. Conclusion
The ability to manage risk is what truly separates profitable traders from the crowd, and the Average True Range is a foundational tool for that purpose. It doesn’t predict the future, but it gives you an objective measure of the market’s current state of volatility.
By using it to set smarter stop-losses and adjust your position sizes, you can navigate even the choppiest markets with more confidence. The next time you analyze a chart, remember to look at the ATR indicator; it will give you a much clearer picture of the risks and opportunities ahead.
If you’re looking for more top technical indicators and valuable knowledge, Piprider’s Best Technical Indicators category is where you need to be.
Infographic Section
-
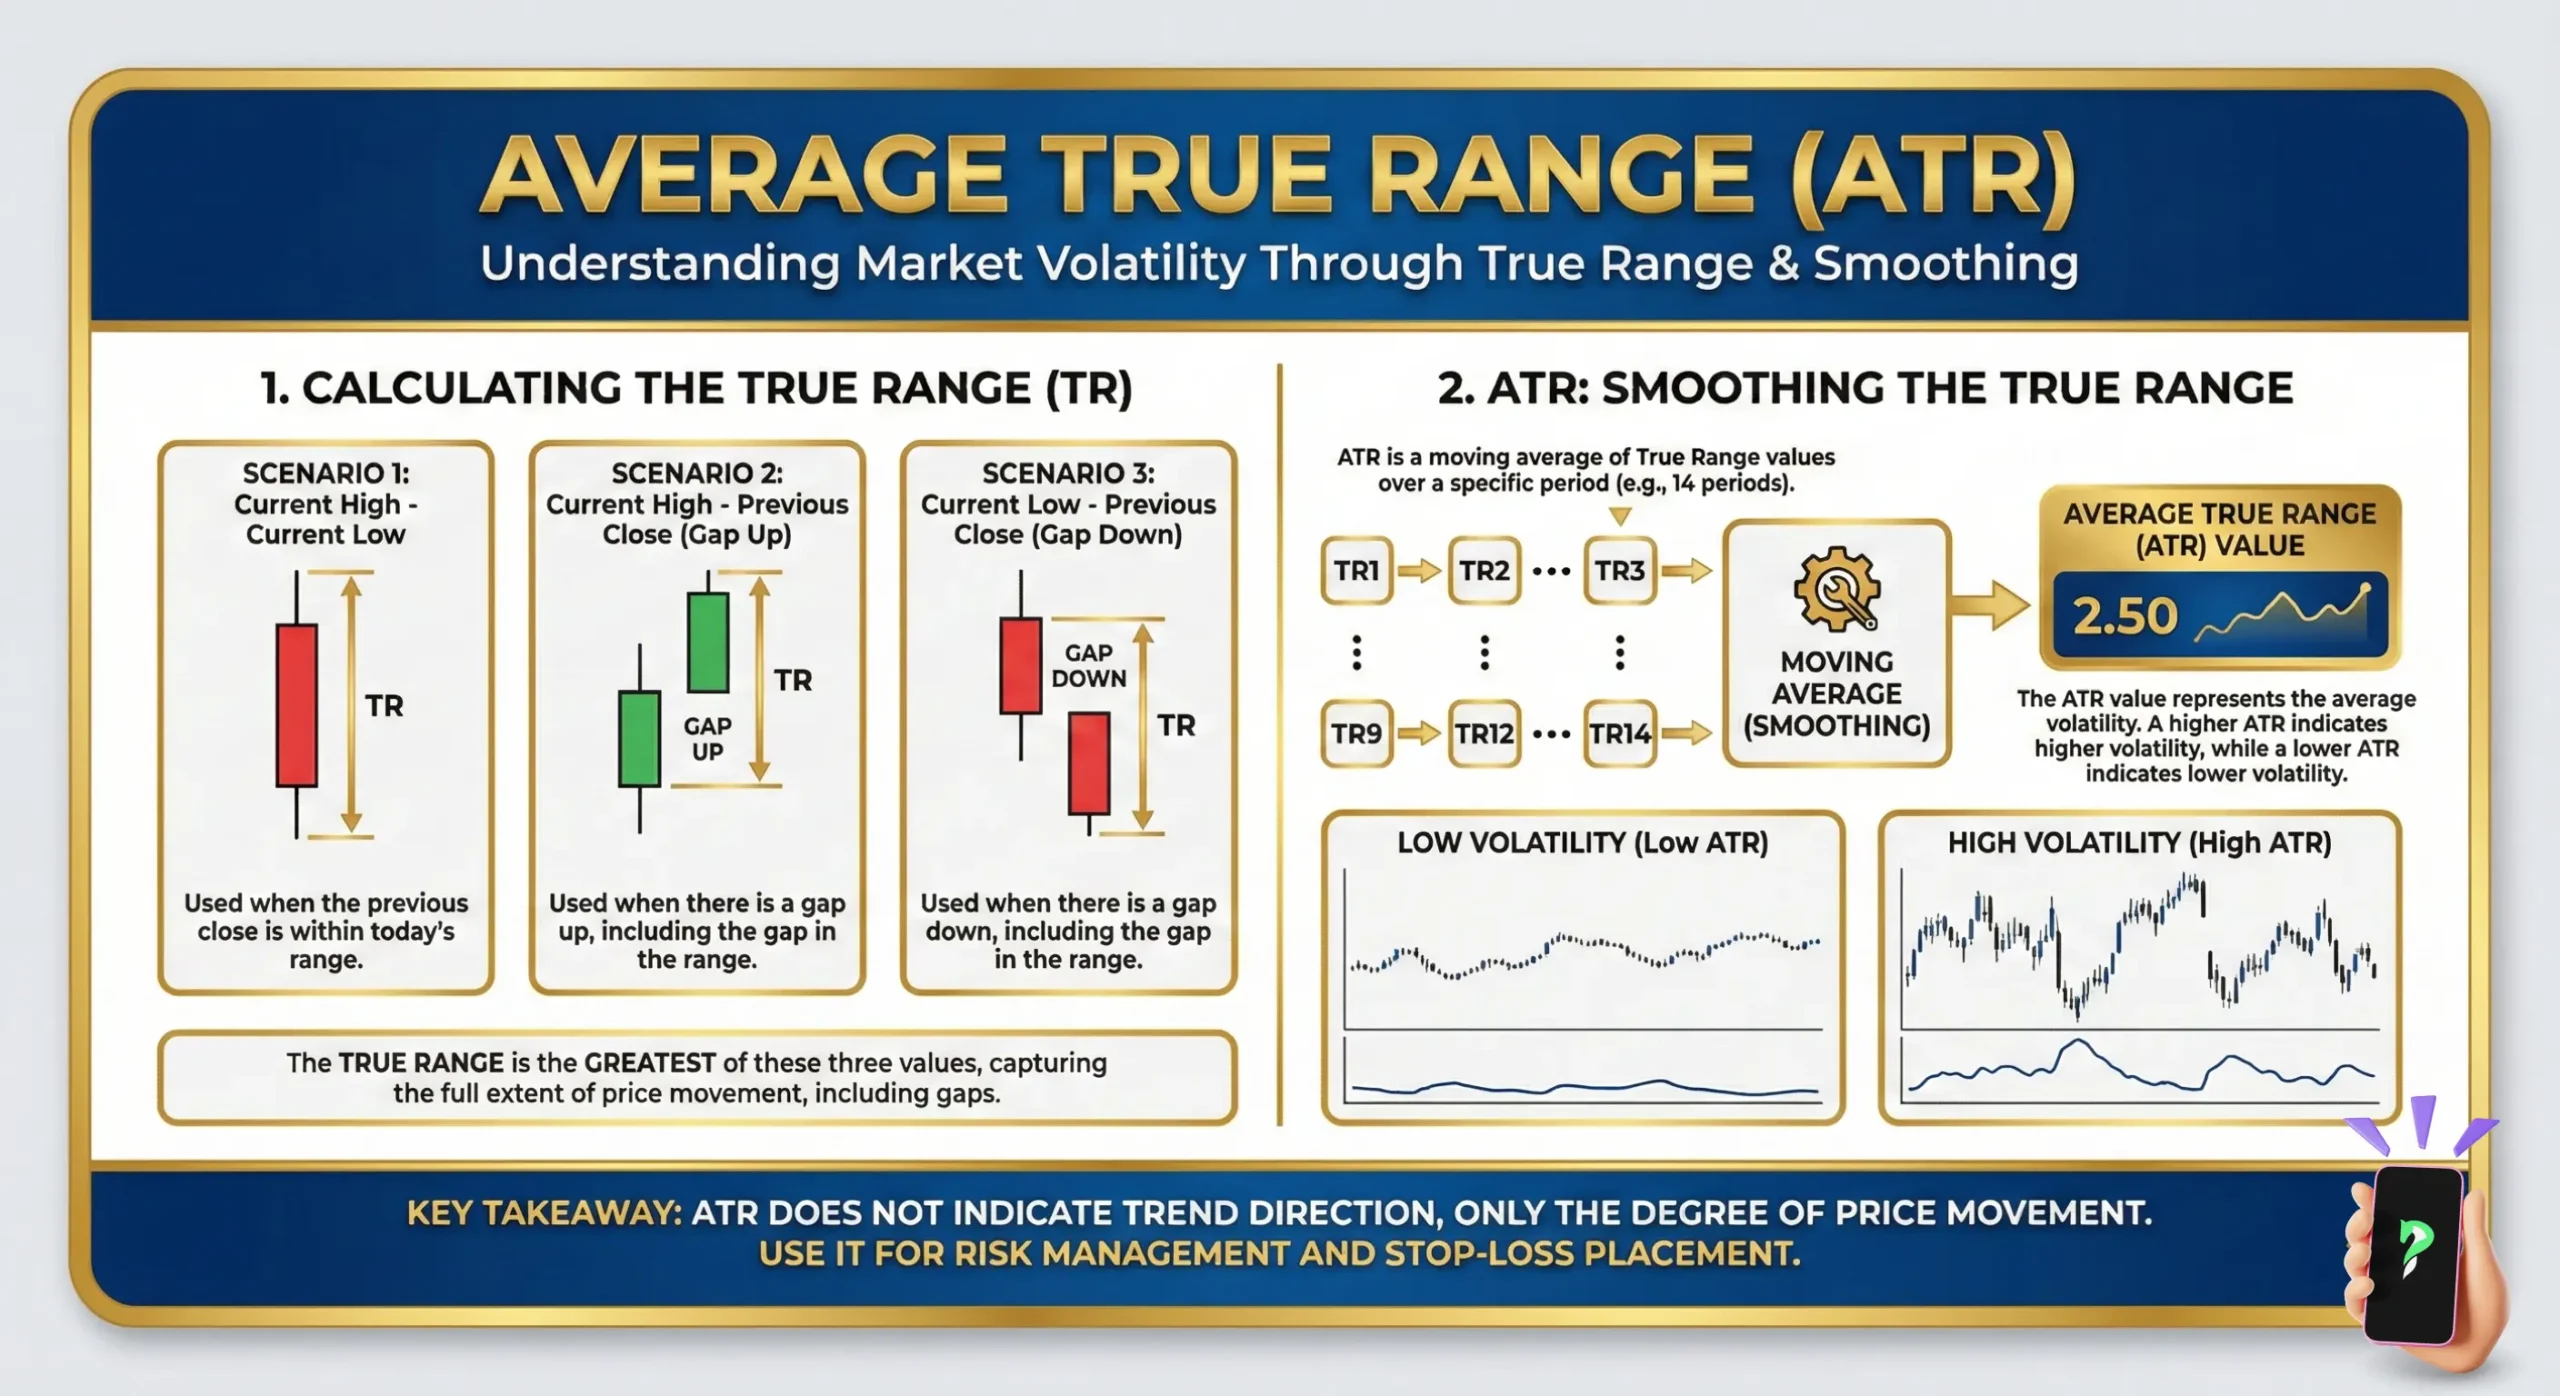
Average True Range (ATR) -
Average True Range (ATR): Step Application Guide -
Average True Range (ATR): Optimizing Timeframes


