
When you’re a day trader, you’re constantly trying to figure out the market’s daily rhythm. The average daily range ADR technical indicator is one of those simple, no-frills tools that can genuinely give you an edge. It’s less about complex signals and more about giving you a solid dose of reality for the trading day.
In this guide, I’ll walk you through everything I think you should know about the ADR. We’ll cover what it is, why it’s a staple in my own toolkit, and how you can use it to make smarter, more grounded decisions.
Key Takeaways
- The ADR tells you the average size of a daily price move, helping you understand an asset’s typical volatility, but it will never predict if the price will go up or down.
- Its greatest strength is helping you set logical stop-loss and take-profit levels, making it a powerful risk management tool for exits, not an entry signal generator.
- Choose your tool based on your trading style: use the ADR for day trading, and switch to the ATR to account for overnight price gaps if you hold positions longer.The ADR is a lagging indicator based on historical data, so be extra cautious on days with major news, as current volatility can far exceed the historical average.
- By showing you what a “normal” day’s range looks like, the ADR helps you manage your profit expectations and avoid chasing moves that are statistically unlikely.
1. What is the average daily range indicator?
The Average Daily Range (ADR) indicator measures how far an asset’s price typically moves from its peak to its trough on any given trading day. It calculates this by averaging the daily price movements over a specific period.
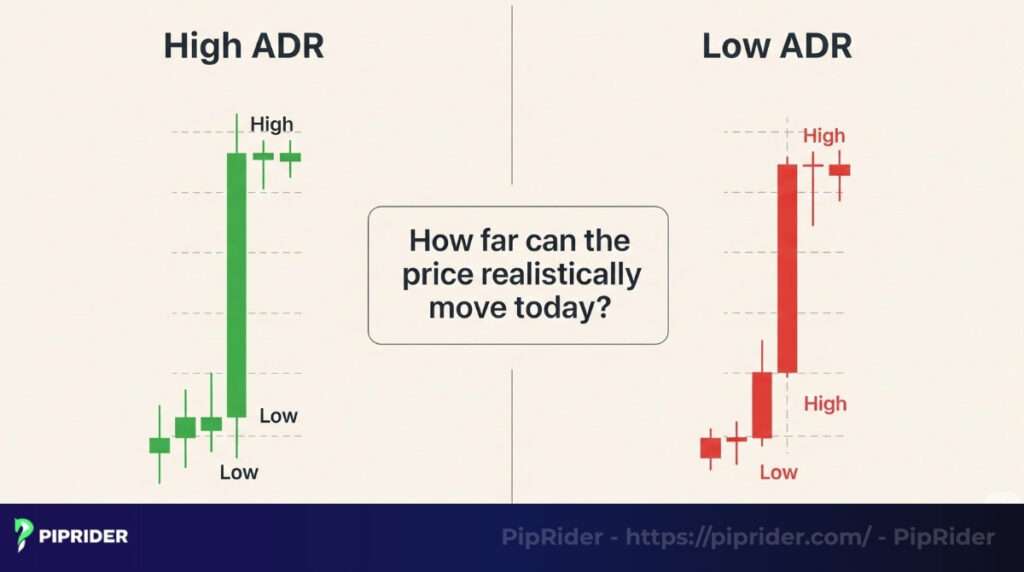
The primary purpose of the ADR is to help traders understand the potential daily volatility of a market. It answers the question, “How far can the price realistically move today?”
Important note:
- The ADR does not predict the direction of the market. A high ADR simply indicates that the market is experiencing significant volatility; it doesn’t tell you whether the price will go up or down.
- The ADR provides a practical guideline for price movement, which helps traders set more realistic profit targets and stop-loss levels.
An example to make it clear
Let’s say you’re looking at EUR/USD and your platform’s ADR(14) is showing 75 pips.
What this number tells me instantly is that chasing a 150-pip profit on an intraday trade is likely a fantasy unless some massive news breaks. It frames my expectations for the entire session.
2. The real value of the ADR indicator in day-to-day trading
Knowing an asset’s typical daily personality is the bedrock of good risk management. Here’s exactly why I won’t even consider a trade without glancing at the ADR first.
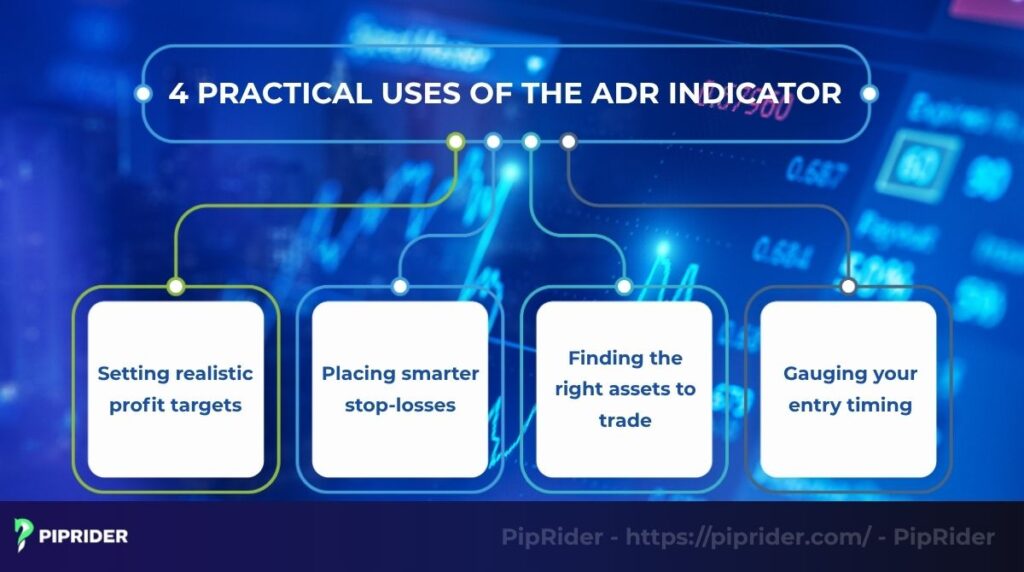
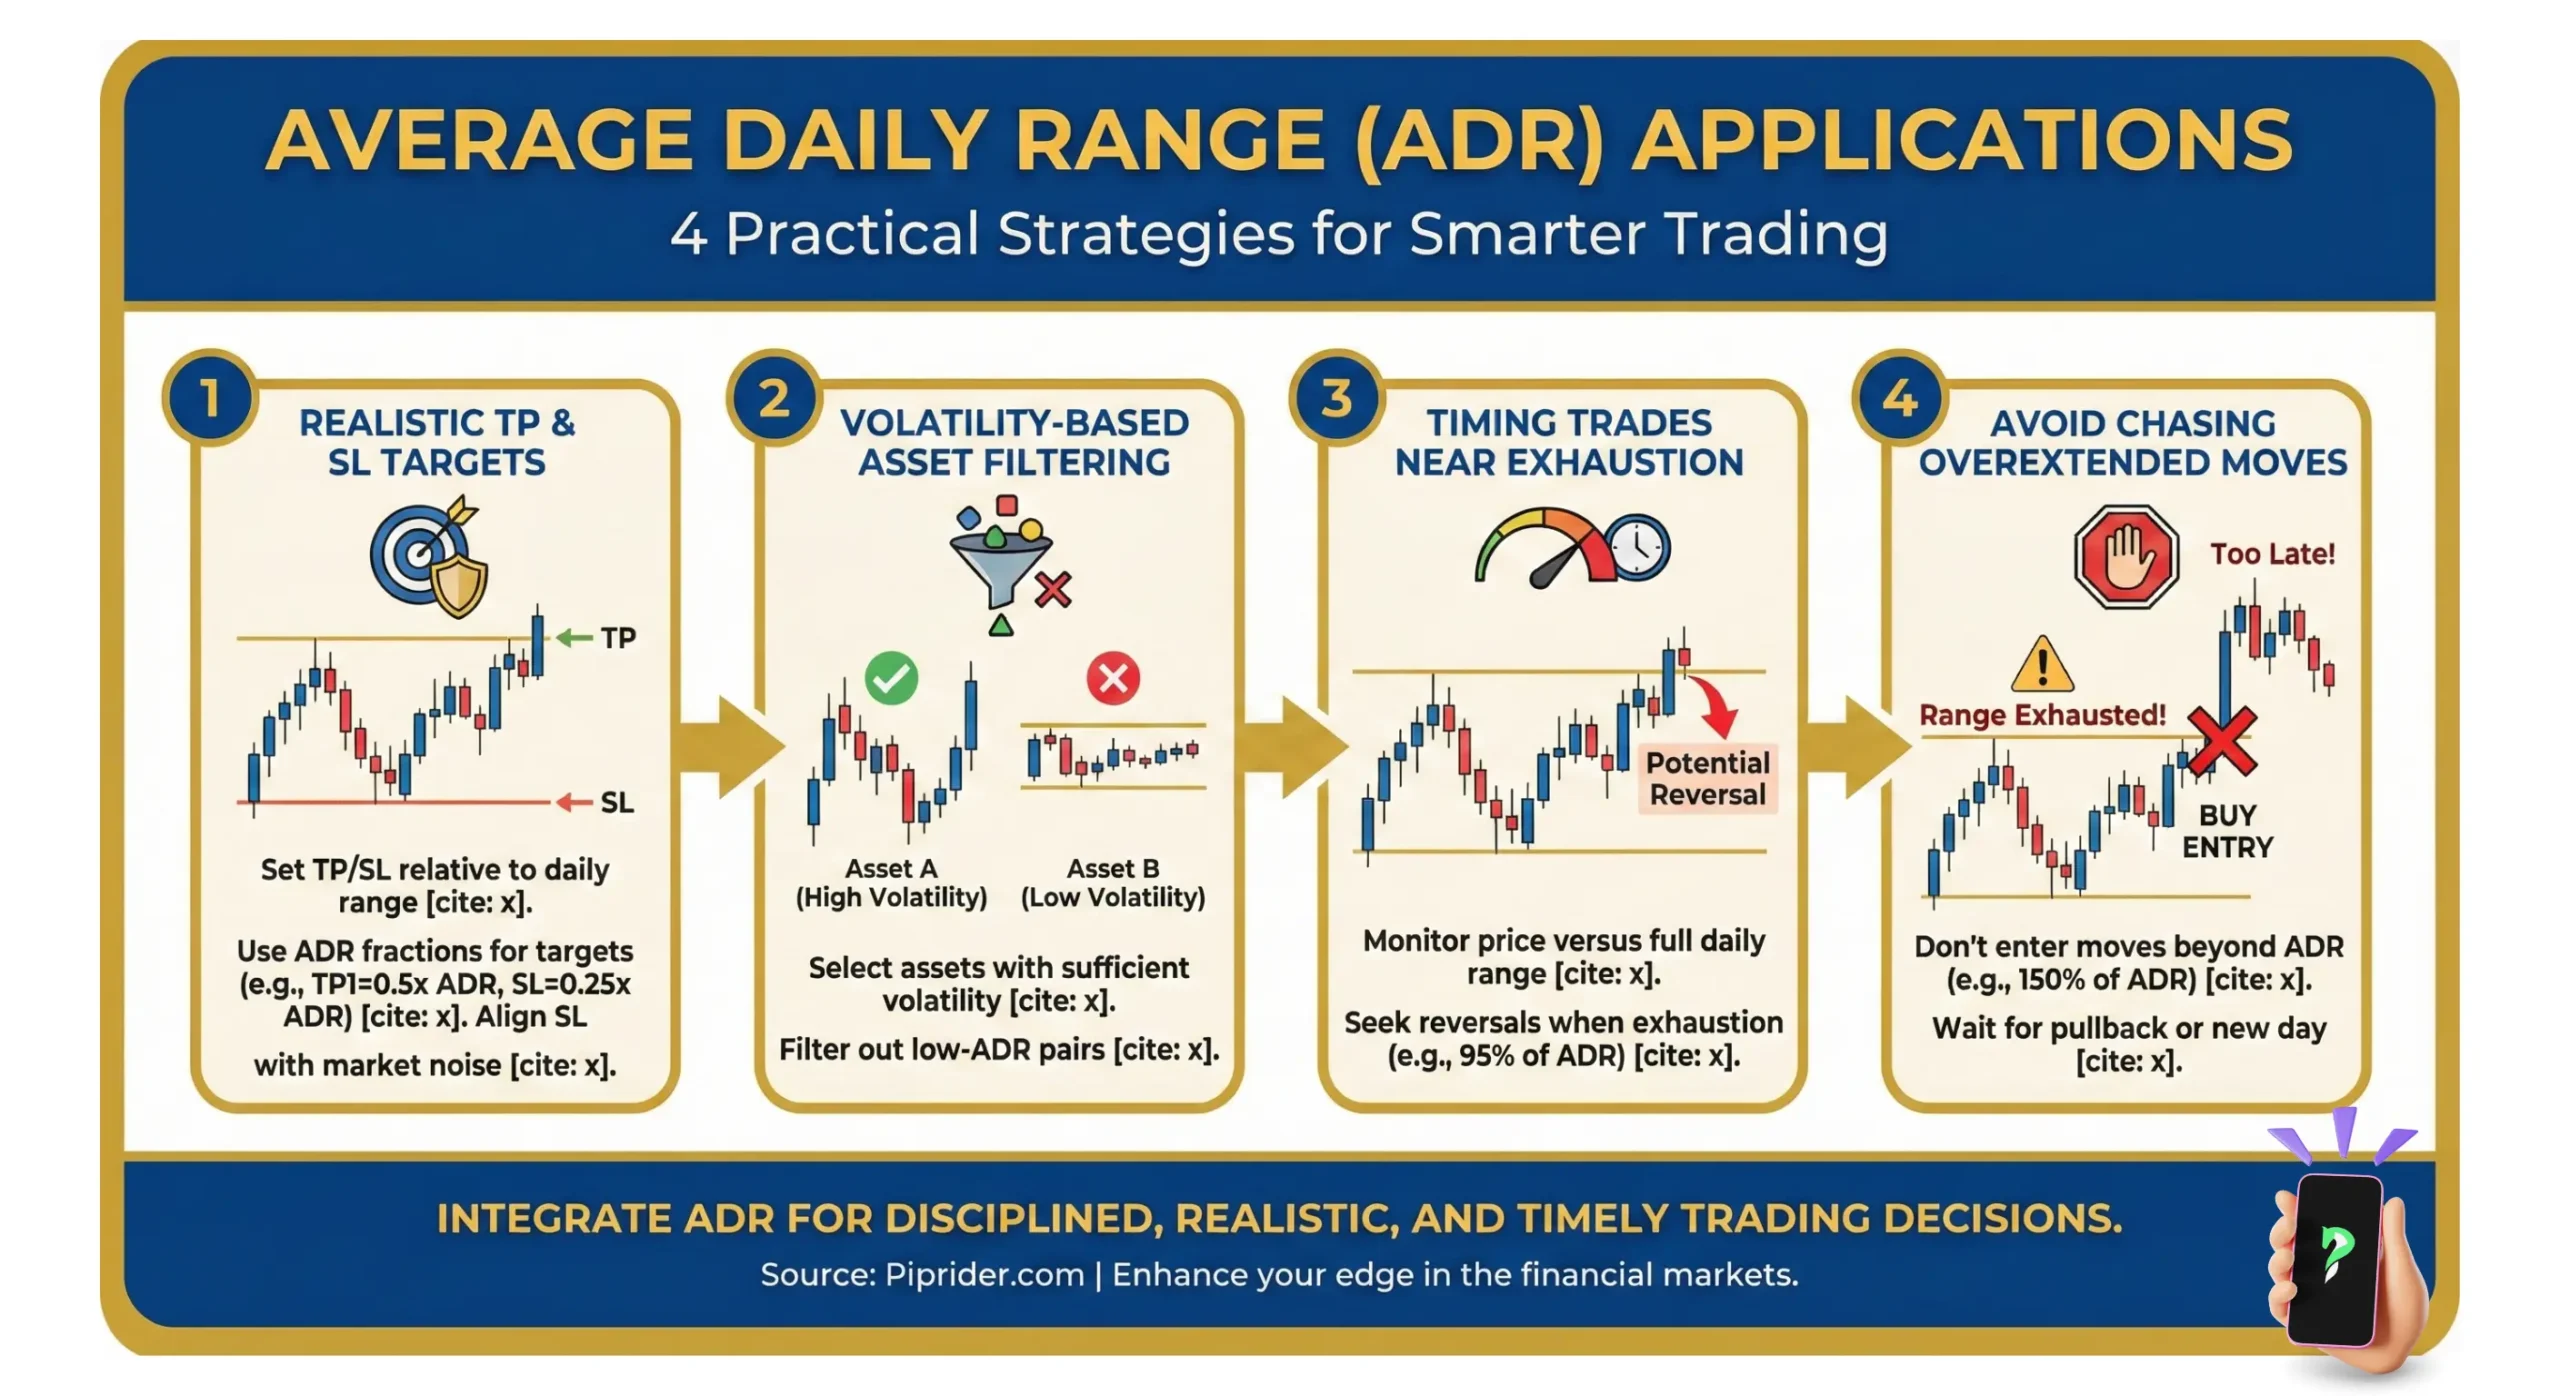
- Setting realistic profit targets: The ADR stops you from dreaming. If a stock moves 2 dollars a day on average, aiming for a 5-dollar profit in one day is just gambling. It keeps your goals tied to actual market behavior.
- Placing smarter stop-losses: There’s nothing worse than setting your stop, getting wicked out by a few ticks, and then watching the trade run perfectly in your favor. The ADR helps you place your stop outside this “market noise,” giving your trade a fair chance to work.
- Finding the right assets to trade: The ADR helps me filter for markets that fit my mood. If I’m looking for a quick, low-stress session, I’ll look for assets with a lower ADR. If I’m ready for some action and bigger moves, a higher ADR tells me where to look.
- Gauging your entry timing: This is a subtle but important one. If an asset’s range for the day is already near its average, entering a new trade late in the game is a low-probability move. It’s a good way to avoid chasing a move that’s already exhausted.
3. How to accurately calculate the average daily range ADR technical indicator
Most platforms do the math for you, but I believe in knowing how your tools work. Thankfully, the math behind the average daily range adr technical indicator isn’t complicated at all.
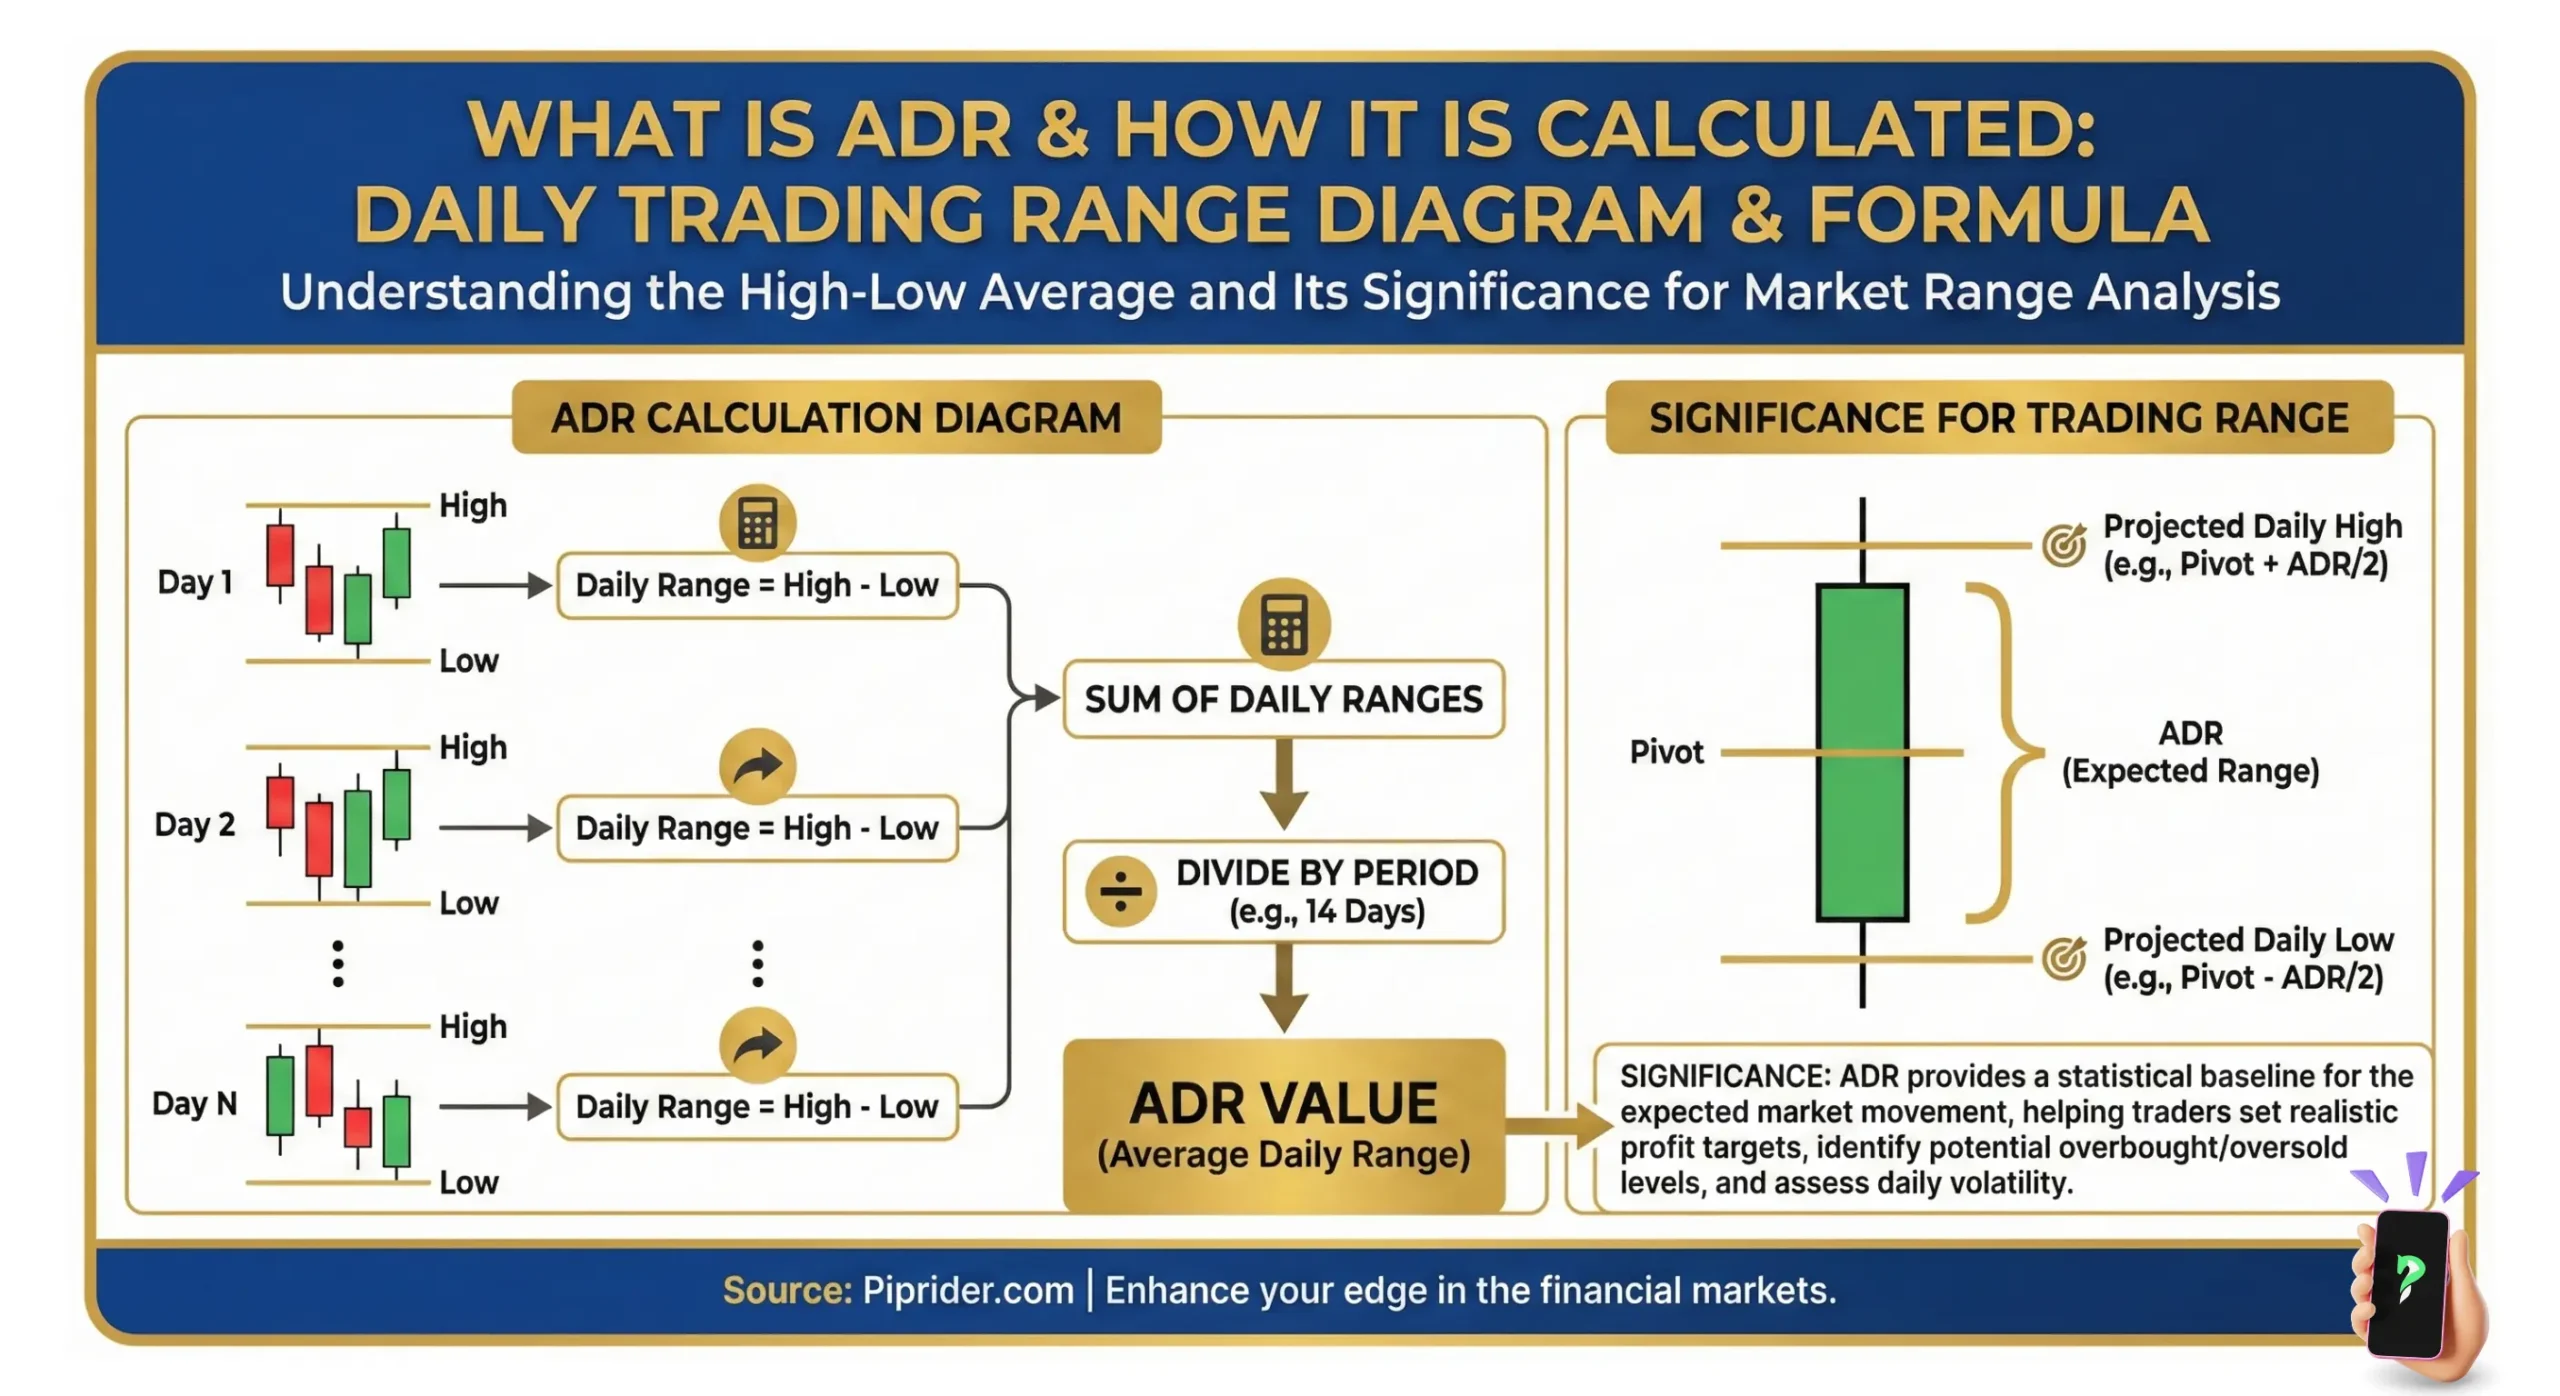
It’s just a two-step process:
Step 1: Find the range for each day: For each of the last ‘X’ days, you just calculate: Daily Range = Session High – Session Low.
Step 2: Average them out: Add up all those daily ranges and divide by the number of days you used. While you can adjust the settings, the 14-day period has become something of an industry standard, and it’s the one I personally rely on for a balanced view.
4. How to use the average daily range effectively in trading
Knowing the theory is fine, but making it useful is what matters. For me, the ADR is all about defining my exits, both my wins and my losses.
Here’s how to apply it in a practical way.
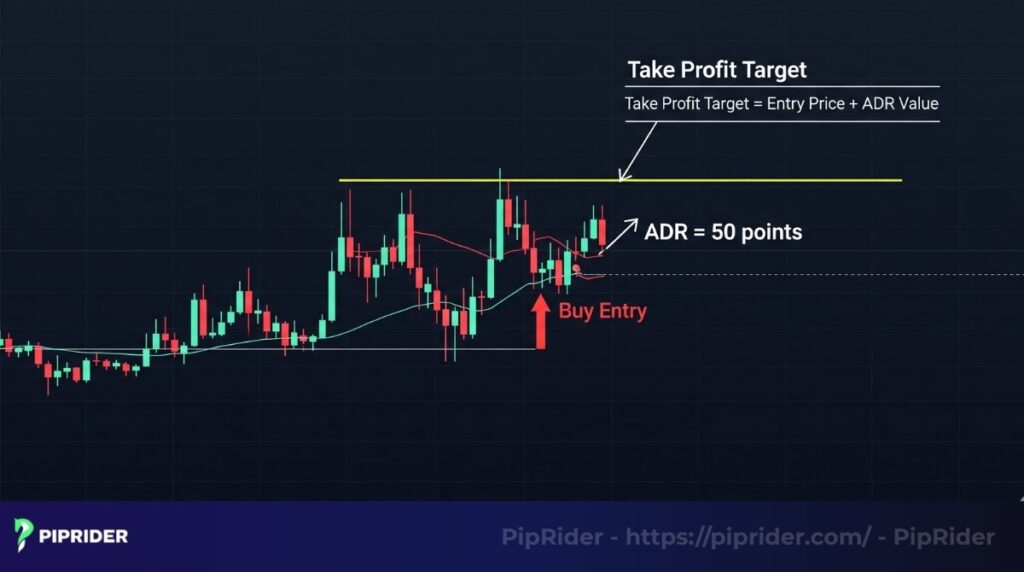
4.1. Setting practical take profit targets with the ADR
The projected ADR levels for the day often act like price magnets.
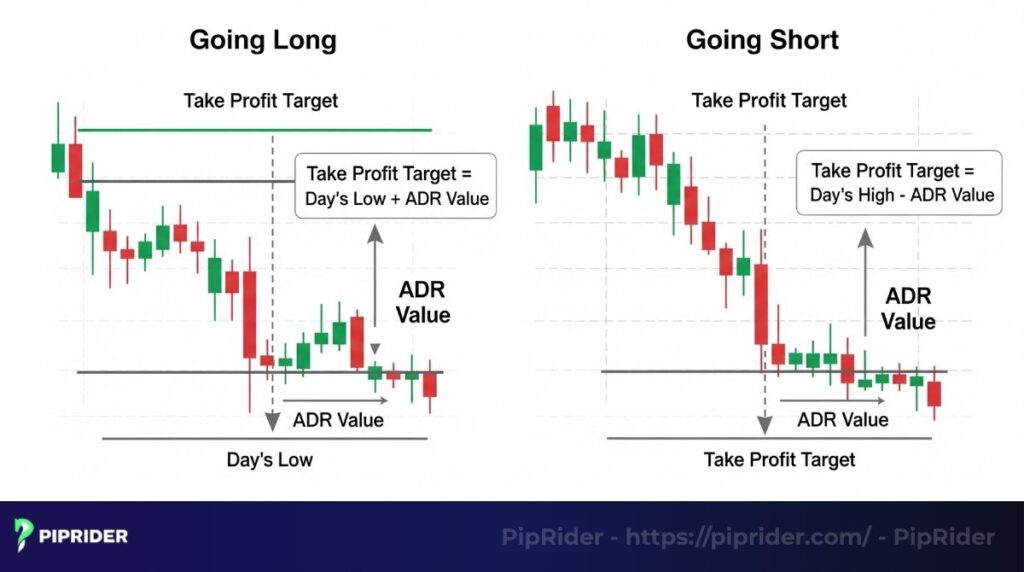
- Going long (buying): Add the ADR value to the day’s low to get a rough idea of where the daily high might form. That’s your target zone.
- Going short (selling): Subtract the ADR value from the day’s high to estimate the potential low. That’s where you should be thinking about taking profit.
Personal Take: I learned this the hard way a few years back on a Gold trade. The ADR was about $25, and I set my take-profit exactly at that limit. The price got within a few cents, reversed, and I ended up taking a small loss. I missed out on a huge win by being too greedy. Since that day, I always aim for 80-90% of the range. A good profit in hand is always better than the ‘perfect’ profit you miss.
4.2. Using ADR to place a Stop Loss
Likewise, the ADR provides a data-driven framework for placing your stop-loss. Instead of picking a random number, you’re using the market’s own volatility against itself. Many traders will set their stop at a fraction of the ADR, like 25% or 50%, away from their entry price. It’s a simple switch from emotional stop placement to a data-driven one.
5. Strategies for using the ADR indicator in Forex trading
In Forex trading, understanding a currency pair’s Average Daily Range (ADR) is incredibly important. The ADR provides a realistic view of typical daily volatility, helping us make more informed trading decisions. Here are some strategies I commonly apply when using the ADR in Forex.
5.1. Setting Smart Profit Targets and Stop-Losses
This is the core and most effective application of ADR in Forex. Let’s say you’re trading EUR/USD, and its ADR(14) is 80 pips.
- For long trades (Buying): If you’re entering a buy trade, add the ADR value to the daily low to estimate a potential profit target. For example, if the daily low is 1.0700 and the ADR is 80 pips, your target might be around 1.0780. However, from my own experience, don’t try to “eat” the full 100% of the ADR. Aim for about 80-90% of the ADR (e.g., 64-72 pips in this example) to increase your chances of hitting the target and avoid missing out when the price reverses.
- For short trades (Selling): Similarly, if you’re entering a sell trade, subtract the ADR value from the daily high to estimate the potential profit target. If the daily high is 1.0850 and the ADR is 80 pips, your target might be around 1.0770. Again, adjust your target to 80-90% of the ADR for safety.
For stop-losses, the ADR also helps you avoid placing stops too close to the market’s normal fluctuations. Instead of picking a random number, you can set your stop based on a certain percentage of the ADR (e.g., 25% or 50% of the ADR) from your entry price. This gives your stop-loss enough “breathing room” and prevents it from being prematurely hit by minor intraday noise.
5.2. Gauging intraday trend continuation
When a currency pair’s price has already moved a significant distance for the day, the ADR can tell you if there’s still room for that trend to continue.
- If the current Intraday Range (IR) has already reached or exceeded 80-90% of the ADR value, this is a warning sign. It’s highly likely that the price movement has “run out of steam” and might be about to consolidate or reverse. This isn’t an ideal time to enter a trend-following trade; instead, it might be time to consider taking profits or looking for reversal signals.
- Conversely, if the IR is still low compared to the ADR, it means the currency pair still has “space” to move in the current trend, allowing you to enter trend-following trades with more confidence.
5.3. Combining with other indicators
The ADR is an excellent tool for risk management and expectation setting, but it’s not a standalone trading signal. To enhance its effectiveness, I always combine the ADR with other trend or momentum indicators:
ADR + Moving Averages (MA/EMA): If the price is above the 20 EMA (indicating an uptrend) and you’re looking for a buy entry, the ADR helps you identify a reasonable profit target. The opposite applies to a downtrend.
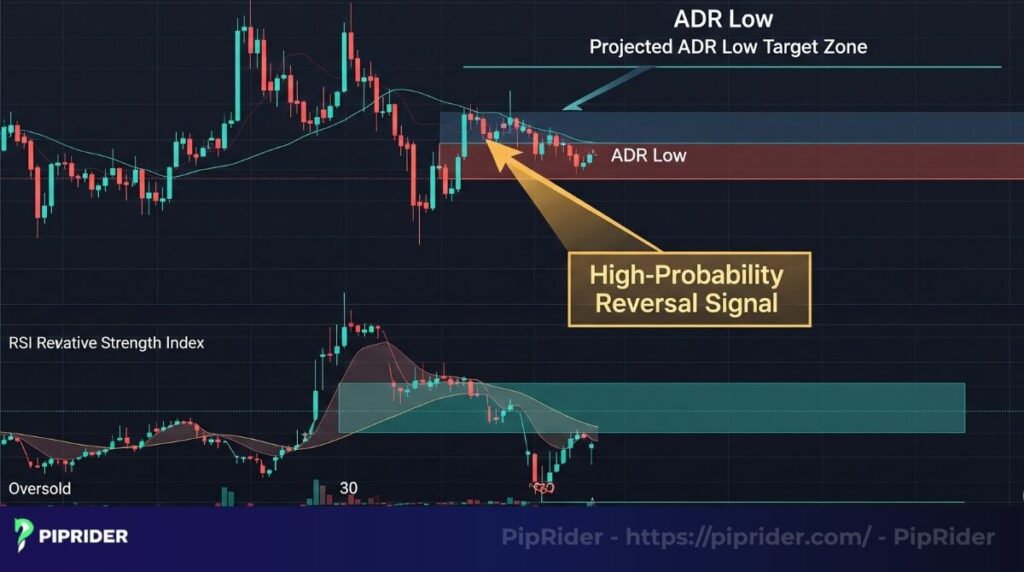
ADR + RSI (Relative Strength Index): When the price reaches the ADR target zone (meaning it has moved a significant distance) and the RSI simultaneously signals “overbought” (above 70) or “oversold” (below 30), this is a powerful combination indicating a high probability of reversal. This helps you make profit-taking or even counter-trend entry decisions with more confidence.
In summary, in Forex trading, the ADR helps you understand the actual “health” and “movement capability” of a currency pair within the day. By integrating it into your analysis and risk management process, you’ll make more data-driven trading decisions, minimize risk, and optimize your profits.
6. ADR vs. ATR vs. IR: Which indicator is right for you?
It’s common for traders to get the ADR, ATR, and IR confused, as they all relate to volatility. Using the right tool for the job is critical.
Let’s clear this up.
6.1. Defining the key differences
The main distinction is about what’s being measured and if it’s an average.
- ADR and ATR are averages calculated over a past period (like 14 days). They tell you what’s “typical.”
- IR (Intraday Range) is simply the High – Low of the current session only. It’s a real-time number, not an average. It provides a snapshot of volatility at this very moment.
- The fundamental distinction that every trader needs to grasp is how each indicator treats price gaps: the ATR factors them into its calculation, whereas the ADR completely disregards them.
6.2. Comparison table: ADR vs. ATR vs. IR
For a quick visual summary, the table below breaks down the key characteristics of each indicator.
| Feature | Average Daily Range (ADR) | Average True Range (ATR) | Intraday Range (IR) |
| Primary Focus | The typical range for a full day | An asset’s complete volatility, gaps included | The range of the current bar/day so far |
| Is it an Average? | Yes, over a set period (e.g., 14 days) | Yes, over a set period (e.g., 14 days) | No, it’s a real-time, single-period value |
| Considers Gaps? | No | Yes | No |
| Value Unit | Price points ($, pips, etc.) | Price points ($, pips, etc.) | Price points ($, pips, etc.) |
| Best For | Best for setting intraday profit/loss levels | Swing Traders (overnight risk) | Scalpers (real-time volatility check) |
6.3. Conclusion: When should you use ADR, ATR or IR?
Here’s my rule of thumb, and it’s all about my intention for the trade.
- If I’m day trading and know I’ll be flat by the end of the day, the ADR is my go-to. I only care about today’s session.
- If I’m swing trading and plan to hold overnight or through a weekend, I always use the ATR. It respects the risk of overnight gaps, which can be brutal.
- I’m always glancing at the IR to see how today’s action stacks up against the average (the ADR). If the IR is already at 90% of the ADR, I know the move is probably almost done.
7. The strengths and weaknesses of the ADR indicator
It’s not a silver bullet. To use the average daily range adr technical indicator well, you have to respect what it can and can’t do.
Here’s my honest take on its good and bad sides.
7.1. The advantages
When you get the hang of it, the ADR brings some real advantages to the table.
- Simplicity: It’s intuitive. You can understand what it’s telling you in a second, which is exactly what you need when the market is moving fast.
- Practical for Day Trading: It directly answers the day trader’s question: “How much more juice could this move have?”
- Improves Risk Management: It gives you a logical reason for where you place your stop and your target, taking a lot of the emotional guesswork out of the equation.
7.2. The disadvantages
But it’s not a perfect tool. Properly using it means being fully aware of its limitations.
- You have to remember that the ADR is, by its very nature, a lagging indicator.
- Essentially, using the ADR is like trying to drive forward while only looking in the rearview mirror; it tells you where you’ve been, not necessarily where you’re going.
- You’ll never get a clue from the ADR about whether the market’s underlying trend is up or down.
8. Answering common questions about the ADR indicator
Here are a few questions I get asked all the time by other traders.
9. Conclusion: Final thoughts and advice
The ADR is a tool that brings a dose of reality to your trading. It helps you stop guessing and start making data-driven decisions about your exits, which in turn helps manage both risk and expectations.
So here’s my final piece of advice: stop ignoring daily volatility. Make checking the ADR a non-negotiable part of your pre-trade routine. By mastering this simple average daily range ADR technical indicator, you’re not adding a complex signal; you’re adding professional-level context. Go try it on a demo account until it becomes second nature.
Follow Piprider for a deeper dive and visit Best Technical Indicators category to explore more valuable insights.
Infographic Section
-
What is ADR & How it is calculated -
Average Daily Range (ADR): Applications -

ADR vs. ATR vs. IR


