Have you ever watched a strong trend reverse just moments after you jumped in? Or missed a major move because you couldn’t gauge the conviction behind it? These are common frustrations for traders, but what if you had a tool designed to look past the price noise and measure the market’s true, underlying momentum?
Enter the Awesome Oscillator (AO). A creation of the famed trader and market psychologist Bill Williams, this tool was engineered to uncover the underlying market dynamics that a basic price chart often conceals. In this guide, we will break down exactly how the AO works and show you three practical strategies to make it a core part of your trading toolkit.
Key Takeaways
- The Awesome Oscillator quantifies the driving force of a trend by contrasting a 5-period (fast) moving average with a 34-period (slow) one.
- Histogram bars appearing above this line suggest bullish strength, while those below indicate bearish control over the market.
- Traders use three core strategies to find opportunities: the Zero-Line Crossover, Twin Peaks, and Saucer patterns.
- The AO is highly effective at spotting divergences, where the indicator’s movement disagrees with the price, often signaling a potential trend reversal.
- The AO is most reliable in trending markets and should always be used with other analysis methods, like price action or support/resistance, for confirmation.
1. What is the Awesome Oscillator?
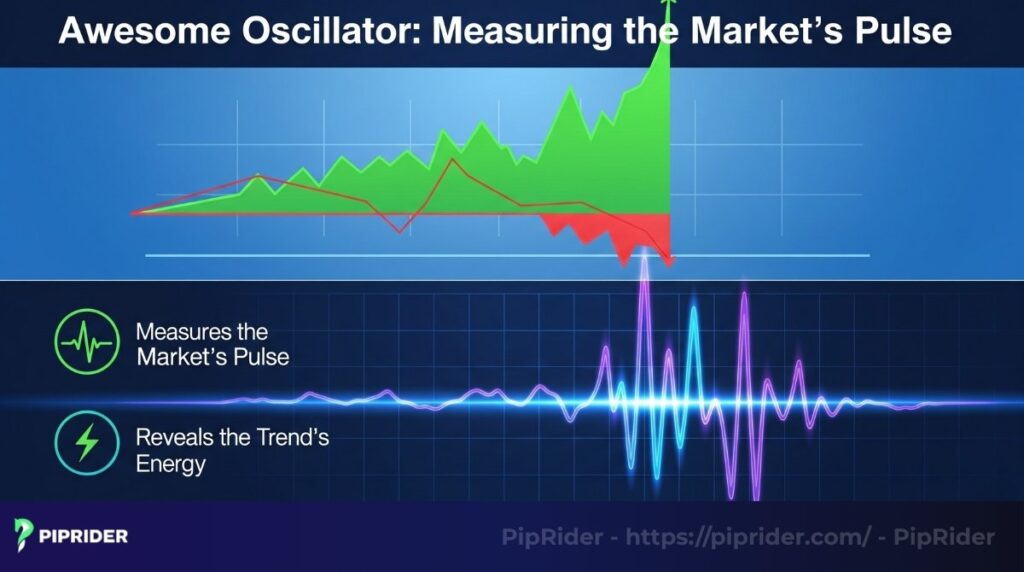
At its core, the Awesome Oscillator (AO) functions as a momentum indicator, specifically engineered to gauge the underlying “pulse” of market activity.
Unlike other oscillators that measure price against a fixed range, the AO measures the difference between two different timeframes of market momentum. This helps traders determine the strength or weakness of the current trend.
Its creator was Bill Williams, a pioneer in market psychology, technical analysis, and chaos theory. Williams believed that financial markets are inherently chaotic and that traders’ decisions are driven by their underlying beliefs. He developed indicators like the AO to help traders understand this market structure and make more informed decisions.
From my personal experience, what makes the AO particularly powerful is its ability to focus on the market’s activity momentum itself, rather than just price. This often allows it to reveal shifts in the market’s “energy” before they become evident solely through price action.
It genuinely helps me assess whether a trend has authentic backing or if it’s starting to lose its drive.
2. Awesome Oscillator calculation
Understanding how the Awesome Oscillator is calculated is key to grasping its signals. It’s a straightforward, three-step process that reveals the relationship between short-term and long-term momentum.
Here is the breakdown of the formula:
Step 1: Calculate the Median PriceUnlike many other tools, the AO intentionally avoids using the closing price. Instead, it uses the median price to get a truer sense of a period’s value.
Median Price = (High + Low) / 2
Step 2: Calculate the Simple Moving Averages (SMA)Next, two SMAs are calculated using the median price.
- SMA over 5 periods: This moving average tracks the immediate, short-term market momentum.
- 34-period SMA: This represents the slower, longer-term trend.
Step 3: Calculate the AO ValueThe resulting AO reading is calculated as the simple difference between the slow and fast moving averages.
- AO = SMA(Median Price, 5) – SMA(Median Price, 34)
3. Components of the Awesome Oscillator
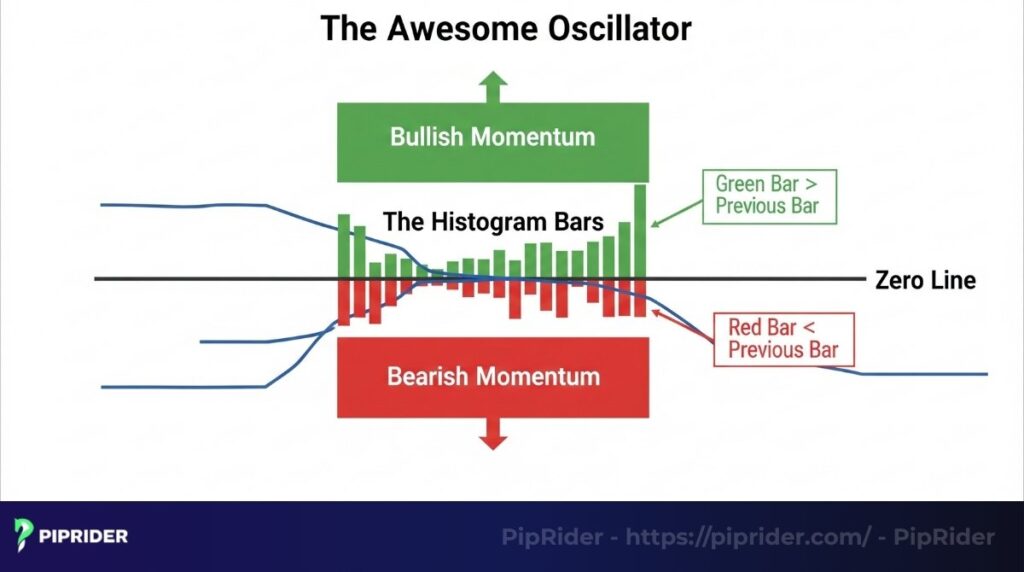
To effectively use the Awesome Oscillator (AO), you must first understand its two primary visual components: the histogram bars and the zero line. These elements work together to provide insights into market momentum and potential shifts.
3.1. The histogram bars
The visual representation of the AO is a histogram made of green and red bars. The shade of the bar reveals the momentum’s acceleration or deceleration relative to the prior bar, not its bullish or bearish direction.
- Green Bars: A bar turns green when its value is greater than the previous bar’s value.
- Red Bars: A bar turns red when its value is less than the previous bar’s value.
3.2. The zero line
The zero line acts as the histogram’s critical axis or equilibrium point.
- Readings Above Zero Line: Readings above this central axis indicate that the fast-moving momentum is currently stronger than the slower, long-term trend. This is interpreted as a sign of bullish momentum.
- Readings Below Zero Line: Conversely, bars plotting below the zero line signal that the long-term trend is currently overpowering the shorter-term momentum, which points to a bearish market state.
4. 3 buy/sell trading signals from the Awesome Oscillator
Let’s transition from theory to actionable methods. Below are three foundational trading signals that utilize the Awesome Oscillator.
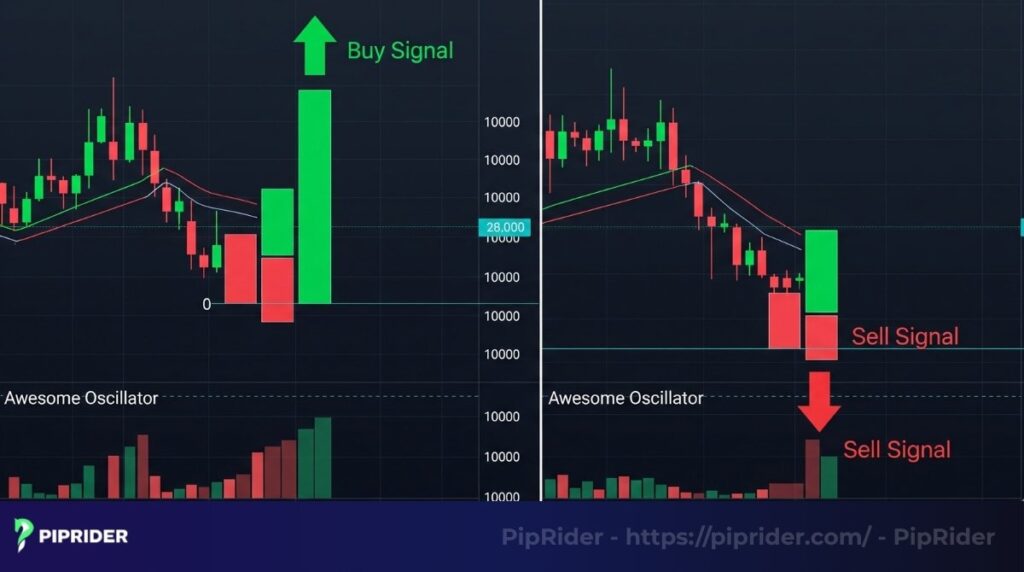
4.1. The zero-line crossover
From my own trading, the Zero-Line Crossover is often my first alert to a potential shift. While simple, I’ve found it’s best utilized when confirmed by volume or a strong price break, as standalone signals can sometimes be noisy.
- Bullish Crossover (Buy Signal): A purchase signal is generated when the histogram bars move from negative territory to positive territory, crossing above the zero line. This event signifies a potential power shift from sellers to buyers.
- Bearish Crossover (Sell Signal): A sell signal is generated as the histogram transitions from positive to negative territory. This shift implies that bullish energy is giving way to bearish pressure.
4.2. The twin peaks
I particularly value the Twin Peaks pattern for its early warning. It’s a high-probability setup for me, especially when the divergence is clear and I see signs of price action weakening at those peaks.
- Bearish Twin Peaks (Sell Signal): This setup materializes with two distinct peaks situated above the zero line. A sell signal is confirmed if the second peak fails to reach the height of the first and is succeeded by a red histogram bar. This suggests the upward drive is losing power.
- Bullish Twin Peaks (Buy Signal): This pattern forms with two troughs below the zero line. For a valid signal, the second trough must be shallower (positioned higher) than the first, followed by a green bar. This serves as a clue that the downward selling pressure is diminishing.
4.3. The saucer
For faster moves, the Saucer is invaluable. I often use it as a re-entry signal in established trends, as it captures those brief pauses before momentum kicks back in.
- Bullish Saucer (Buy Signal): This setup is identified by a sequence of two red histogram bars that are immediately succeeded by a green one.
- Bearish Saucer (Sell Signal): This is the inverse pattern and forms below the zero line. It comprises two back-to-back green bars followed by a red one, suggesting the downtrend is likely to resume.
5. Trading strategies with Awesome Oscillator indicators
Unlike many other oscillators, AO is not bound by predefined ranges, making it incredibly versatile for identifying shifts in market momentum. While seemingly simple, the AO offers powerful insights for various trading strategies when understood deeply.
5.1. Scalping with “Saucer” signals
For scalping, speed and clear entry/exit points are crucial. The AO’s “Saucer” signal provides just that, indicating a rapid change in momentum in the direction of the trend.
In my experience, scalping with the Saucer demands extreme discipline. You need to be quick on the trigger and even quicker to take profits, as these momentum bursts are fleeting.
A bullish “Saucer” signal (for buying) occurs when:
- The AO is above the zero line (confirming an uptrend).
- It forms three consecutive bars: the first is red, followed by two green bars.
- The second green bar is higher than the first.
A bearish “Saucer” signal (for selling) is the opposite:
- The AO is below the zero line (confirming a downtrend).
- It forms three consecutive bars: the first is green, followed by two red bars.
- The second red bar is lower than the first.
Execution for scalping: Enter quickly upon the close of the third bar. Target small, consistent profits, and use tight stop-losses just beyond the recent swing high/low or the “Saucer” formation’s extreme. This strategy thrives on short-term bursts of momentum.
5.2. Divergence: Anticipating trend reversals
Divergence is arguably the most powerful application of the Awesome Oscillator, signaling potential trend reversals before they happen. It occurs when price action and the AO move in opposite directions.
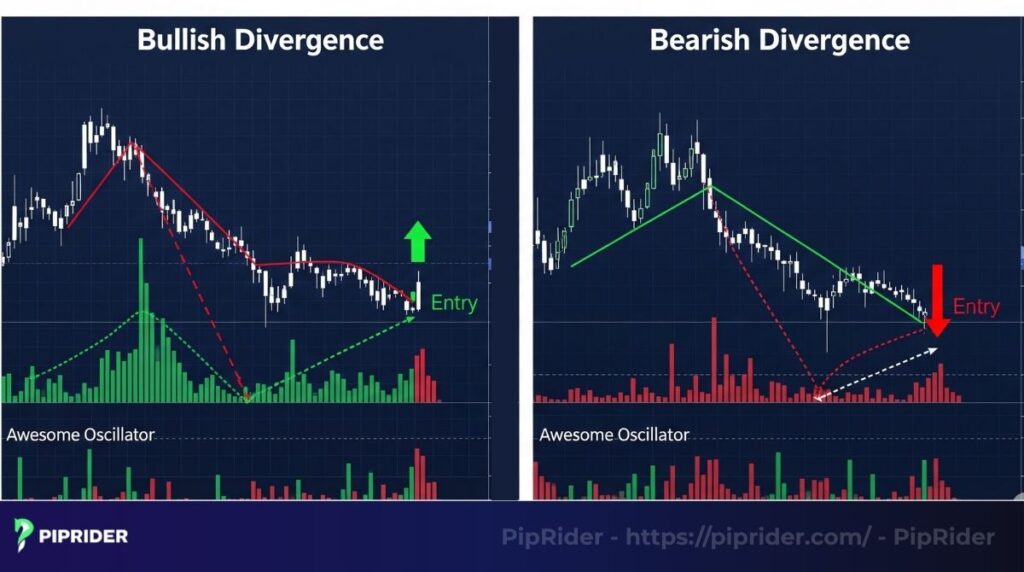
While divergence is powerful, I’ve learned the hard way not to rush into a trade. Waiting for that confirmation candle after a clear divergence saves me from many premature entries.
- Bullish divergence (buy signal): The price makes a lower low, but the Awesome Oscillator makes a higher low. This suggests that bearish momentum is weakening, even as the price dips, hinting at an upcoming upward reversal.
- Bearish divergence (sell signal): The price makes a higher high, but the Awesome Oscillator makes a lower high. This indicates that bullish momentum is fading, despite price climbing, foreshadowing a downward reversal.
Execution for divergence: Divergence signals are high-probability but can take time to play out. Wait for a confirmation candle (e.g., a bullish engulfing after bullish divergence, or a bearish engulfing after bearish divergence) before entering. Place stop-losses beyond the extreme of the divergent price swing.
5.3. Breakout confirmation with the zero line cross
I rely heavily on the zero line cross for breakout confirmation. It’s like the AO giving a green light, telling me the internal market forces are aligning with the price breakout.
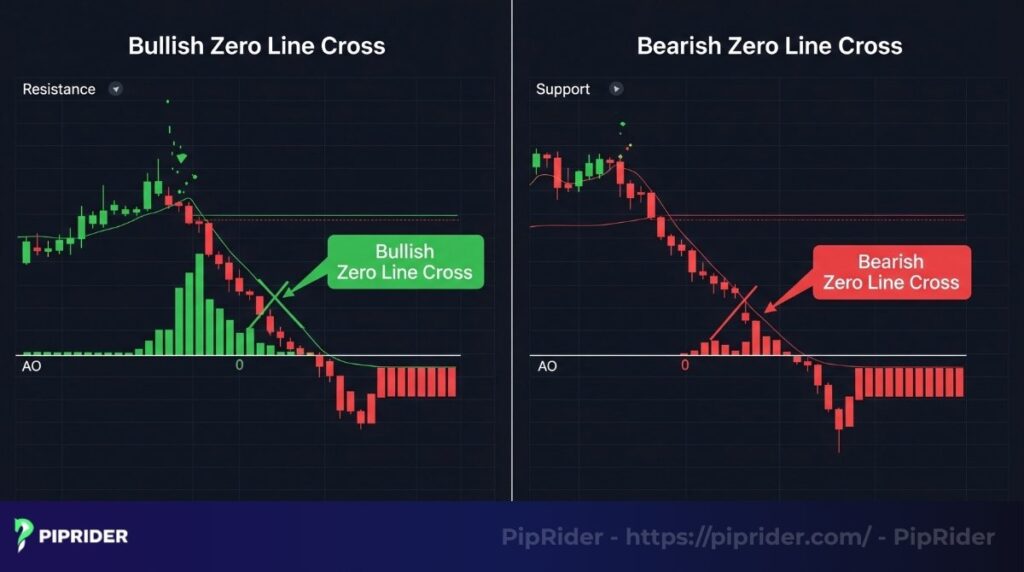
- Bullish zero line cross (buy signal): The Awesome Oscillator crosses above the zero line from below. This indicates that short-term buying momentum is now stronger than the longer-term selling momentum. It often confirms a bullish breakout or the start of an uptrend.
- Bearish zero line cross (sell Signal): The Awesome Oscillator crosses below the zero line from above. This suggests that short-term selling momentum has overcome longer-term buying momentum, often confirming a bearish breakout or the beginning of a downtrend.
Execution for breakout confirmation: Use this signal on its own for clear trend entries, or combine it with price action. For instance, if price breaks above a resistance level, wait for the AO to cross above zero for added confirmation. Set stop-losses beyond the breakout point or a recent swing.
5.4. Combining AO with other indicators for enhanced accuracy
While powerful, no single indicator is perfect. Combining the Awesome Oscillator with other tools provides confluence, significantly improving the reliability of your signals.
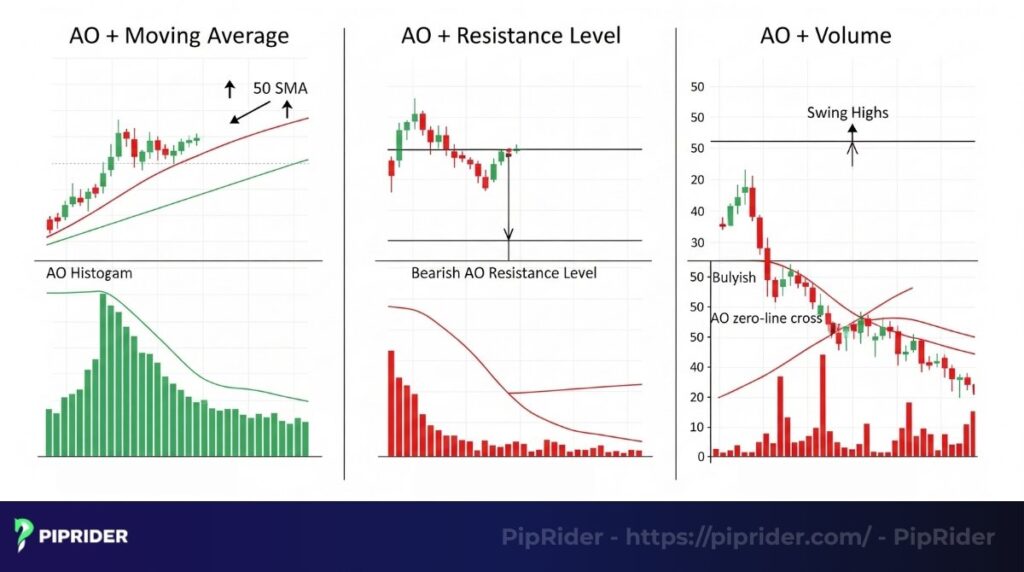
- AO + Moving Averages (MAs): Use a 50-period or 200-period Simple Moving Average (SMA) to identify the primary trend. Only take AO buy signals when the price is above the MA, and sell signals when the price is below the MA. For example, a bullish “Saucer” or Zero Line Cross is far more reliable when the price is trading above its 50 SMA.
- AO + Support/Resistance Levels: Look for AO signals (especially divergence) near key support or resistance zones. A bullish divergence appearing at a strong support level or a bearish divergence at resistance greatly increases the probability of a reversal. The AO can confirm whether these levels will hold or break.
- AO + Volume: For stock or crypto trading, combining AO signals with volume can provide extra conviction. A strong AO Zero Line Cross on high volume confirms conviction behind the momentum shift. Divergence accompanied by declining volume often reinforces the idea of momentum fading.
By understanding these unique applications and combining the Awesome Oscillator with other indicators, you can develop a robust trading strategy that leverages momentum shifts and anticipates market turning points with greater precision.
6. Compare Awesome Oscillator vs. Other momentum indicators
The Awesome Oscillator (AO) offers unique insights into market momentum. This table provides a quick comparison of AO against the Relative Strength Index (RSI), Accelerator Oscillator (AC), and MACD, highlighting their distinct features, key signals, and ideal use cases to help you choose the best tool for your trading strategy.
| Feature / Indicator | Awesome Oscillator (AO) | Relative Strength Index (RSI) | Accelerator Oscillator (AC) | MACD (Moving Average Convergence Divergence) |
| Nature | Momentum Indicator | Momentum Oscillator | Momentum of Momentum Indicator | Trend-Following and Momentum Indicator |
| Calculation basis | Compares 5-period Simple Moving Average (SMA) of midpoints to 34-period SMA of midpoints | Measures the speed and change of price movements (overbought/oversold levels) | Measures changes in momentum based on AO | Compares 12-period EMA to 26-period EMA; 9-period EMA of MACD line acts as signal line |
| Value range | Unlimited (around zero line) | 0 to 100 (with overbought/oversold zones at 70/30) | Unlimited (around zero line) | Unlimited (around zero line) |
| Key signals | – Zero Line Cross: Trend change – Saucer: Short-term trend reversal – Twin Peaks: Trend reversal – Divergence: Potential reversal | –Overbought/Oversold: Potential reversal – Divergence: Potential reversal – Centerline (50) Crossover: Trend confirmation | – Zero Line Cross: Momentum change – Color Change: Acceleration/deceleration of momentum | – Signal Line Crossover: Buy/Sell signals – Zero Line Crossover: Trend confirmation –Divergence: Potential reversal |
| Advantages | – Easy to recognize signals (chart patterns) – Highly effective with divergence – “Saucer” signals are good for scalping – Unlimited range clearly shows momentum strength | – Clear overbought/oversold signals – Very popular, easy to find divergence signals | – Slightly earlier signals than AO (momentum of momentum) – Provides insight into changes in buying/selling pressure | – Combines both trend and momentum – Signal line helps filter noise – Effective in identifying trends and major reversal points |
| Disadvantages | – Can generate false signals in sideways markets – Needs to be combined with price action or other indicators for filtering | – Can generate premature overbought/oversold signals in strong trends – Doesn’t clearly indicate trend direction like MACD | – Lagging can occur in highly volatile markets – Requires time to get accustomed to interpretation | – Has some lag due to being based on MAs – Can sometimes generate false signals in sideways markets – Histogram can be difficult for beginners to read |
| When to use | – Early identification of reversals (divergence) – Short-term momentum trading (Saucer) – Confirmation of trend changes (Zero Line Cross) | – When looking for overbought/oversold conditions for reversals – Identifying divergence to predict trend changes | – When seeking earlier momentum change signals (compared to AO) – Trading explosive momentum | – Identifying strong trends and major trend changes – Medium to long-term momentum trading |
In my opinion, there is no “better” indicator; they are simply different. The Awesome Oscillator stands out for its unique ability to highlight momentum shifts and potential reversals through clear visual signals like “Saucers” and divergences.
Mastering its nuances can significantly enhance your ability to anticipate market movements and refine your entry and exit strategies, making it a valuable addition to any trader’s toolkit.
7. Advantages and limitations of Awesome Oscillator
Like any technical tool, the Awesome Oscillator has benefits and drawbacks. Acknowledging them is vital for using it properly.
Advantages:
- Simplicity: With a clear histogram and zero line, the AO is easy to read and interpret, even for new traders.
- Unambiguous signals: Strategies like the zero-line crossover and twin peaks generate very distinct entry and exit points.
- Momentum clarity: The indicator excels at visualizing the force behind a trend, which helps traders assess its overall health.
- Divergence detection: The AO is very effective at spotting divergences, which can be early warnings of a trend reversal.
Limitations:
- Inherent lag: As it is constructed from moving averages, the AO is, by definition, a lagging indicator.
- Whipsaws in ranging markets: The indicator is less reliable in sideways or non-trending markets, where it can produce frequent false signals (whipsaws).
- Requires confirmation: Its signals are most reliable when confirmed by other indicators or analysis methods, such as price action or volume.
8. Important notes for Forex traders when using the AO
The Forex market has unique characteristics, and traders should keep these points in mind when applying the Awesome Oscillator to currency pairs.

Confirm with the larger trend:
- The Forex market is heavily trend-driven. Before taking a signal on a lower timeframe (like H1), check the AO on a higher timeframe (like D1) to ensure you are trading with the dominant momentum.
- I can’t stress this enough for Forex: always confirm with the larger trend. I’ve learned that ignoring the higher timeframe AO can lead to frustrating whipsaws on smaller charts.
Be aware of volatility:
- Major pairs like EUR/USD or GBP/USD can be very volatile. While the AO can capture strong momentum moves, it can also give false signals during choppy price action. Avoid relying on it during major news releases like NFP or central bank announcements.
- Forex volatility can be a double-edged sword. While the AO helps me catch big moves, I’ve learned to pull back during major news events, the historical momentum just doesn’t apply then.
Combine with price action:
- The most powerful AO signals are those confirmed by classic price action patterns. For example, a bullish twin peaks signal is much stronger if it forms at a key support level.
- From my experience, the most powerful AO signals are those confirmed by classic price action patterns. For example, a bullish twin peaks signal is much stronger if it forms at a key support level.
Strict risk management is non-negotiable: The liquidity of Forex allows for precise entries and exits. Always define your stop loss and take profit based on market structure, not just the AO signal, to manage risk effectively.
9. A guide to setting up the Awesome Oscillator on TradingView and MT4
Setting up the Awesome Oscillator on your trading platform is a straightforward process, enabling you to quickly utilize this popular indicator for market analysis. Whether you’re using TradingView or MetaTrader 4 (MT4), the steps are designed for ease of access, allowing traders to integrate Bill Williams’ momentum indicator into their charts with minimal effort.
- On TradingView:
Step 1: Open any chart.
Step 2: Select the “Indicators” option from the top toolbar.
Step 3: Search for “Awesome Oscillator” and click on it to add it to your chart.
- On MetaTrader 4 (MT4):
Step 1: Open your MT4 platform.
Step 2: Navigate to the “Insert” menu, choose “Indicators,” and then select “Bill Williams.”
Step 3: Click on “Awesome Oscillator” from the list. The tool will then materialize on your current chart.
10. FAQs
11. Conclusion
Ultimately, the Awesome Oscillator provides a unique and functional method for dissecting the forces behind market momentum. It gives traders a clear view of the battle between short-term and long-term market forces. By mastering the core strategies: Zero-Line Crossover, Twin Peaks, and Saucer, you can identify high-probability trading setups.
Remember that successful trading comes from practice, confirmation from other tools, and disciplined risk management. Now that you understand how it works, are you ready to apply the Awesome Oscillator to your live trades?
Infographic Section
-

Awesome Oscillator (AO): Understanding the Calculation -

Awesome Oscillator (AO) vs. MACD vs. RSI