
Have you ever watched a strong trend reverse just moments after you jumped in? Or missed a major move because you couldn’t gauge the conviction behind it? These are common frustrations for traders, but what if you had a tool designed to look past the price noise and measure the market’s true, underlying momentum?
Enter the Awesome Oscillator (AO). A creation of the famed trader and market psychologist Bill Williams, this tool was engineered to uncover the underlying market dynamics that a basic price chart often conceals. In this guide, we will break down exactly how the AO works and show you three practical strategies to make it a core part of your trading toolkit.
Key Takeaways
-
- The Awesome Oscillator quantifies the driving force of a trend by contrasting a 5-period (fast) moving average with a 34-period (slow) one.
-
- Histogram bars appearing above this line suggest bullish strength, while those below indicate bearish control over the market.
-
- Traders use four core strategies to find opportunities: the Zero-Line Crossover, Twin Peaks, Divergence, and Saucer patterns.
-
- The AO is highly effective at spotting divergences, where the indicator’s movement disagrees with the price, often signaling a potential trend reversal.
-
- The AO is most reliable in trending markets and should always be used with other analysis methods, like price action or support/resistance, for confirmation.
1. What is the Awesome Oscillator?
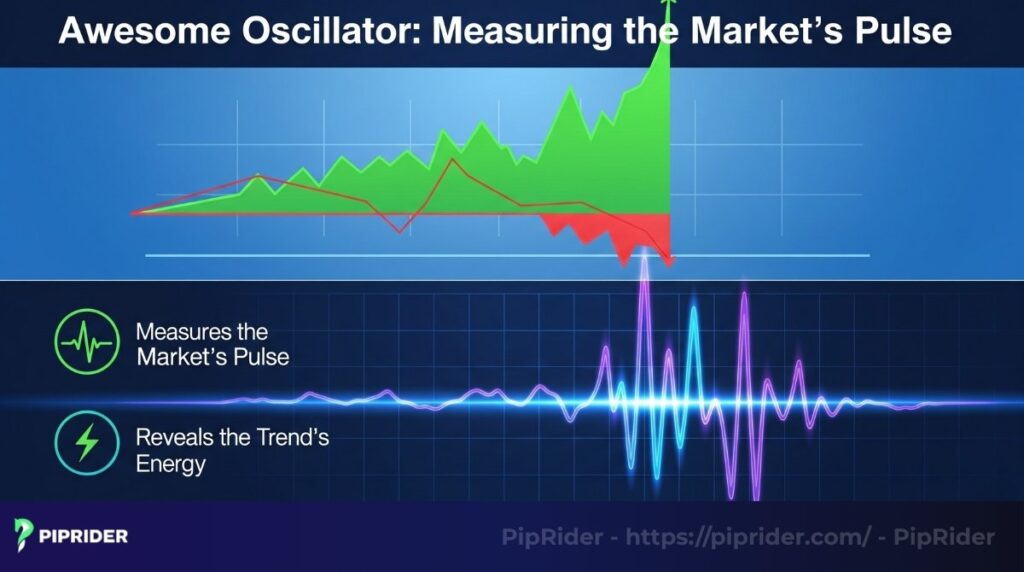
The Awesome Oscillator (AO) is a non-bounded momentum indicator that measures the market’s driving force by calculating the difference between a 5-period and a 34-period Simple Moving Average (SMA) of the median price. Legendary trader Bill Williams introduced the AO in his 1998 book, New Trading Dimensions. He designed it to reveal the “internal energy” of a trend, exposing momentum shifts that standard price charts often hide.
At a Glance: The AO Principles
- Momentum over Direction: The AO quantifies market force, not just simple price movement.
- The Zero Line Axis: Readings above zero indicate dominant bullish momentum, while readings below zero signal bearish control.
- Median Price Logic: By using (High + Low) / 2 instead of closing prices, the AO filters out short-term market noise.
- Strategic Role: Best utilized as a confirmation tool for structural breakouts and trend exhaustion, rather than a standalone entry command.
By contrasting short-term momentum (5-period) with long-term momentum (34-period), the AO identifies whether the current driving force is accelerating or decelerating. This makes it an essential tool for traders looking to determine the structural health of a trend or anticipate a potential reversal before it is reflected in the price action.
2. Awesome Oscillator Calculation
The mathematical foundation of the Awesome Oscillator (AO) is what sets it apart from traditional momentum tools. While most oscillators rely on closing prices, the AO utilizes the Median Price to provide a more balanced representation of a period’s true value, filtering out the “noise” of late-session volatility.
The calculation follows a standardized three-step process:
Step 1: Calculate the Median Price
For each period, the indicator ignores the closing price and instead uses the average of the High and Low:
Median Price = (High + Low) / 2
Step 2: Calculate the Simple Moving Averages (SMA)
Two separate SMAs are derived using the median price data from Step 1:
- 5-Period SMA: Represents immediate, short-term momentum shifts.
- 34-Period SMA: Represents the broader, longer-term trend.
Step 3: Determine the AO Value
The final oscillator reading is the mathematical difference between the fast and slow momentum:
AO = SMA (Median, 5) − SMA (Median, 34)
Practical Translation: Most traders do not need to calculate the AO manually as it is natively integrated into all major charting platforms. What matters is understanding that the AO compares fast and slow momentum through the lens of the median price. This is precisely why it often reacts to underlying market shifts differently, and often more accurately than traditional oscillators based on closing prices.
3. The Anatomy of the Awesome Oscillator
To effectively use the Awesome Oscillator (AO), you must first understand its two primary visual components: the histogram bars and the zero line. These elements work together to provide insights into market momentum and potential shifts.
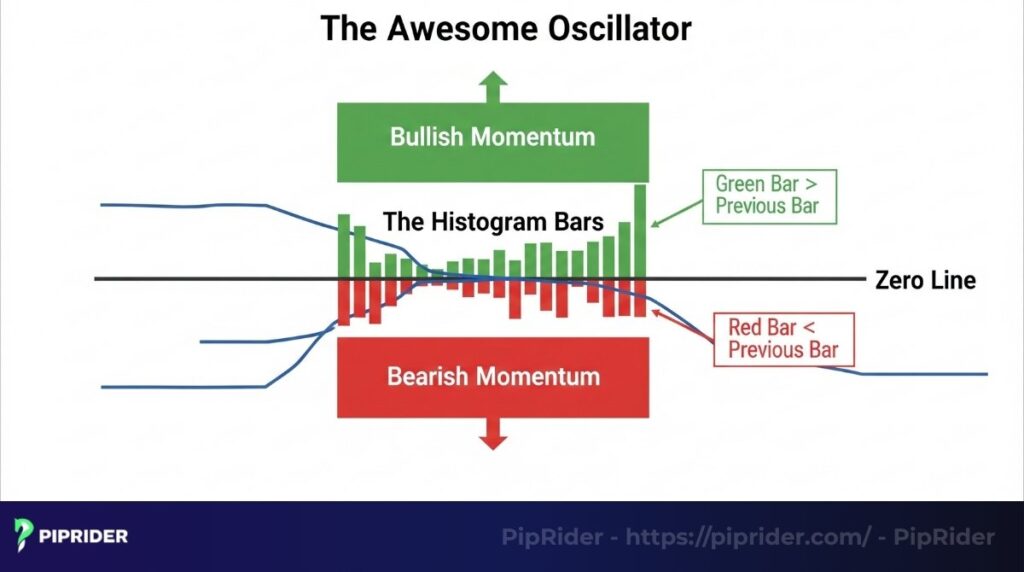
3.1. The Zero Line (The Equilibrium)
The Zero Line acts as the indicator’s “center of gravity.” It represents the point of equilibrium where short-term and long-term momentum are perfectly balanced.
- The Bullish Hemisphere: When the histogram is above zero, the short-term driving force is stronger than the long-term trend.
- The Bearish Hemisphere: When the histogram is below zero, the short-term momentum is lagging behind the long-term average.
3.2. The Histogram (The Momentum Pulse)
Unlike many indicators, the AO’s color-coding reflects its relationship with the immediately preceding bar, rather than its position relative to zero.
- Green Bar: Indicates the current value is higher than the previous bar (momentum is strengthening).
- Red Bar: Indicates the current value is lower than the previous bar (momentum is weakening).
3.3. How to Read AO Dynamics Quickly
To navigate the market effectively, traders must interpret the interaction between the histogram’s position and its color shifts. Use the following reference guide for instant market bias assessment:
| AO Behavior | Market Implication |
|---|---|
| Bars above zero | Bullish momentum dominates the market structure. |
| Bars below zero | Bearish momentum dominates the market structure. |
| Green bars growing | Momentum is actively accelerating (Increasing buying pressure). |
| Red bars shrinking below zero | Bearish pressure is easing; momentum is shifting toward neutral. |
| Cross above zero | A systemic shift toward bullish momentum is occurring. |
| Cross below zero | A systemic shift toward bearish momentum is occurring. |
4. How to Read and Trade Awesome Oscillator Signals
In professional trading, knowing a signal and knowing how to execute it are two different things. To maximize the Awesome Oscillator’s potential, we must bridge the gap between theory and execution.
Below are the four foundational AO setups, broken down into a strict, actionable framework to help you trade them effectively while managing risk.
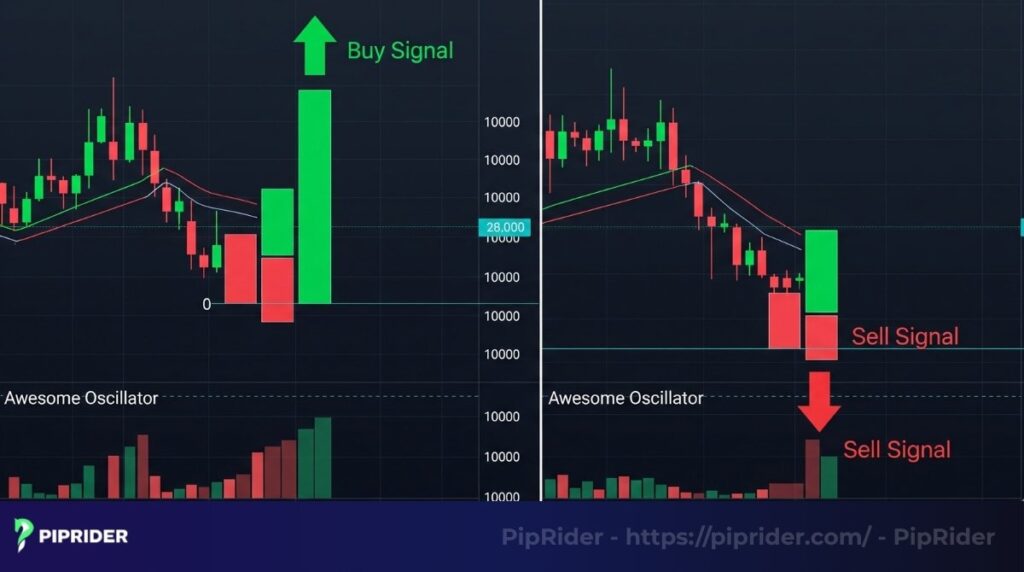
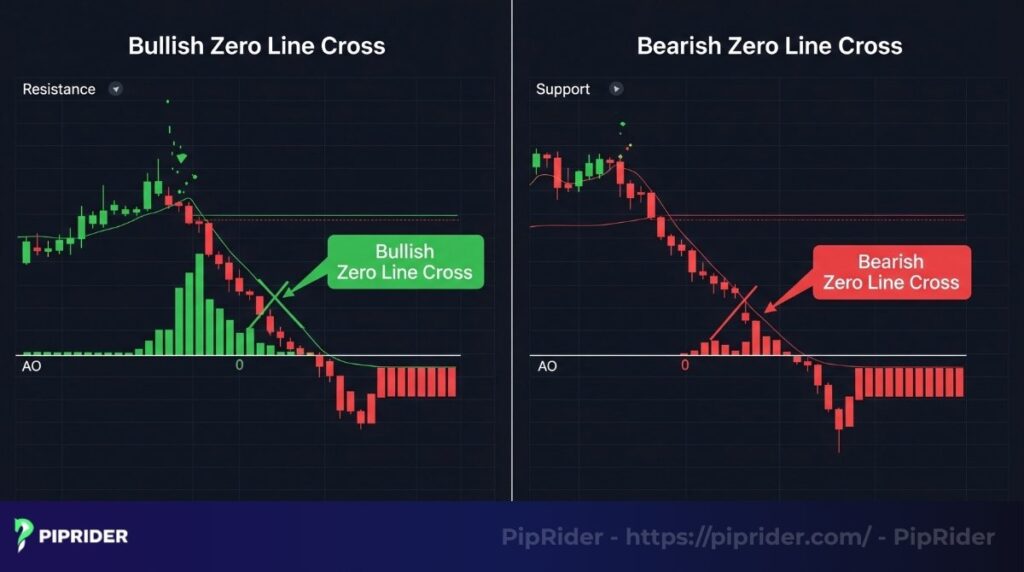
4.1. The Zero-Line Crossover
This indicates the ultimate momentum shift, where the short-term driving force (5-period SMA) aggressively overtakes the long-term trend (34-period SMA).
- Best market condition: The early stages of a new trend or immediately following a period of tight consolidation.
- Entry trigger: Enter a long position when the histogram crosses from negative to positive territory. Enter a short position when the histogram crosses from positive to negative territory.
- Confirmation: The crossover must align with a structural price breakout (e.g., clearing a major resistance level) or a moving average crossover on the price chart.
- Stop-loss idea: Place the stop-loss safely beyond the most recent swing low (for longs) or swing high (for shorts) that occurred just prior to the crossover.
- When to ignore it: Avoid this setup entirely in ranging, choppy markets. In sideways consolidation, the AO will frequently “whipsaw” across the zero line, generating false signals.
4.2. The Twin Peaks
The Twin Peaks setup is a momentum exhaustion pattern representing a “failed second push.” The market tries to continue the trend, but the underlying momentum is demonstrably weaker than the first attempt.
- Best market condition: Approaching major Support or Resistance zones after a prolonged directional move.
- Entry trigger: For a bullish setup, look for two troughs below the zero line where the second is higher than the first, followed by a green bar. For a bearish setup, look for two peaks above the zero line where the second is lower than the first, followed by a red bar.
- Confirmation: Wait for a strong price action reversal candlestick (such as a Pin Bar or Engulfing pattern) to print simultaneously with the second peak.
- Stop-loss idea: Place the stop-loss directly beyond the absolute price extreme of the first (deepest/highest) peak.
- When to ignore it: The setup is completely invalidated if the histogram crosses the zero line at any point between the two peaks. Both peaks must remain on the same side of the axis.
4.3. The Saucer
The Saucer is a rapid continuation pattern that captures a brief pause or minor pullback in momentum before the primary trend violently resumes.
- Best market condition: Strong, highly established, and aggressive directional trends.
- Entry trigger: For long trades (above the zero line), enter on the close of a green bar following two consecutive red bars. For short trades (below the zero line), enter on the close of a red bar following two consecutive green bars.
- Confirmation: The signal is strongest when the brief pause in price merely touches a dynamic support/resistance level, such as the 20 EMA, before bouncing off.
- Stop-loss idea: Use a tight stop-loss placed just below the low of the specific three-bar Saucer formation (for longs), or just above the high of the formation (for shorts).
- When to ignore it: Ignore the Saucer if it forms against the higher-timeframe trend, or if the overall market is in a sluggish consolidation phase.
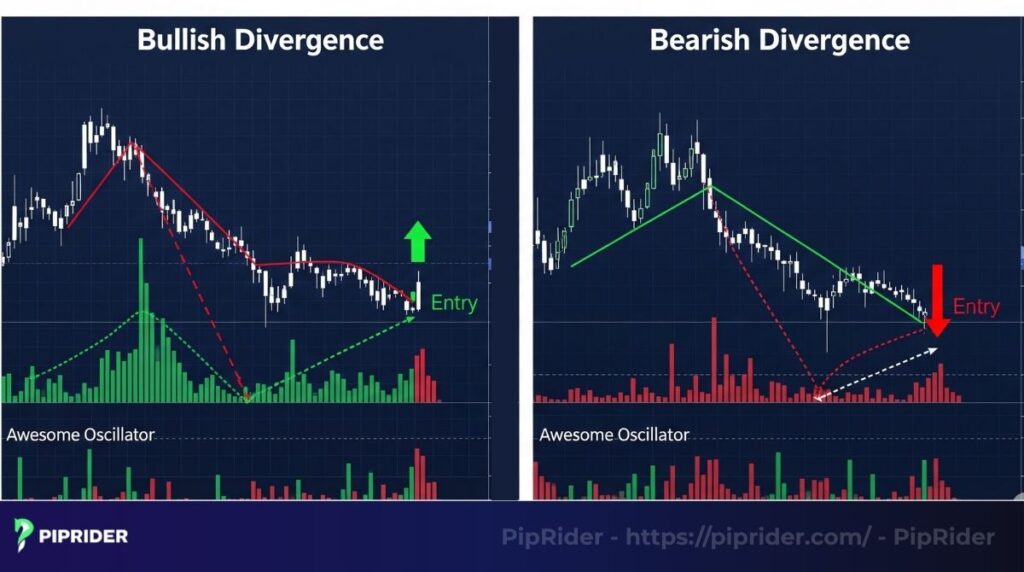
4.4. Divergence: Anticipating Reversals
Divergence is arguably the most powerful institutional application of the AO. It occurs when price action and underlying momentum actively disagree, acting as an early warning system that the current trend is structurally failing.
- Best market condition: The late, mature stages of an extended trend, particularly when the price shows signs of parabolic, unsustainable movement.
- Entry trigger: For bullish divergence, execute when the price makes a lower low but the AO prints a higher low. For bearish divergence, execute when the price makes a higher high but the AO prints a lower high.
- Confirmation: Never trade divergence on the histogram alone. Wait for a definitive confirmation trigger, such as a major trendline break or a heavy reversal candlestick.
- Stop-loss idea: Place the stop-loss safely beyond the absolute extreme price point of the divergent swing.
- When to ignore it: Disregard divergence signals during major fundamental news events (e.g., NFP, CPI releases). Algorithmic liquidity spikes can create temporary “fake” divergences that easily overrun your stop-loss.
5. The Awesome Oscillator Trading Playbook
Understanding the signals is only the first step; deploying them in the correct market environment is what generates a statistical edge. Below is a structured trading framework detailing exactly how, when, and where to execute the Awesome Oscillator’s three most powerful setups.
5.1. Strategy 1: The Saucer Re-entry (Trend Continuation)
This strategy capitalizes on brief pauses within an established trend, allowing traders to compound positions or execute high-probability momentum scalps.
- Best for: Short-term trend followers and momentum scalpers.
- Use when: The AO is clearly established on one side of the zero line (aligning with the macroeconomic trend), and the price is making a shallow, low-volume pullback.
- Entry trigger: Execute immediately after the close of the price candle that perfectly aligns with the completion of the 3-bar Saucer signal (e.g., the close of the green bar in a bullish setup).
- Stop-loss: Placed strictly outside the most recent swing high/low or the absolute extreme of the minor pullback.
- Take-profit: Target the nearest major structural high/low, strictly maintaining a minimum Risk-to-Reward (RR) ratio of 1:1.5.
- Avoid when: The broader market is trapped in sideways consolidation, or the AO histogram is rapidly alternating colors while hovering flat against the zero line.
5.2. Strategy 2: Divergence Reversal (Exhaustion Trading)
This is a high-reward mean-reversion strategy designed to catch institutional profit-taking at the extreme limits of a trend.
- Best for: Mean-reversion traders and those specializing in market exhaustion.
- Use when: A clear AO divergence prints exactly as the price strikes a major, higher-timeframe Support or Resistance zone.
- Entry trigger: Enter only after a definitive price action confirmation. This means waiting for a structural break of a lower-timeframe trendline or the close of a heavy reversal candlestick (like an Engulfing pattern) at the extreme.
- Stop-loss: Positioned securely beyond the absolute extreme price point of the divergent swing. If the price breaks this extreme, the divergence is invalidated.
- Take-profit: Target the nearest major retracement zone (such as the 38.2% or 50% Fibonacci level of the primary move) or the opposing liquidity pool.
- Avoid when: Divergence appears in the middle of a massive, news-driven parabolic trend without any accompanying structural breakdown in price.
5.3. Strategy 3: Zero-Line Breakout Confirmation
A momentum-burst strategy used to validate structural breakouts, ensuring that internal market force supports the visual price action.
- Best for: Breakout and momentum traders.
- Use when: The price action is actively breaching a tightly defined consolidation range or a critical structural key level.
- Entry trigger: Execute upon the close of the definitive breakout candle, provided the AO simultaneously crosses the zero line in the exact direction of the breakout.
- Stop-loss: Tucked safely behind the breakout point (the breached support/resistance) or the most recent structural swing inside the range.
- Take-profit: Aim for a 1:1 measured move of the preceding consolidation range, or target the next major structural supply/demand zone.
- Avoid when: The AO crosses the zero line, but the price action remains trapped inside the consolidation range. This is a classic leading-indicator fake-out.
5.4. Strategy 4: Twin Peaks Early Reversal
This setup acts as an early warning system for trend exhaustion, allowing traders to capture mean-reversion moves before a broader structural divergence even materializes.
- Best for: Counter-trend traders and early reversal hunters.
- Use when: The AO is overextended and forms a second peak that is closer to the zero line than the first peak, while the price simultaneously tests a major higher-timeframe Support, Resistance, or liquidity zone.
- Entry trigger: Execute immediately after a strong price action rejection (e.g., a Pin Bar or bearish/bullish Engulfing) prints concurrently with the completion of the second peak and the appearance of the first reversal-colored histogram bar (green for bullish, red for bearish).
- Stop-loss: Placed strictly beyond the absolute extreme wick of the price rejection candlestick.
- Take-profit: Target a mean-reversion move back to the dynamic baseline (e.g., the 20 or 50 EMA) or the closest structural Support/Resistance level. Maintain a strict minimum 1:1.5 RR.
- Avoid when: The AO histogram crosses the zero line at any point between the formation of the first and second peak (which completely invalidates the mathematical pattern), or if the market forms the peaks without any visible structural price rejection at a key level.
5.5. Combining AO with other indicators for enhanced accuracy
While powerful, no single indicator is perfect. Combining the Awesome Oscillator with other tools provides confluence, significantly improving the reliability of your signals.
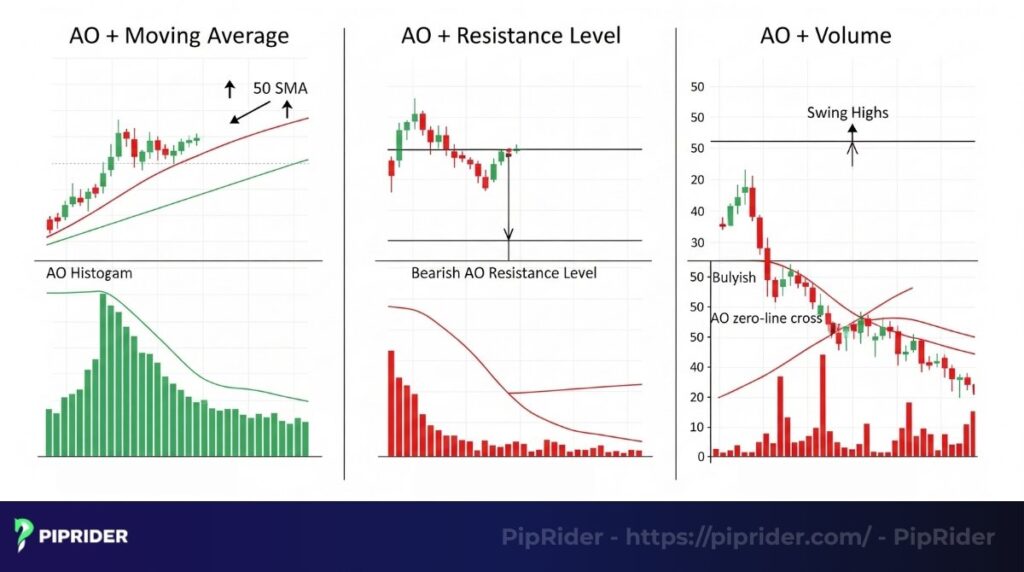
- AO + Moving Averages (MAs): Use a 50-period or 200-period Simple Moving Average (SMA) to identify the primary trend. Only take AO buy signals when the price is above the MA, and sell signals when the price is below the MA. For example, a bullish “Saucer” or Zero Line Cross is far more reliable when the price is trading above its 50 SMA.
- AO + Support/Resistance Levels: Look for AO signals (especially divergence) near key support or resistance zones. A bullish divergence appearing at a strong support level or a bearish divergence at resistance greatly increases the probability of a reversal. The AO can confirm whether these levels will hold or break.
- AO + Volume: For stock or crypto trading, combining AO signals with volume can provide extra conviction. A strong AO Zero Line Cross on high volume confirms conviction behind the momentum shift. Divergence accompanied by declining volume often reinforces the idea of momentum fading.
By understanding these unique applications and combining the Awesome Oscillator with other indicators, you can develop a robust trading strategy that leverages momentum shifts and anticipates market turning points with greater precision.
6. Compare Awesome Oscillator vs. Other momentum indicators
The Awesome Oscillator (AO) offers unique insights into market momentum. The table below provides a quick comparison of AO against the Relative Strength Index (RSI), Accelerator Oscillator (AC), and MACD, highlighting their distinct features, key signals, and ideal use cases to help you choose the best tool for your trading strategy.
6.1. Quick Selector: Which Indicator Should You Use?
To help you decide which momentum tool fits your current trading objective, use the reference table:
| If your primary goal is to | The best indicator for the job is |
|---|---|
| Spot momentum reversals visually (via patterns) | Awesome Oscillator (AO) |
| Identify Overbought or Oversold extremes | Relative Strength Index (RSI) |
| Trade crossover-based trend & momentum shifts | MACD |
| Read the raw acceleration/speed of momentum | Accelerator Oscillator (AC) |
6.2. Decision Support: Choosing the Right Tool for Your Strategy
While all momentum indicators share a common goal, their practical roles in a professional trading desk differ significantly:
- When to choose AO over RSI: Use the AO if you prefer reading momentum through visual histogram structures like “Saucers” or “Twin Peaks.” Unlike the RSI, which is bound between 0-100 and focus on overextended levels, the AO excels at showing the pure “driving force” of a trend without the distraction of fixed boundaries.
- When MACD outperforms AO: The MACD is often more practical for beginners or those trading medium-to-long-term trends. Its signal line (EMA of the MACD) acts as a built-in filter that smooths out market noise, making it easier to identify high-probability entries compared to the more sensitive AO.
- The Practical Role of AC: Think of the Accelerator Oscillator (AC) as the “early warning” version of the AO. It measures the acceleration of momentum. In practice, the AC will often change color before the AO, making it an invaluable tool for aggressive traders looking for the absolute earliest entry into a momentum burst.
- The Beginner’s Priority: If you are just starting, prioritize MACD for trend-following or RSI for identifying reversals. Once you are comfortable reading price action, integrate the Awesome Oscillator (AO) to add a layer of structural momentum analysis (Divergence and Twin Peaks) to your execution.
7. Advantages and limitations of Awesome Oscillator
Like any technical tool, the Awesome Oscillator has benefits and drawbacks. Acknowledging them is vital for using it properly.
Advantages:
- Simplicity: With a clear histogram and zero line, the AO is easy to read and interpret, even for new traders.
- Unambiguous signals: Strategies like the zero-line crossover and twin peaks generate very distinct entry and exit points.
- Momentum clarity: The indicator excels at visualizing the force behind a trend, which helps traders assess its overall health.
- Divergence detection: The AO is very effective at spotting divergences, which can be early warnings of a trend reversal.
Limitations:
- Inherent lag: As it is constructed from moving averages, the AO is, by definition, a lagging indicator.
- Whipsaws in ranging markets: The indicator is less reliable in sideways or non-trending markets, where it can produce frequent false signals (whipsaws).
- Requires confirmation: Its signals are most reliable when confirmed by other indicators or analysis methods, such as price action or volume.
8. Forex Execution Framework: When to Trust the AO
In the fast-paced Forex market, the Awesome Oscillator is only as good as the context in which it is used. To avoid “noise” and false signals, traders must apply the following framework to determine when to execute and when to stand aside.

8.1. When AO Works Best in Forex (High-Probability)
The AO reaches its maximum predictive power when the market structure is clean and institutional participation is high. In a market that processes over $9.6 trillion in daily trading volume (according to the Bank for International Settlements’ 2025 Triennial Survey), filtering out noise to find true directional momentum is critical.
- Trending Pairs: Focus on major or minor pairs (e.g., EUR/USD, GBP/JPY) that are in a clearly defined trend. The AO excels at capturing “waves” of momentum within these trends.
- Higher Timeframes (H1, H4, D1): While usable on M5, the AO is significantly more reliable on H1 and above. These timeframes filter out the “market noise” and reflect true institutional position-building.
- Structural Confluence: Execute AO signals only when they align with established price structures, such as a bounce off a major Support/Resistance zone or a breakout from a multi-day range.
- Post-News Stabilization: The AO is most effective after the initial volatility of a news event has subsided and a clear directional momentum has been established for the remainder of the session.
8.2. When AO Fails More Often (Low-Probability)
Using the AO in these environments typically leads to “whipsaws” and rapid account drawdown.
- Choppy Intraday Ranges: Avoid the AO when the price is oscillating in a tight, sideways range with no clear direction. In these zones, the histogram will flip colors frequently without any meaningful price movement.
- Major Macroeconomic Spikes: Do not rely on AO signals immediately before, during, or shortly after high-impact news (e.g., NFP, CPI, Central Bank rate decisions). The historical 34-period momentum is instantly invalidated by these fundamental shocks.
- Mechanical Over-Trading: A common mistake is treating every single color change as a signal. If the AO changes from red to green while the overall trend is bearish and the price is in the middle of a range, the signal lacks context and is likely a trap.
- Isolation Bias: The AO fails most often when used in total isolation. Without looking at price action, volume, or higher-timeframe trends, the indicator is simply a lagging mathematical derivative of past data.
9. Quick-Start: Setting Up the Awesome Oscillator
The Awesome Oscillator is a standardized tool within the Bill Williams suite of indicators. To maintain consistency across different market environments, professional charting platforms have integrated it with pre-set mathematical parameters, ensuring that the 5 and 34-period logic remains intact across all workstations.
9.1. Integration on TradingView
TradingView has become the preferred choice for modern technical analysis due to its high-performance cloud-based charting. The platform offers a seamless implementation of the AO, allowing for precise visual customization of the histogram.
- Access Indicators: Open your preferred asset chart and click the “Indicators” button on the top toolbar.
- Search for the Tool: In the search bar, type “Awesome Oscillator” and select the official version from the technicals list.
- Confirm Settings: Once added, verify that the inputs are set to the default 5 (Short) and 34 (Long). No further manual calculation is required.
9.2. Installation on MetaTrader 4 (MT4)
Despite the rise of web-based platforms, MetaTrader 4 remains the global industry standard for retail Forex execution. Because the AO is a legacy indicator created by Bill Williams, it is natively built into the MT4 software architecture.
- Navigate the Menu: Go to the top navigation bar and select Insert > Indicators.
- Locate Bill Williams Suite: Hover over the “Bill Williams” category to reveal the specialized oscillator group.
- Execute Setup: Click on “Awesome Oscillator” from the list. A dialogue box will appear; simply click OK to apply the indicator to your active chart pane with the original institutional settings.
10. FAQs
11. Conclusion
Ultimately, the Awesome Oscillator provides a unique and functional method for dissecting the forces behind market momentum. It gives traders a clear view of the battle between short-term and long-term market forces. By mastering the core strategies: Zero-Line Crossover, Twin Peaks, Divergence, and Saucer, you can identify high-probability trading setups.
Remember that successful trading comes from practice, confirmation from other tools, and disciplined risk management. Now that you understand how it works, are you ready to apply the Awesome Oscillator to your live trades?
Infographic Section
-

Awesome Oscillator (AO): Understanding the Calculation -

Awesome Oscillator (AO) vs. MACD vs. RSI


