
The Bearish Shooting Star is a prominent single-candle pattern in price action trading, widely used to alert traders of potential trend exhaustion. It acts as a visual warning that buyers are losing control and the market is rejecting higher prices.
However, a Shooting Star is not a guaranteed sell signal. To avoid false breakouts, it requires strict confirmation and proper market context. This guide covers the essential rules for identifying valid setups and executing high-probability trades across Forex, stocks, and cryptocurrency markets.
Key Takeaways
- A single-candle bearish trend reversal pattern.
- Identified by a small body and a long upper wick, showing price rejection.
- Most reliable when it forms after an uptrend at a key resistance level.
- Confirmation from the next candle is crucial to avoid false signals. Effective risk management is essential for all trades.
- Often confused with its bullish counterpart, the Inverted Hammer.
1. What Is a Shooting Star Candlestick Pattern?
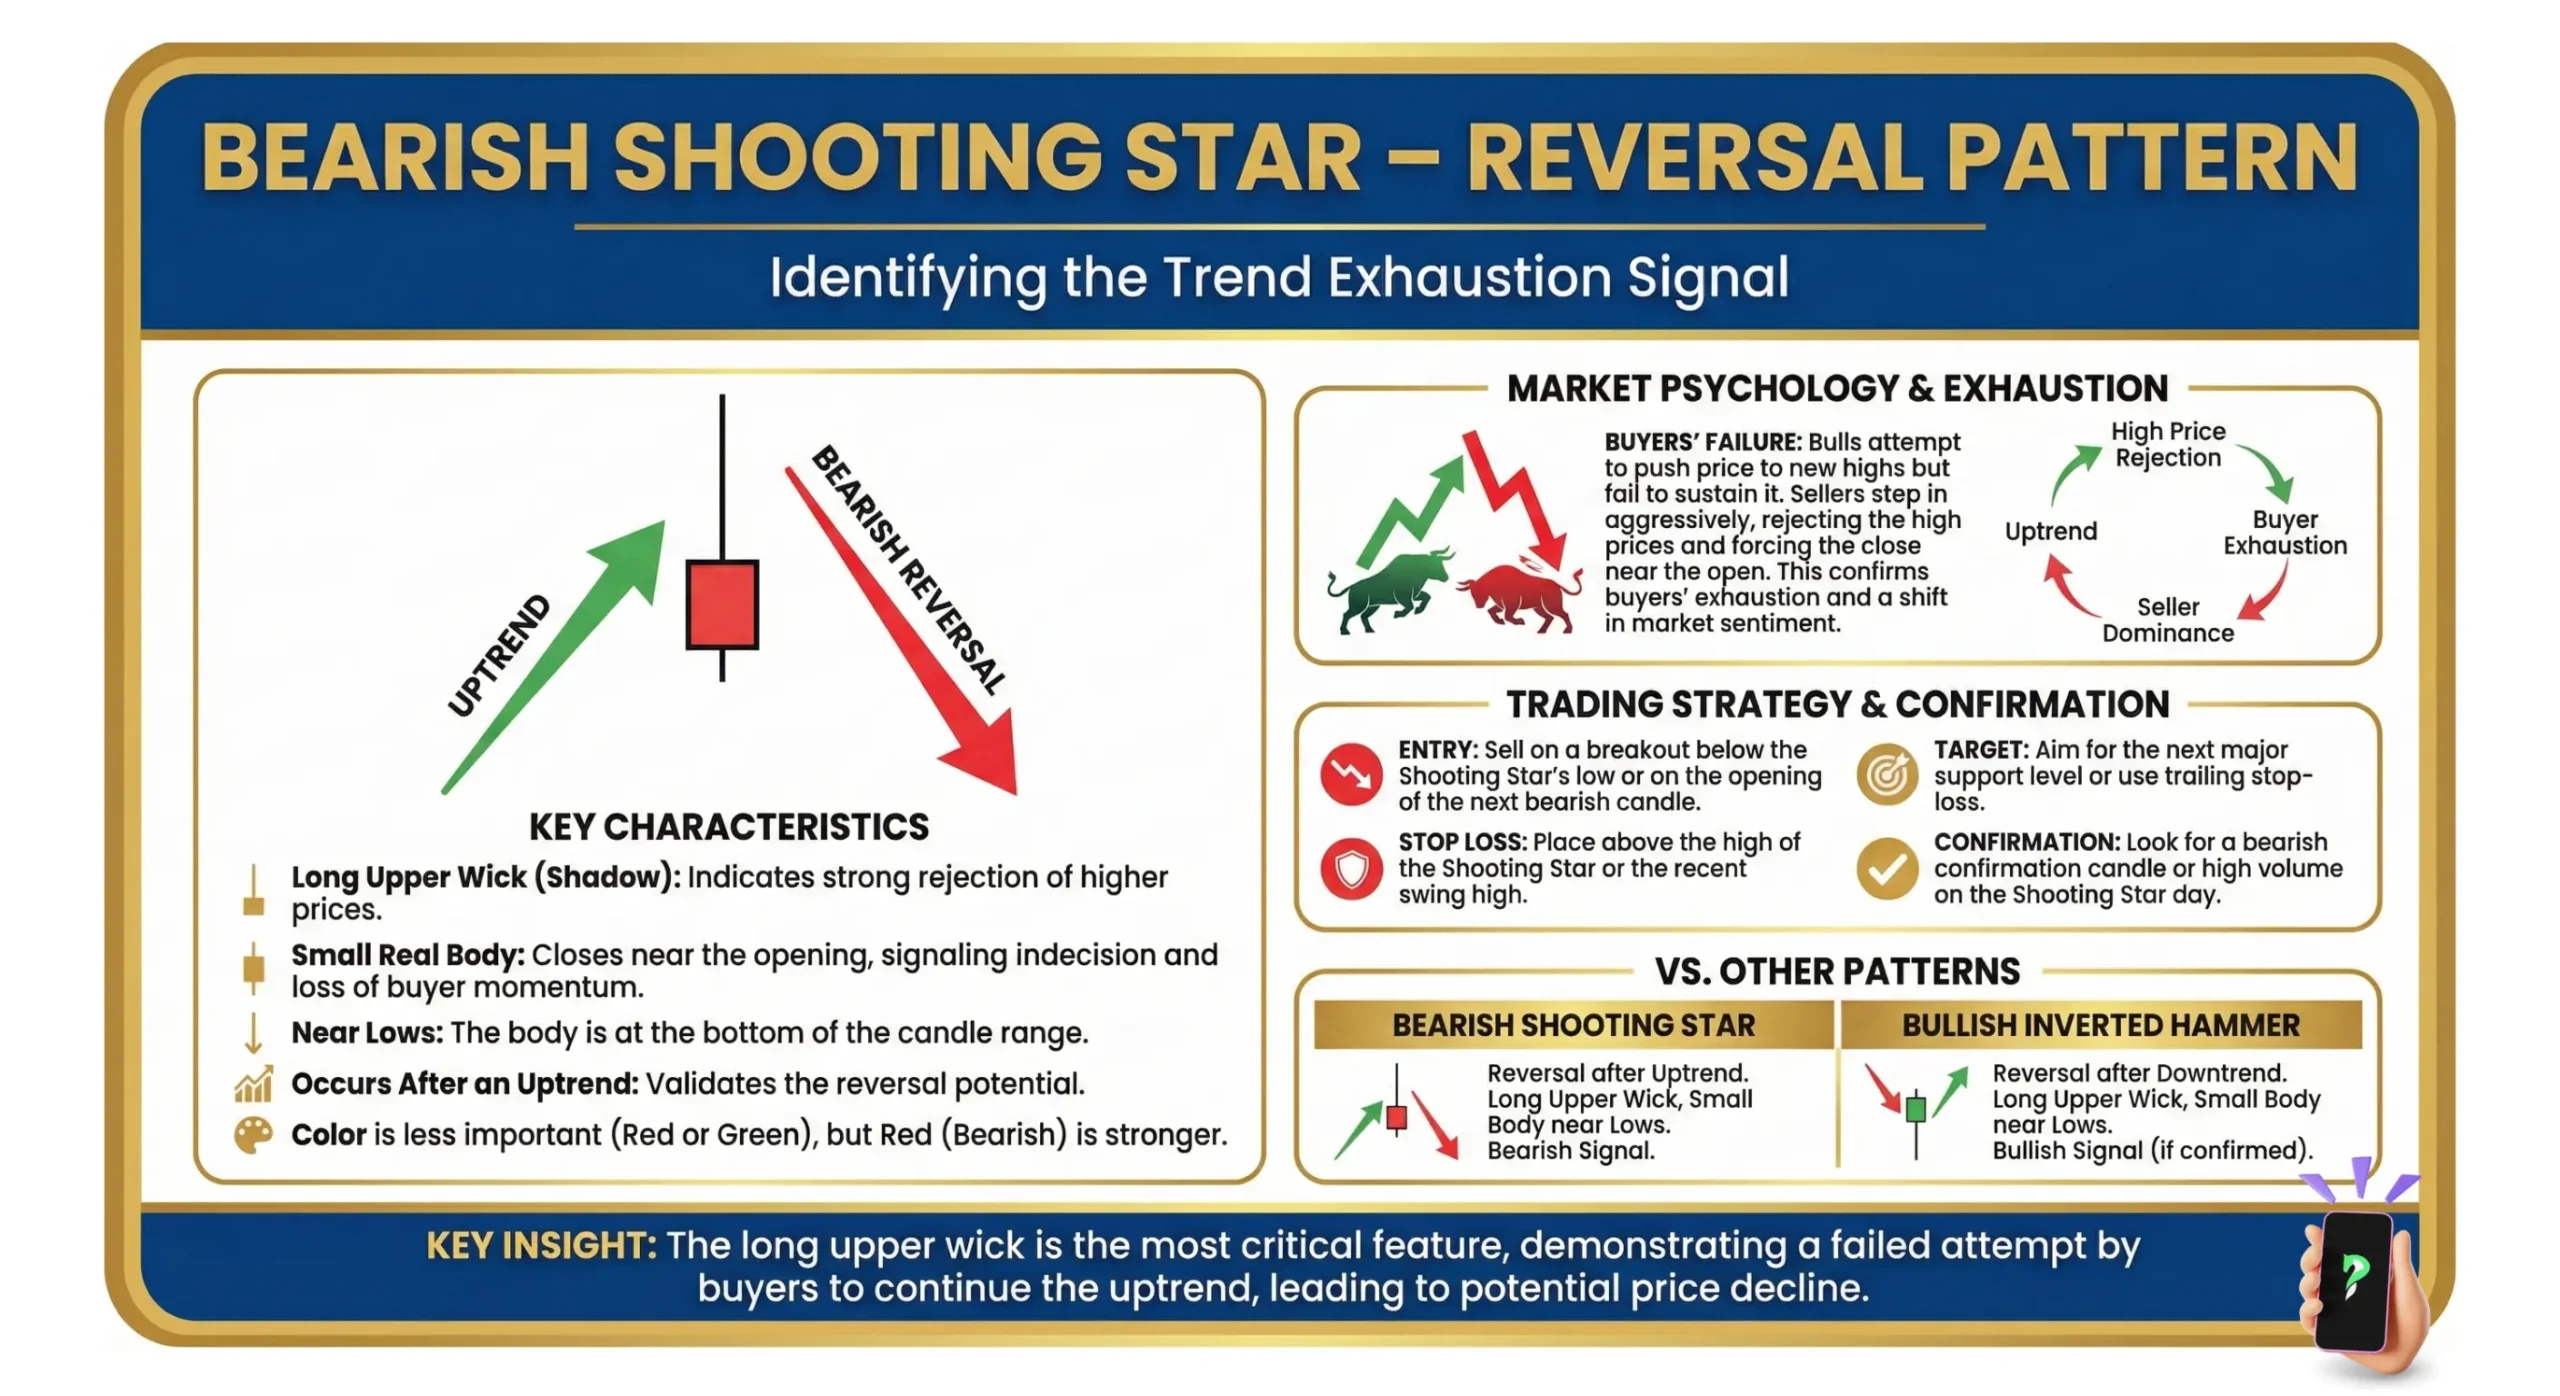
A shooting star is a single candlestick pattern that signals a potential bearish trend reversal in technical analysis. It is characterized by a small real body at the lower end of the candle, a long upper shadow (or wick), and little to no lower shadow. It visually represents a failed attempt by buyers to push the price higher.
In price action terminology, this structure is also known as a bearish pin bar, which indicates a sharp rejection of higher prices.
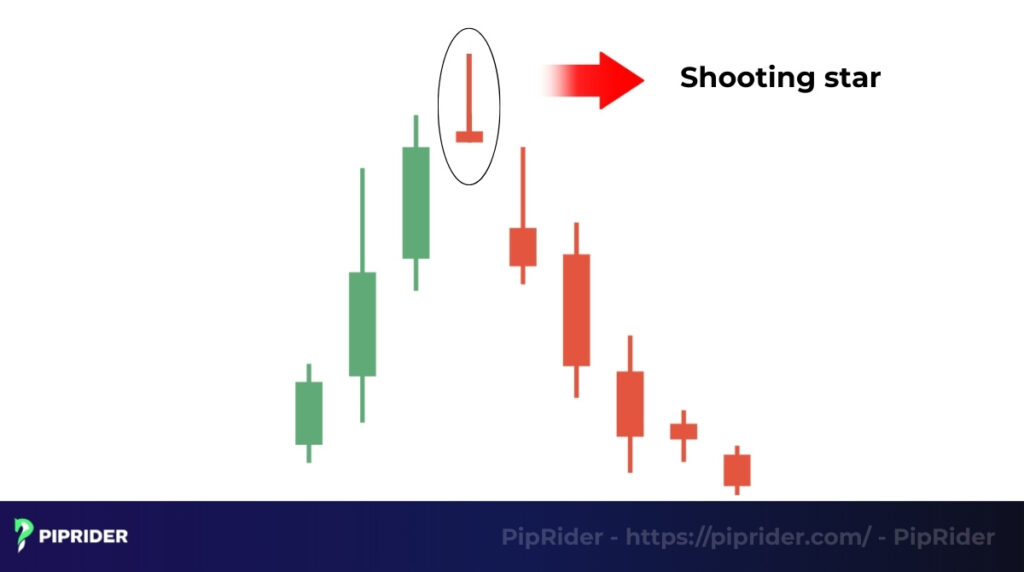
The shooting star candlestick formation is only considered a valid and powerful signal when it appears at the top of an uptrend. It acts as an early warning sign that the prevailing bullish momentum is fading and that sellers may be about to take control of the market.
The psychology behind this pattern is a story of a failed rally. The long upper wick shows that during the session, buyers initially pushed the price significantly higher. However, sellers then stepped in with overwhelming force, or buying power was simply exhausted, and this strong selling pressure pushed the price all the way back down to close near where it opened. This strong rejection of higher prices is a clear bearish signal.
2. Structure and Characteristics of the Shooting Star Pattern
To accurately identify a shooting star, traders must look for a specific set of visual characteristics that define the pattern and its bearish potential.
A valid pattern must have:
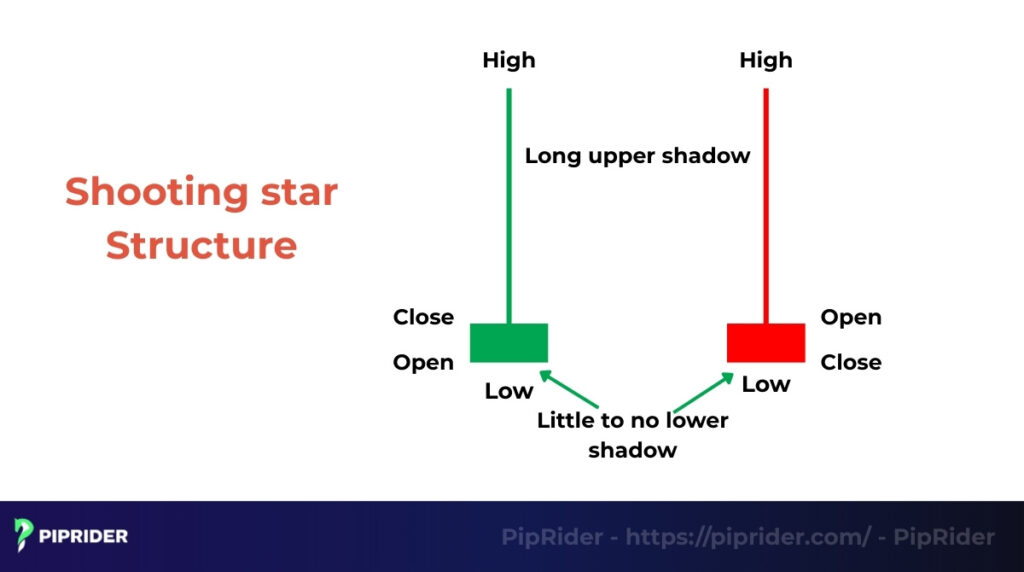
- A small real body located at the bottom of the candle’s total range.
- A long upper shadow (or wick) at least twice the body’s length. This is the most critical feature, as it visually represents the strong price rejection.
- Little to no lower shadow.
While the pattern’s overall signal is always bearish, the color of the candle adds a layer of nuance. A red (bearish) body is considered a stronger indication, as it shows sellers pushed the market below the open. A green (bullish) one is still a valid signal but is considered slightly weaker, having managed to close above its open.
3. Bearish Shooting Star vs. Other Candlestick Patterns
A common challenge for new traders is confusing this pattern with other reversal or indecision candles. The table below provides a quick comparison, followed by a more detailed explanation of the key differences.
Comparison Table
| Pattern | Signal | Key Difference |
| Shooting Star | Bearish | (Baseline Pattern) |
| Inverted Hammer | Bullish | Identical shape, but forms after a downtrend. |
| Doji | Indecision | Represents a tie, not a clear rejection by sellers. |
| Hanging Man | Bearish | Opposite shape (long lower wick, body at top). |
| Evening Star | Bearish | A three-candle pattern, not a single candle. |
- Vs. Inverted Hammer
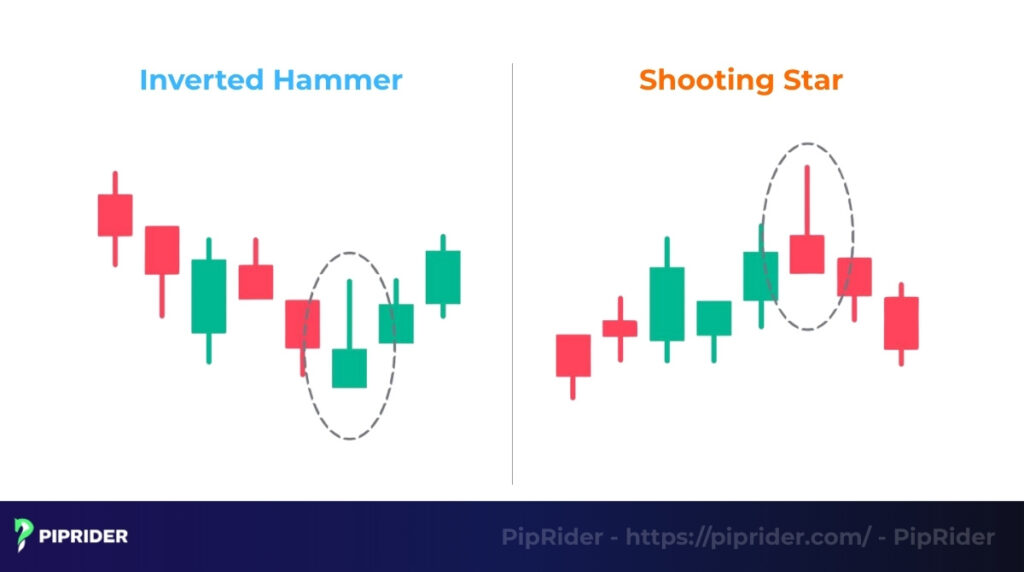
The two candles look identical, yet their meaning is opposite. The key difference lies in location: a Shooting Star forms after an uptrend (bearish), whereas an Inverted Hammer forms after a downtrend (bullish).
Note: Single-candle bullish reversals like the Inverted Hammer can be risky. Traders seeking higher reliability often prefer waiting for strong two-candle confirmations like the Piercing Candlestick Pattern before buying.
- Vs. Doji
A Doji candle features a body that is just a thin line, indicating pure indecision where neither buyers nor sellers prevailed. A shooting star pattern, in contrast, has a small but distinct form at the bottom, demonstrating a decisive rejection of higher prices by sellers. Essentially, a Doji signifies a tie; a shooting star has a clear winner.
- Vs. Hanging Man
Both are bearish reversal signals that appear after an uptrend, but their shapes are mirror opposites. A Shooting Star pattern has a long upper shadow, showing a rejection of higher prices. A Hanging Man has a long lower shadow and a small body at the top, showing that sellers are starting to challenge the uptrend from below.
- Vs. Evening Star
A Shooting Star is a single-candle formation. An Evening Star, conversely, is a three-candle bearish trend reversal pattern. Notably, a shooting star pattern can often serve as the second candle within an Evening Star structure, integrating into a larger and more powerful reversal signal.
Pro Tip: If you want a balance between speed (1 candle) and confirmation (3 candles), look for the Dark Cloud Cover Pattern. It is a two-candle bearish setup that offers a high-probability entry without waiting too long.
4. How to Trade the Bearish Shooting Star
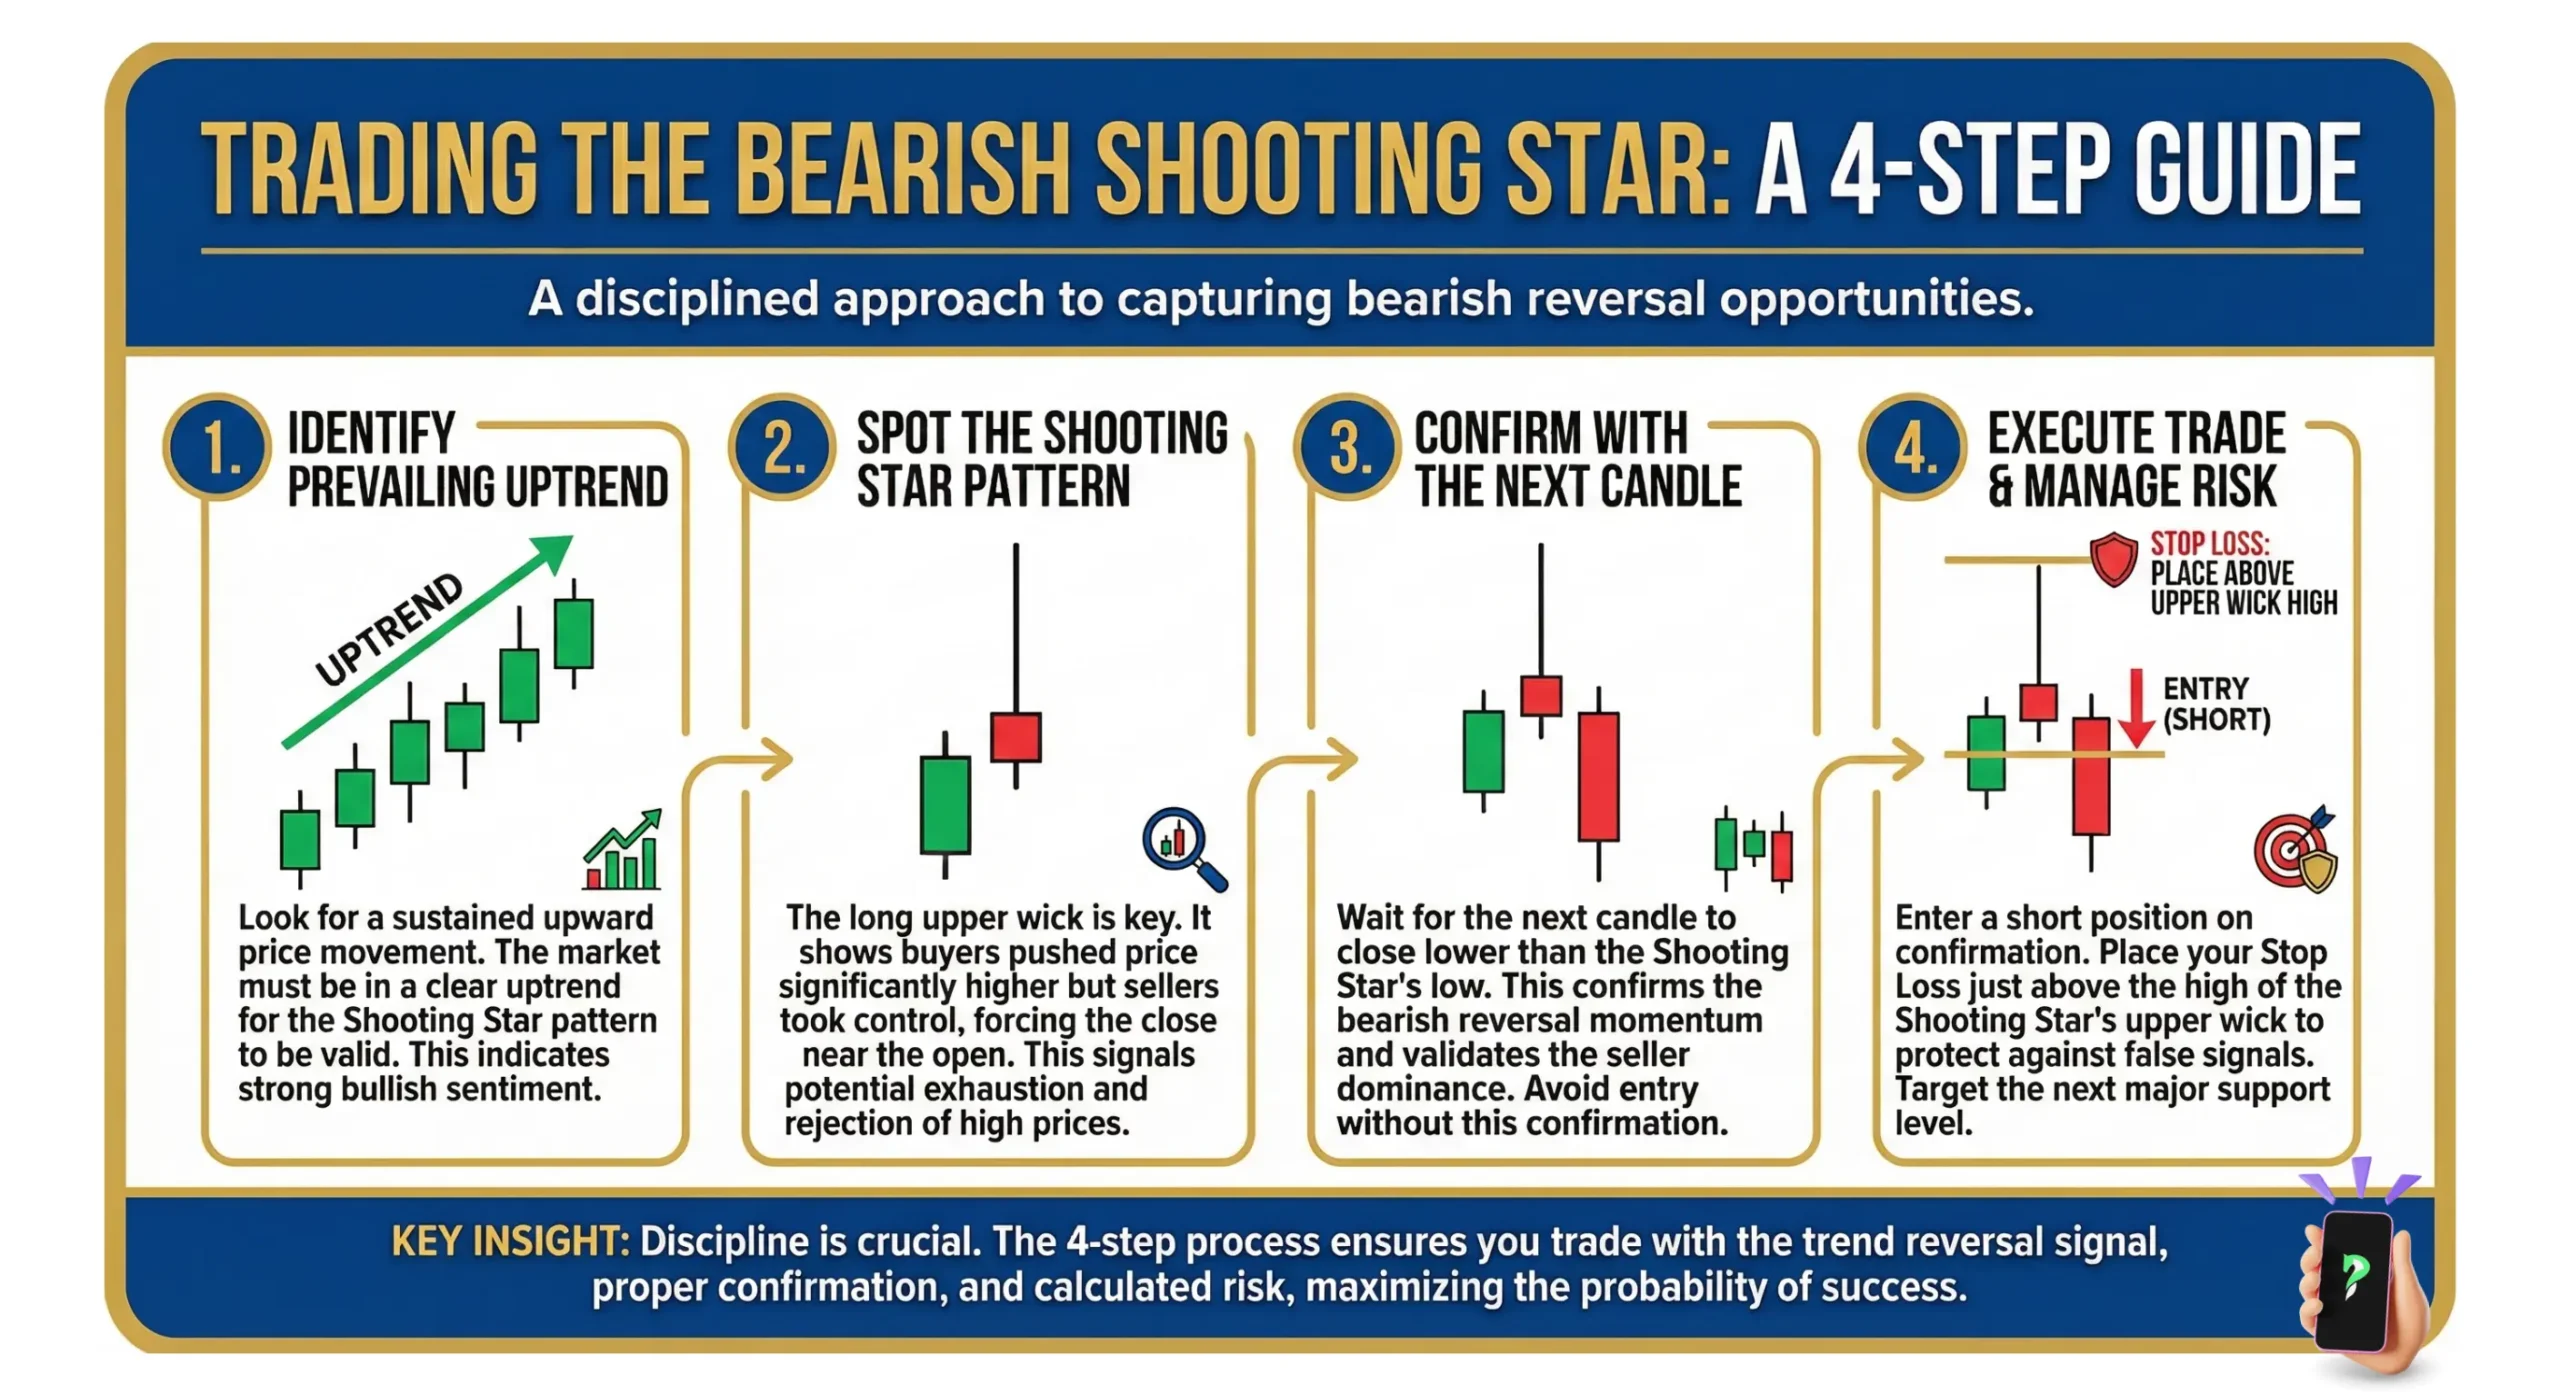
Trading a shooting star is more than just spotting the candle. A successful strategy requires a clear set of rules for confirming the setup within the correct market context and having clear rules for entry, stop-loss, and take-profit. The two most important conditions are: the pattern must appear after a clear uptrend, and it must form at a key resistance level.
4.1. Entry Strategy
A common mistake is to enter a short trade the moment a shooting star closes. From our experience, it’s better to wait for further confirmation.
The most reliable entry is placed after the confirmation candle. This next candlestick forms subsequent to the shooting star. If it is bearish and closes below the pattern’s low, this confirms sellers are in control. Traders often enter the trade at the close of this confirming candle.
Confirming the bearish move with an increase in volume adds significant strength to the entry signal. Volume analysis is a key component of this confirmation.
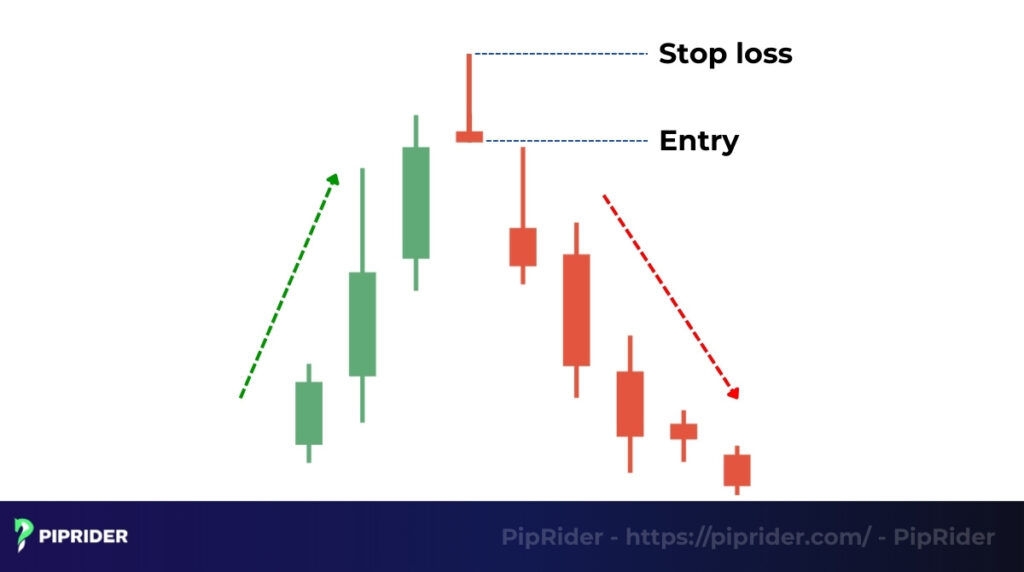
4.2. Stop-Loss Placement
The rule for placing a stop-loss order when trading a shooting star is logical and simple. It should be set a few pips just above the high of the pattern’s long upper wick.
This high represents the peak of bullish momentum before sellers took control. If the price breaks above this level, the bearish trend reversal signal is considered invalid, and the stop-loss order will exit the trade for a small, defined loss, protecting your capital.
4.3. Take-Profit Targets
Once your entry and stop-loss are set, the final part of the plan is to define where you will take your profit. Setting a clear take-profit level removes greed from the trade and ensures you have a complete exit strategy.
Here are two common methods for determining your target:
The simplest and most common method is to identify the next significant support level below your entry and set your take-profit target just above it. This is a high-probability area where buyers may step back in and push the price up.
For a more mathematical approach, you can use the Fibonacci retracement tool on the prior uptrend that led to the shooting star. Common profit targets are often set at key Fibonacci levels of that move, such as the 38.2%, 50%, or 61.8%, particularly if the retracement confirms a triple top forming near resistance.
4.4. Choosing Your Entry Style: Aggressive vs. Conservative
Once the pattern forms, traders must decide when to pull the trigger. This depends on your risk appetite:
The Aggressive Entry (Market Order):
- Action: Enter a sell order immediately as the Shooting Star candle closes.
- Pros: You get the best possible price, resulting in a wider Risk-to-Reward (R:R) ratio.
- Cons: High risk of a “false signal.” The next candle might turn bullish and invalidate the setup immediately.
The Conservative Entry (Stop Order/Confirmation):
- Action: Place a “Sell Stop” order 1-2 pips below the low of the Shooting Star candle. The trade only triggers if the price breaks downward.
- Pros: Higher win rate. It filters out setups where the price fails to follow through.
- Cons: You enter at a lower price, slightly reducing the potential profit margin.
Pro Tip: For beginners, the Conservative approach is strongly recommended. sacrificing a few pips of profit is worth the extra confirmation to avoid “whipsaw” losses.
5. Shooting Star with Technical Indicators
While a bearish shooting star at a key resistance is a powerful signal, its reliability can be further increased by seeking “confluence” with other indicators. A common combination is with the stochastic oscillator. Here are a few key combinations:
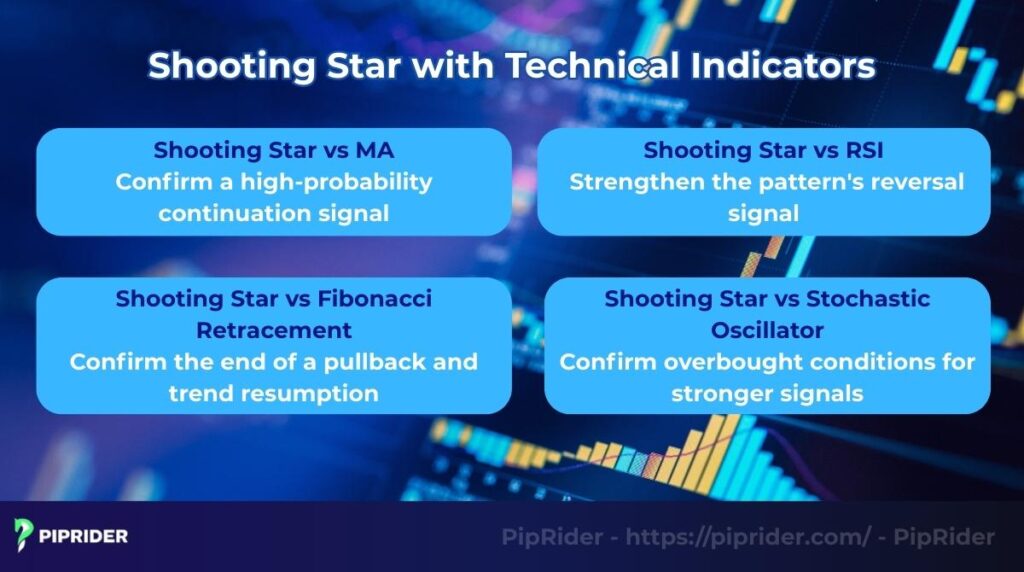
- Combining with RSI (Momentum Check): Instead of just looking for “Overbought” conditions, pro traders hunt for Bearish Divergence:
- The Ideal Setup: Price pushes up to make a Higher High (creating the Shooting Star’s wick), but the RSI indicator makes a Lower High. This mismatch confirms that the internal buying momentum is dead, validating the reversal.
- The Warning: If the RSI is showing bullish structure (making higher lows), the Shooting Star is likely a “fake-out” in a strong trend. Stand aside.
- Combining with Moving Averages: A shooting star that forms and is rejected by a key moving average (like the 50 EMA) acting as dynamic resistance in a downtrend is a very high-probability continuation signal.
- Combining with Fibonacci Retracement: When a pullback in a downtrend reaches a key Fibonacci retracement level (such as the 61.8%) and a shooting star forms, it signals that the correction is likely over and the primary downtrend is set to resume.
- Combining with Stochastic Oscillator: Similar to the RSI, the stochastic oscillator can also be used to confirm overbought conditions that support a bearish reversal signal.
6. Common Mistakes and Limitations
To trade this pattern effectively, it’s just as important to know what not to do. Many traders make a few recurring mistakes that can turn a high-probability setup into a loss.
The most common error is mistaking a shooting star for an Inverted Hammer. They look identical, but while a shooting star is a bearish indicator emerging after an uptrend, its counterpart is a bullish one following a downtrend. Context is everything.
For a shooting star to act as a valid reversal signal, an established trend must precede it. In a choppy, sideways market, the pattern loses its predictive power and often becomes an unreliable signal.
Traders should also be aware that candlestick reversals work best when they align with broader technical structures. For example, a shooting star appearing near the resistance of a cup and handle pattern or within the completion zone of harmonic patterns can significantly increase the probability of a successful reversal.
7. Advantages and Disadvantages
The primary advantages of the pattern are its ease of identification and the powerful reversal signal it can provide. Its distinct shape makes it easy for traders to spot on a chart, and when it forms in the correct context after an uptrend, it offers a clear and potent warning of a potential market top.
However, its main disadvantage is its vulnerability to false signals. A shooting star that appears in isolation without momentum validation should be treated with caution.
Note for Forex Traders: In the decentralized Spot Forex market, volume data represents “tick volume” provided by your broker, not total market turnover. Therefore, treat volume confirmation as optional. Instead, prioritize the close of the next candle (confirmation candle) and key resistance confluence to validate the setup.
Context is key. Unlike inside bar bullish or bearish formations which indicate market indecision or consolidation, a Shooting Star represents a violent rejection. Therefore, it requires a clear prior uptrend to be valid.
8. Frequently Asked Questions (FAQs)
9. Conclusion
The bearish shooting star pattern is a powerful signal in price action trading when it is identified in the correct market context. Its reliability increases significantly when combined with other confirming factors, such as technical indicators and multi-timeframe analysis. As with any trading setup, always practice proper risk management with a properly placed stop-loss order to protect against false breakouts.
To continue building your chart reading skills, we encourage you to explore more in-depth guides in our Forex Chart Patterns category on Piprider.
Infographic Section
-
Bearish Shooting Star – Reversal Pattern -
A 4 Step Guide -
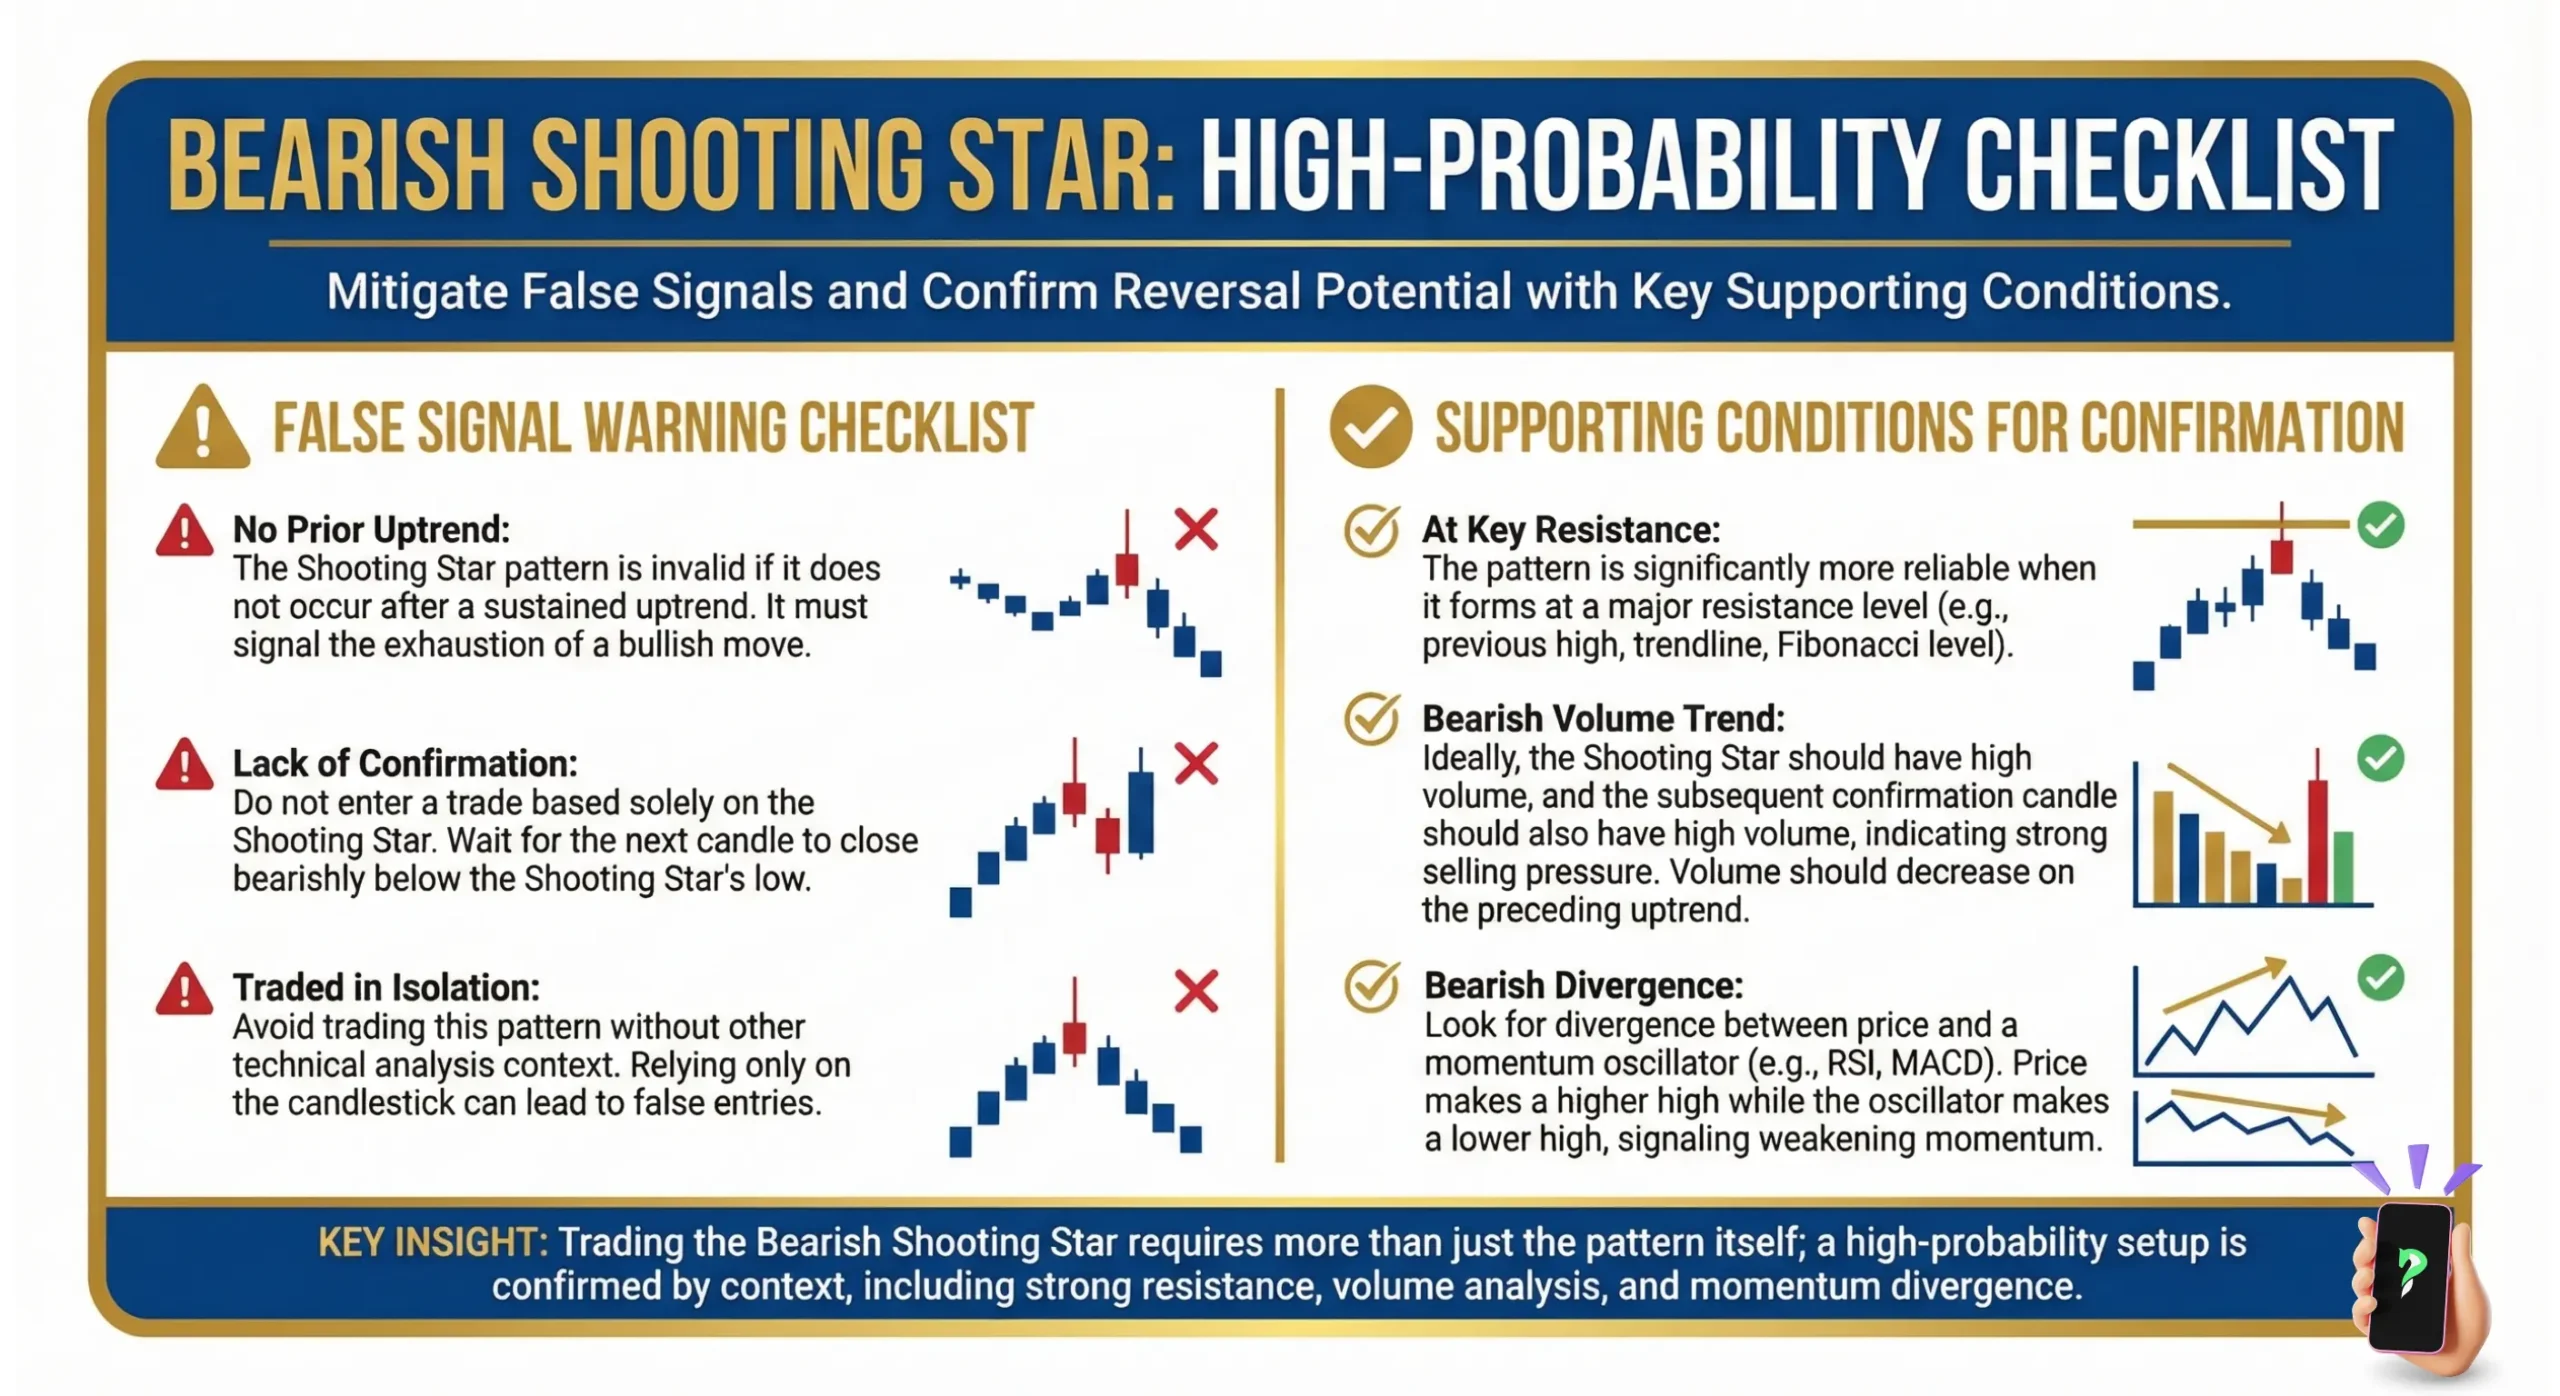
High Probability Checklist


