
Scalping in forex is like a sprint you need to move fast to catch small price changes. Finding the best indicators for scalping can turn quick trades into steady profits.
If you’ve ever felt the pressure of making a trading decision in mere seconds, you’ll understand why finding the best indicators for scalping forex isn’t just an advantage, it’s a necessity. They aren’t a magic compass, but rather tools that help us stay disciplined and make calculated decisions amid market chaos. This article compiles 12 tools that have helped me shape my strategy and survive in this high-speed trading environment.
Whether you’re a beginner or a pro, these indicators are easy to use and powerful. Ready to boost your trading? Let’s explore the best indicators for scalping forex and how they can work for you.
Key Takeaways
- Scalping is a fast-paced forex trading style that targets small profits using short timeframes like M1 or M5.
- Indicators are essential for detecting trends, gauging momentum, and pinpointing the best entry and exit points in rapidly moving markets.
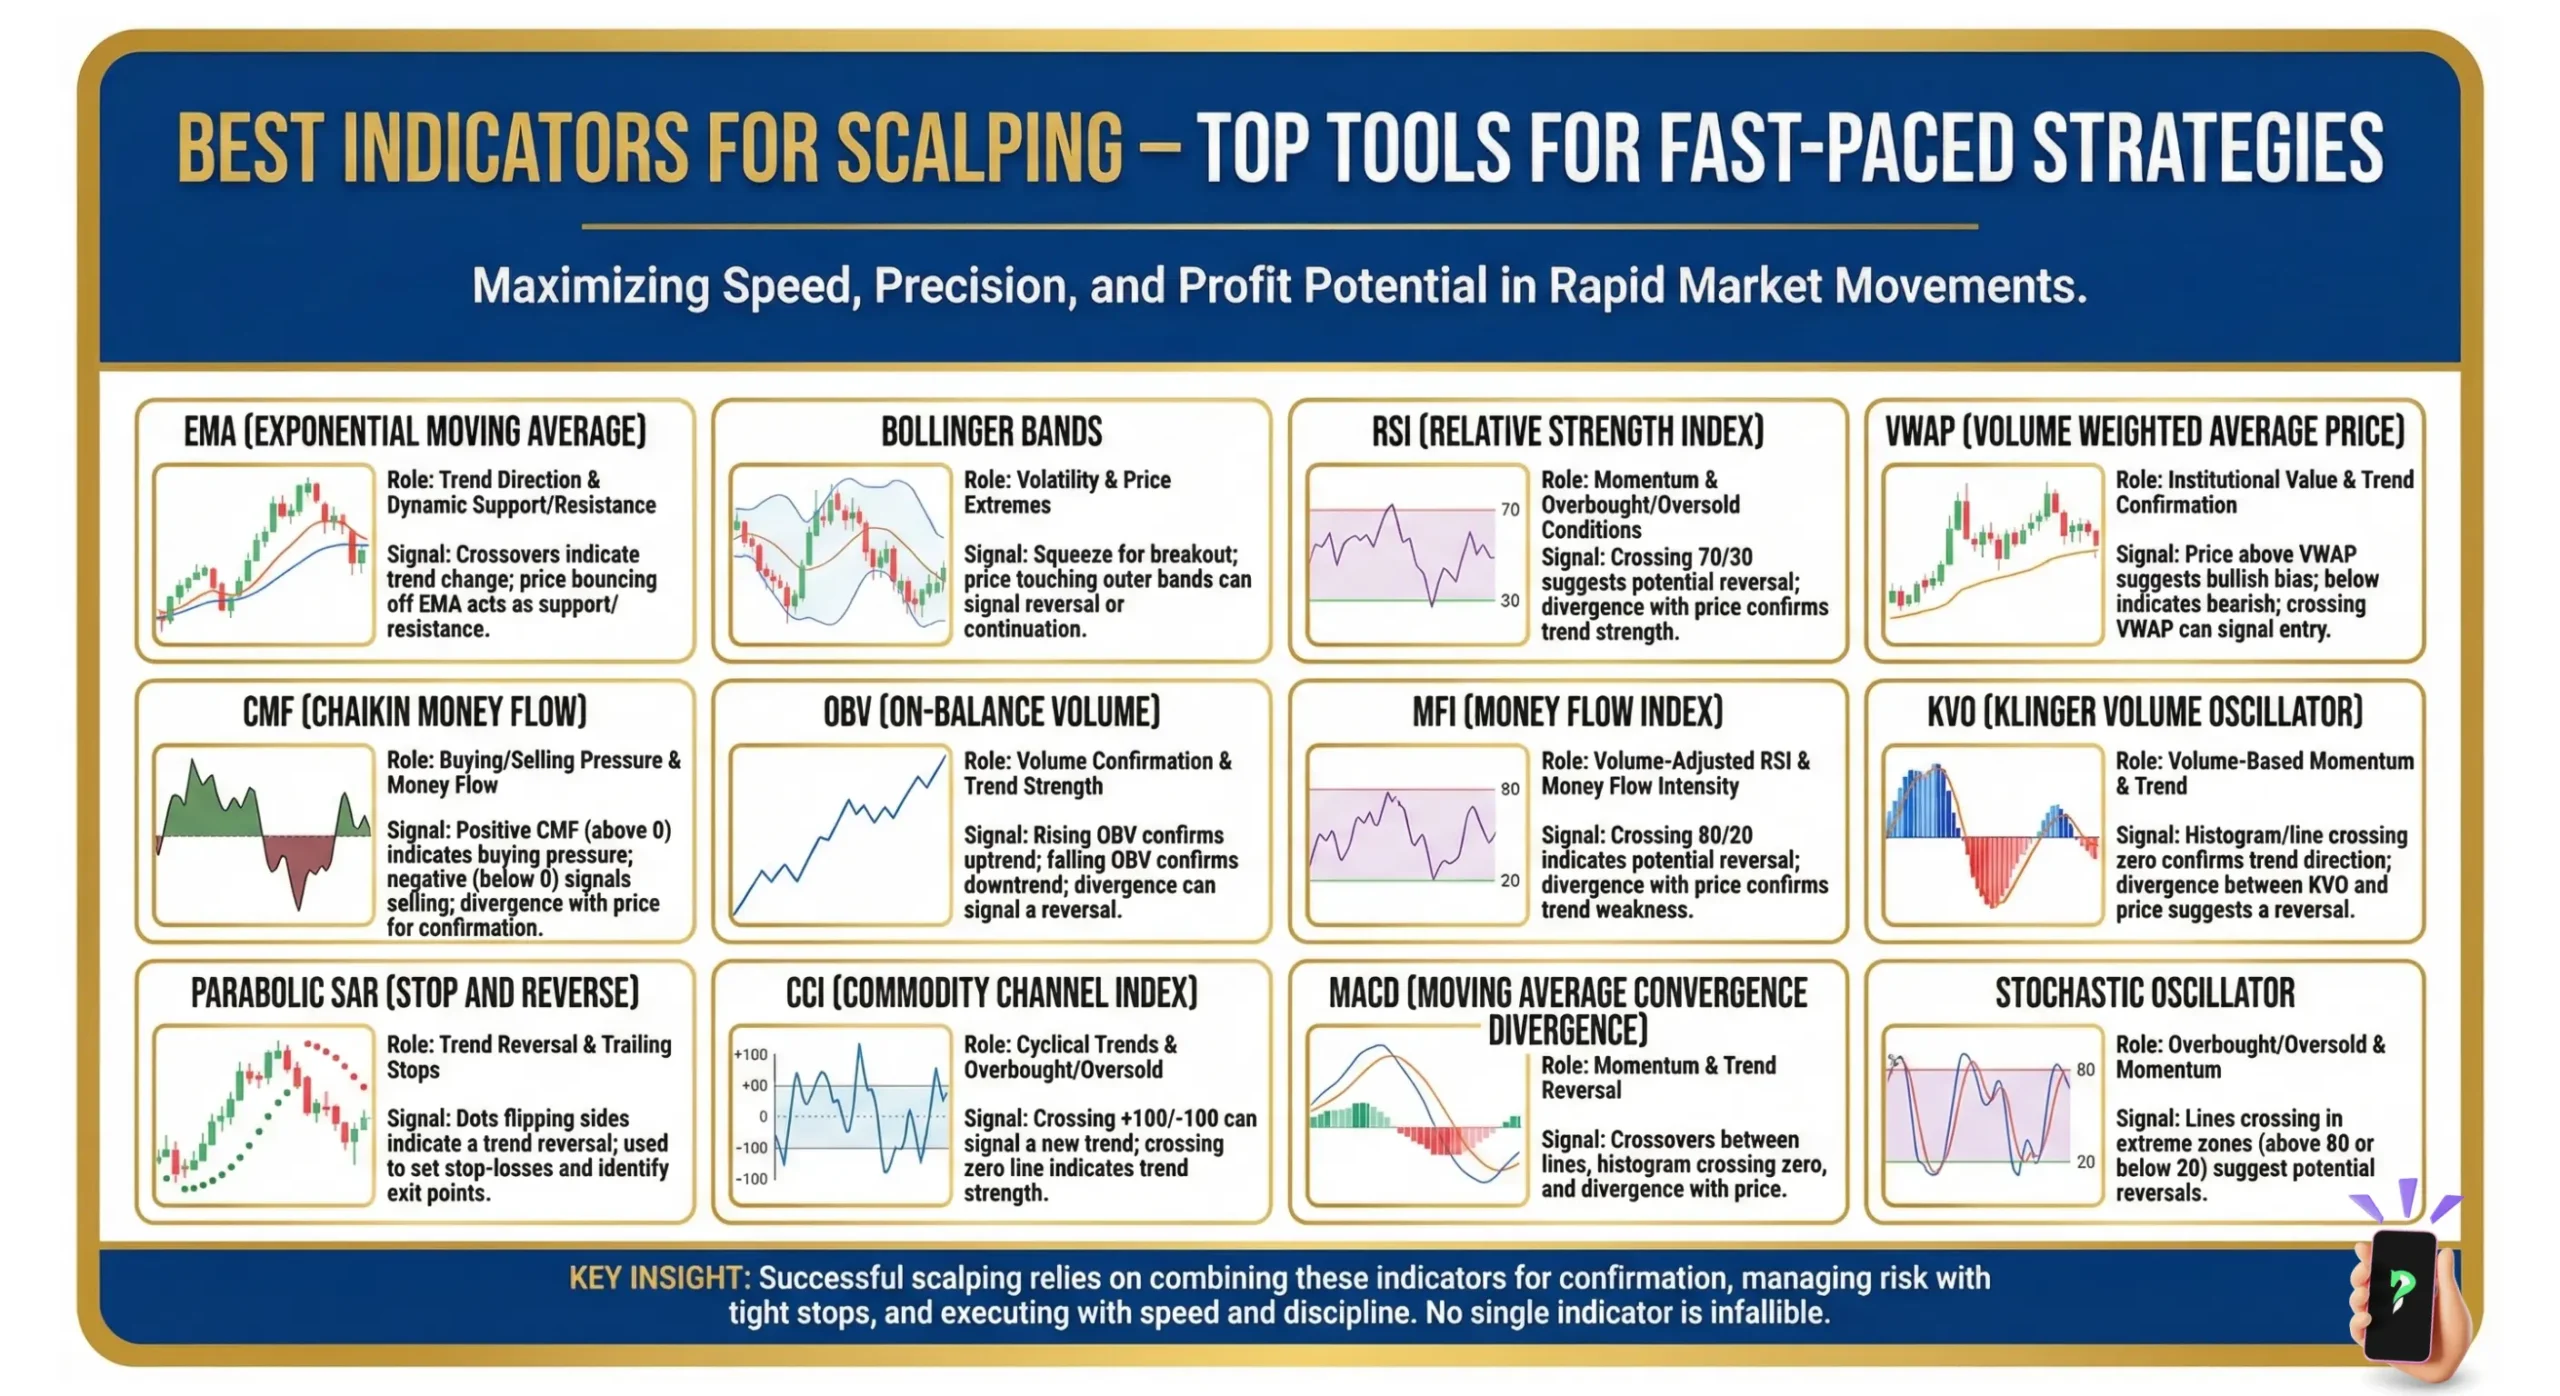
- The top 12 tools for scalping are: EMA, Bollinger Bands, RSI, VWAP, CMF, OBV, MFI, KVO, Parabolic SAR, CCI, MACD, and the Stochastic Oscillator.
- Combining trend, momentum, and volume indicators creates a winning strategy.
1. What is scalping in forex?
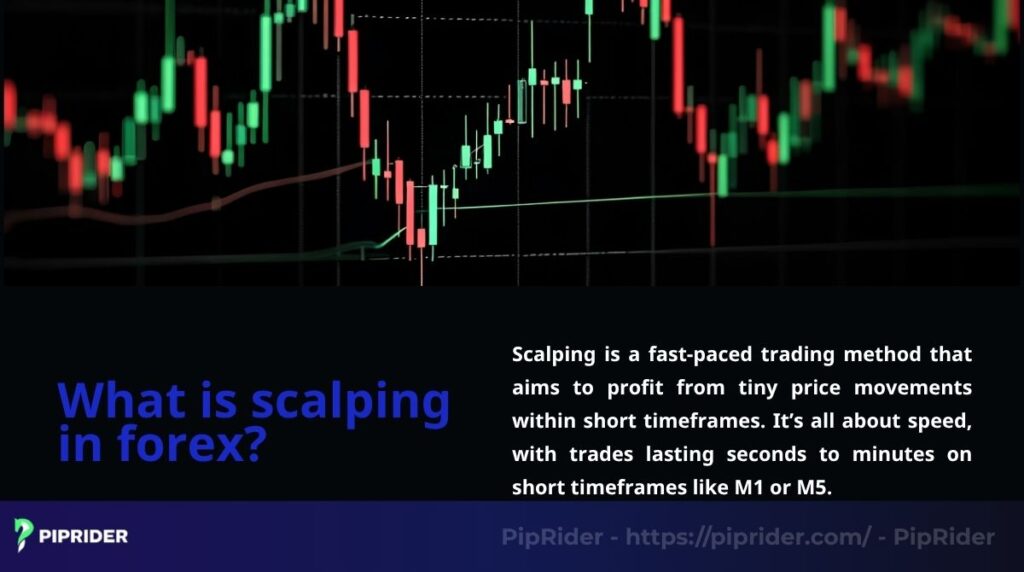
Scalping is a fast-paced trading method that aims to profit from tiny price movements within short timeframes. It’s all about speed, with trades lasting seconds to minutes on short timeframes like M1 or M5. I’ve found scalping thrilling but demanding, requiring sharp focus.
This strategy thrives in high-liquidity markets, like major forex pairs such as EUR/USD or GBP/USD. Low spreads and fast execution are key, so ECN accounts are often preferred. Scalping suits volatile markets where prices move quickly.
However, it comes with challenges. The emotional stress of constant monitoring can be intense. Spread costs add up fast with many trades. You also need quick decisions to avoid losses.
Scalping isn’t for everyone, but with the best indicators for scalping trading, you can navigate its demands.
2. The role of indicators in scalping success
Scalping is a high-speed game, and indicators are your trusty co-pilot. They help you make sense of the market’s chaos, guiding you to the best entry and exit points. One of the first lessons I learned was that scalping without indicators is like navigating in thick fog.
The best indicators for scalping strategy act as your lighthouse, preventing you from getting lost in random price noise and, more importantly, curbing emotional bias when everything happens so fast. Whether it’s spotting a price surge or a reversal, they keep you grounded.
There are different types—trend, momentum, volume, and channel-based. Each serves a purpose, like showing direction or confirming moves. Combining them is key to avoiding false signals.
The most effective indicators for scalping help streamline the trading process and enhance decision-making. Curious about which ones work best? Keep reading to discover tools that can transform your trades!
3. Best indicators for scalping: Top 12 picks for 2025
When it comes to scalping, the right tools can make or break your trades. The best indicators for scalping help you spot quick opportunities and act fast. Here are 12 top picks I’ve seen shine in fast-moving forex markets, each with clear signals for beginners and pros alike.
- These indicators are chosen for their reliability on short timeframes like M1-M5.
- Each works best when paired with others to confirm signals and avoid mistakes.
- Test them on a demo account to find what fits your trading style.
3.1. Exponential moving average (EMA)
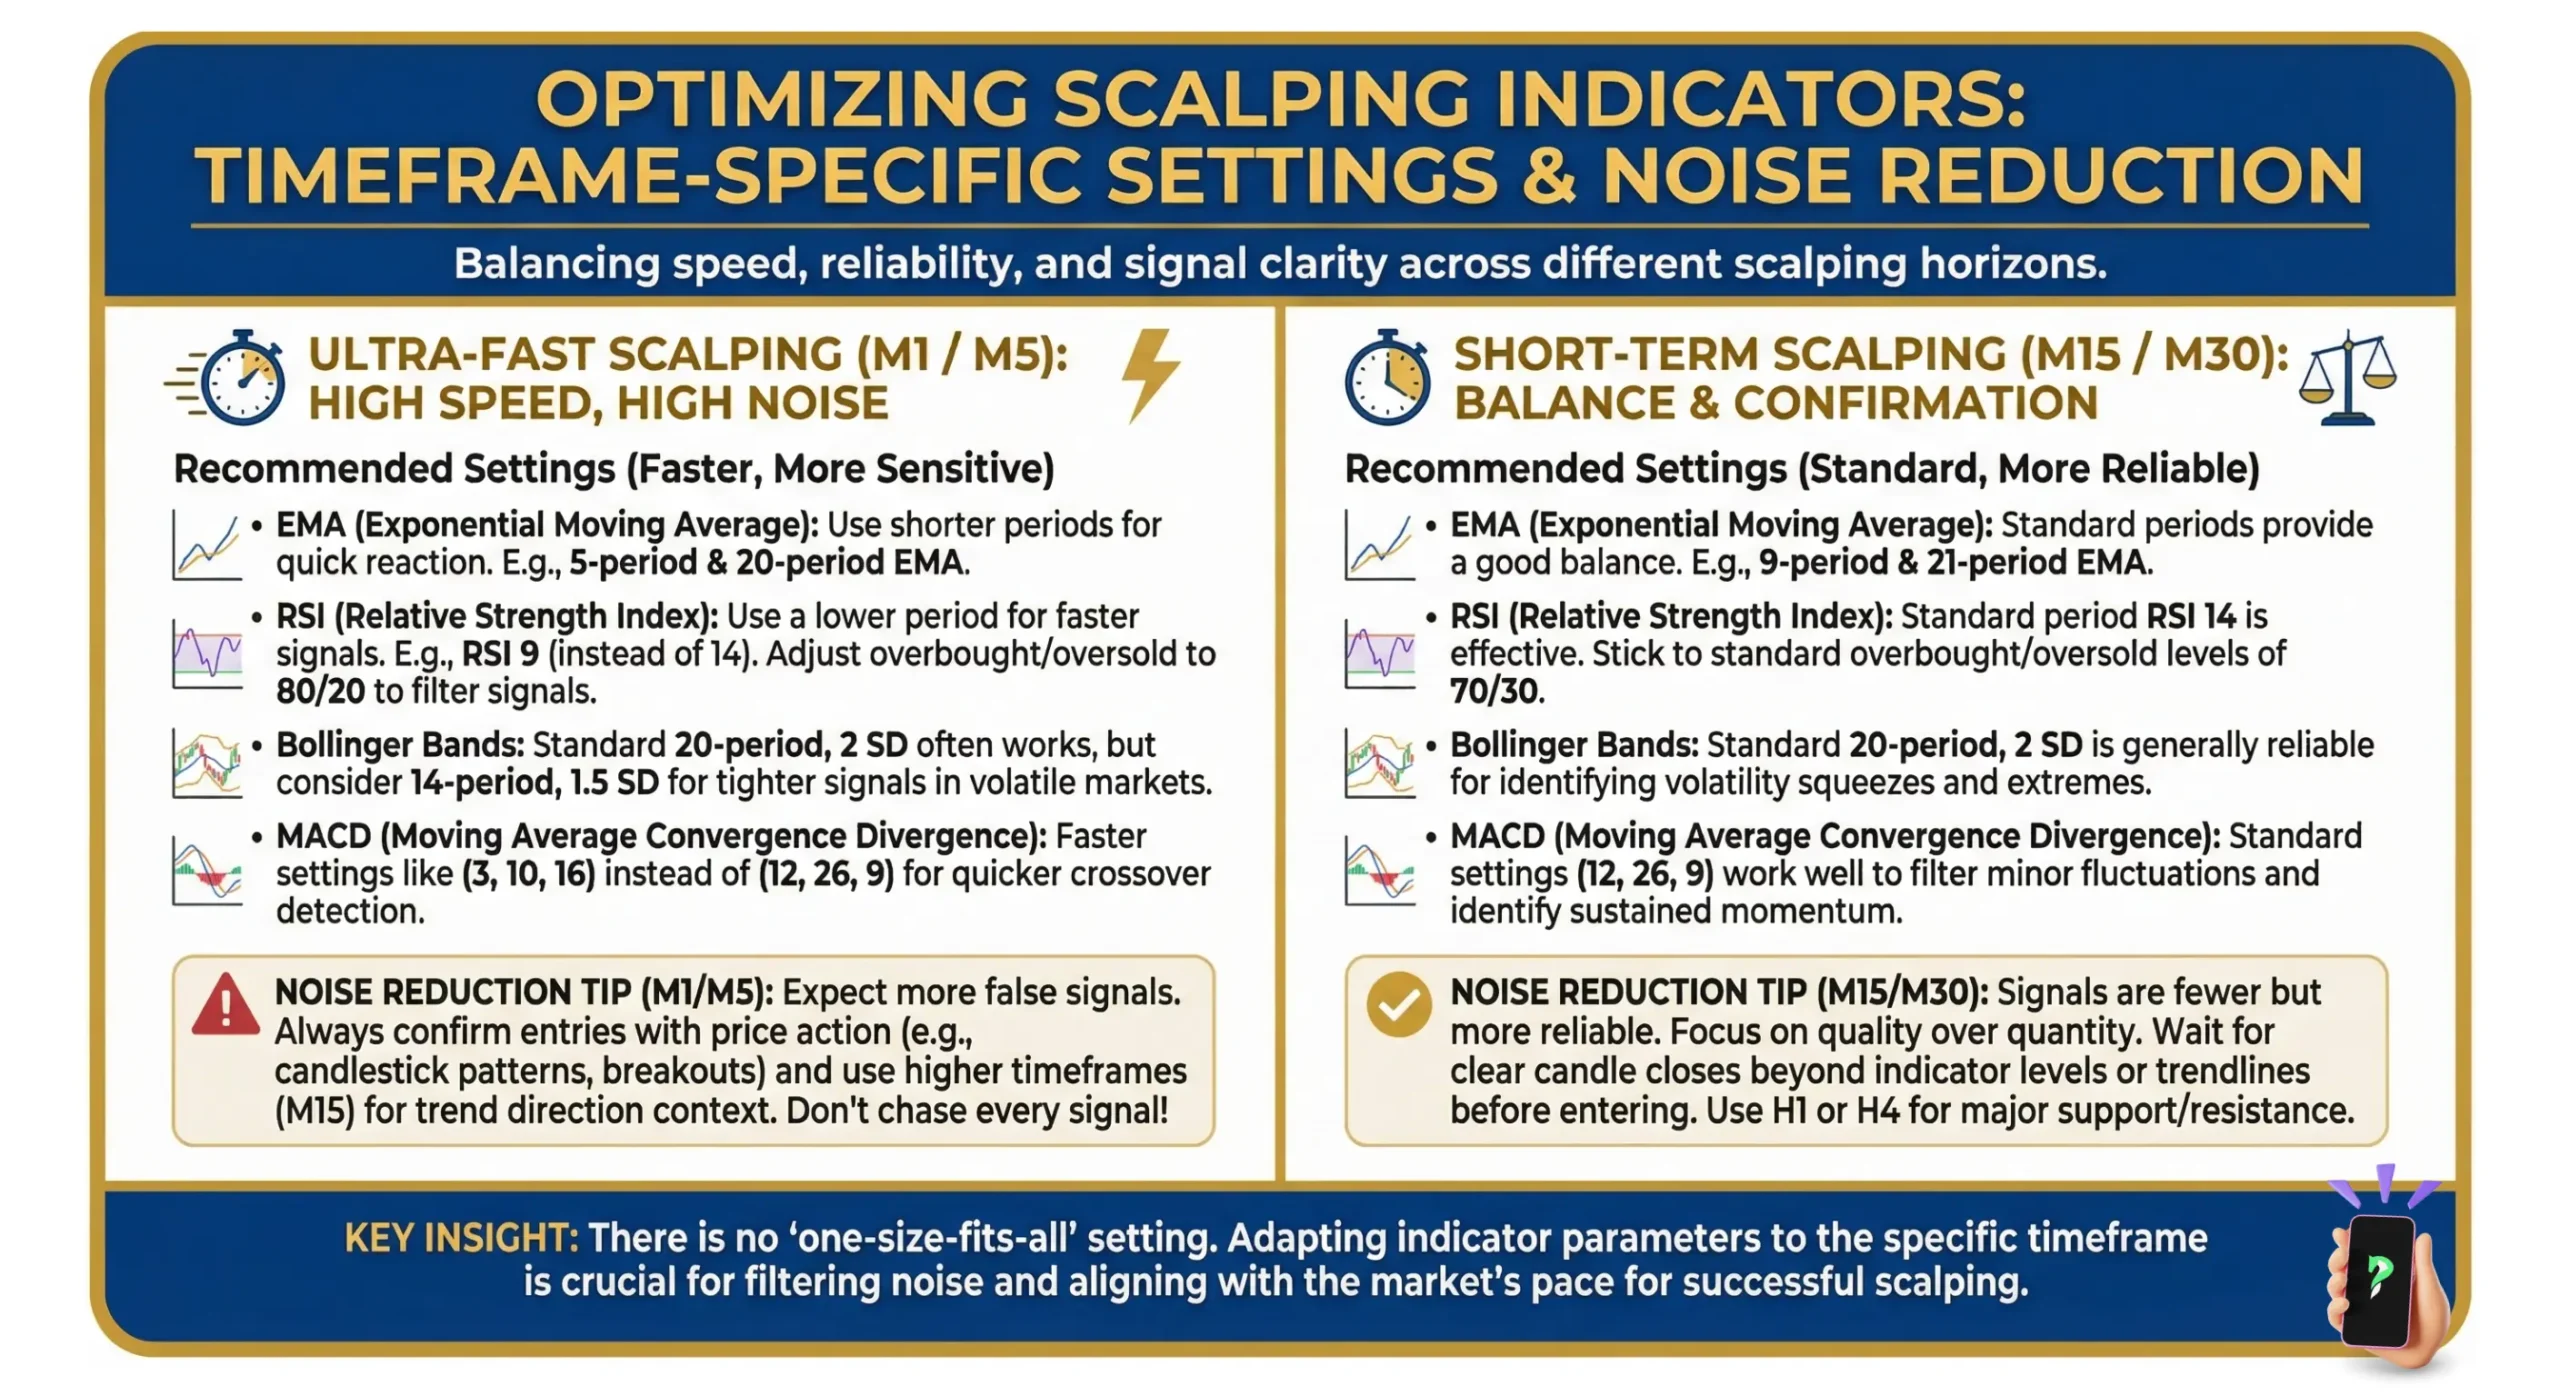
Scalpers often rely on the EMA as it emphasizes the most recent price movements. It’s great for spotting short-term trends on M1 or M5 charts. For me, short-term EMAs act as an effective noise filter. They help me focus on the main price direction for the next few minutes instead of getting distracted by every minor tick on the chart.
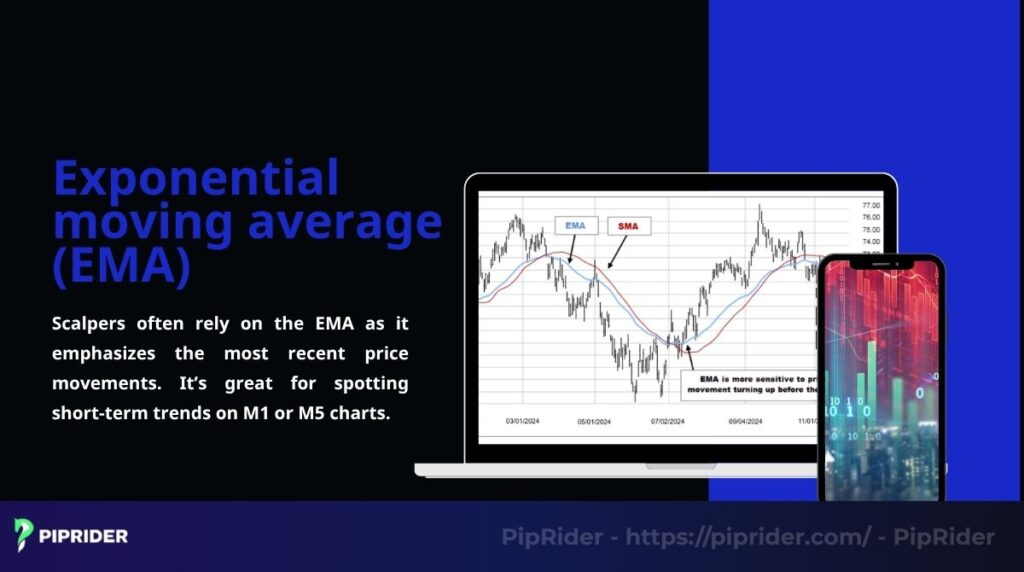
To truly master M1 to M5 charts, consider the powerful combination of the EMA(5) and EMA(9); for M15, the EMA(12) is your secret weapon. Feel the excitement of a buy signal when the price decisively breaks above the EMA, its upward trend a thrilling confirmation of momentum! Conversely, a sell signal emerges when the price drops below a downward-sloping EMA – a clear call to action.
To trade with unwavering confidence, supercharge your strategy by combining the EMA with indicators like the RSI or CCI, which will filter out false signals. For instance, on a GBP/USD 5-minute chart, an EMA crossover can signal a fantastic 7 to 10 pip move. Always use a tight stop-loss to manage risk and protect your hard-earned profits, making every trade a smart, calculated victory!
3.2. Bollinger bands
Bollinger Bands create an intuitive price channel, widening in volatile markets and narrowing when things are calm. In my experience, they are particularly useful for identifying potential reversals when the market isn’t strongly trending. A bounce off the lower band is often one of the more reliable signals the best indicators for scalping can offer.
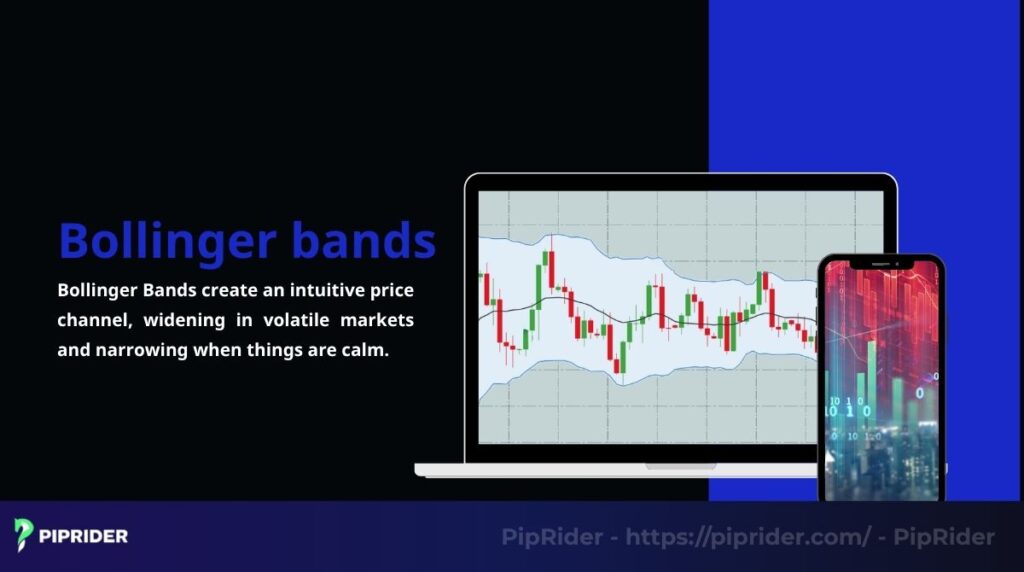
Configure them with a 20-period and 2 standard deviations on M5 charts. Look for buy opportunities when the price reaches the lower band and the RSI is below 20, indicating oversold conditions. Consider selling when the price touches the upper band and the RSI exceeds 80, signaling overbought levels.
Combine with OBV to confirm breakouts. On an EUR/USD chart, a touch of the lower band often leads to a quick bounce. Watch out for false signals during flat markets.
3.3. Relative strength index (RSI)
RSI is the tool I turn to in order to control that urge to ‘jump into the market too late’. Instead of chasing the price, I wait for RSI to confirm that momentum is overextended, giving me a more rational entry point. It’s an indispensable part of my toolkit for best indicators for scalping trading.
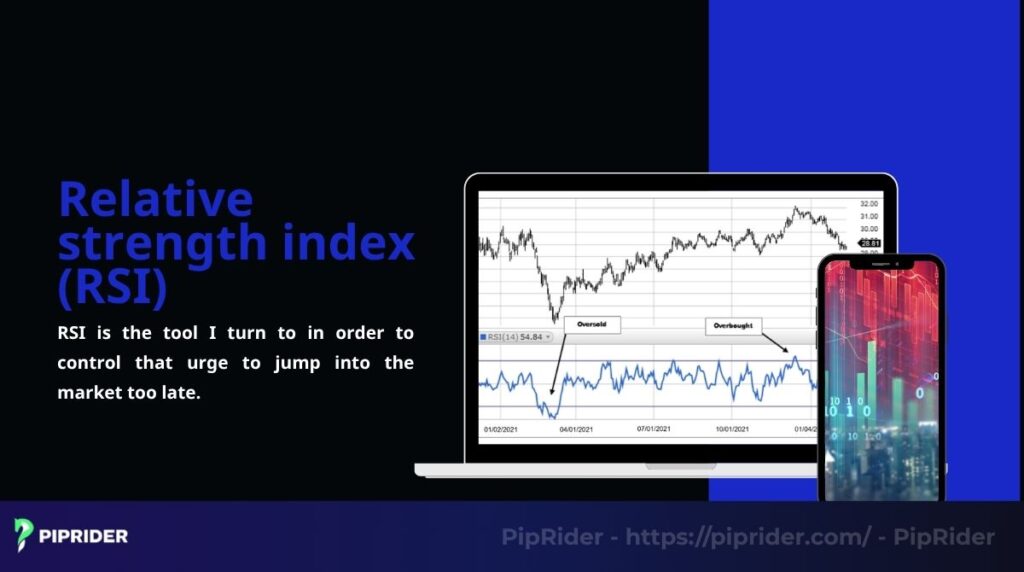
Set RSI to a period of 7 for M1-M5 charts to make it more sensitive. Buy when RSI exits the oversold zone (below 20) with rising prices. Sell when it leaves the overbought zone (above 80) with falling prices.
Pair it with Keltner channels for stronger signals. On a USD/JPY M5 chart, RSI often catches 5-7 pip reversals. Use tight stops to protect your trades.
3.4. Volume-weighted average price (VWAP)
VWAP shows the average price weighted by trading volume, acting as a fair-value benchmark. It’s great for intraday scalping forex trades. I often treat VWAP as the day’s “line in the sand” between buyers and sellers. Trading above the VWAP line makes me feel like I’m going with the market flow, while trading below it often serves as a warning sign to be cautious.
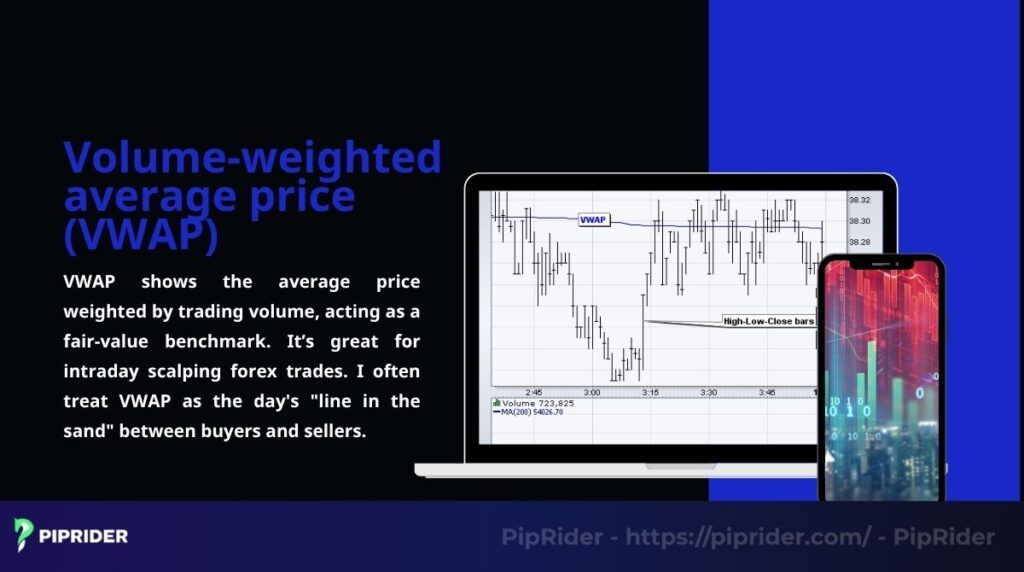
Use default settings on M5-M15 charts. Consider entering a long position when the price moves above the VWAP alongside increasing volume, and look to sell when it falls below the VWAP with high selling pressure.
Combine with CMF for better accuracy. VWAP crossovers on the AUD/USD chart frequently precede price movements of around 7 to 10 pips. Always check volume to avoid weak signals.
3.5. Chaikin money flow (CMF)
The Chaikin Money Flow (CMF) indicator gauges market pressure by analyzing both price action and trading volume. It’s a solid choice for scalpers looking for quick insights. For me, CMF is like a tool to check if the “smart money” is backing my decision. A buy signal becomes much more reliable when CMF confirms that buying pressure is genuinely building up.
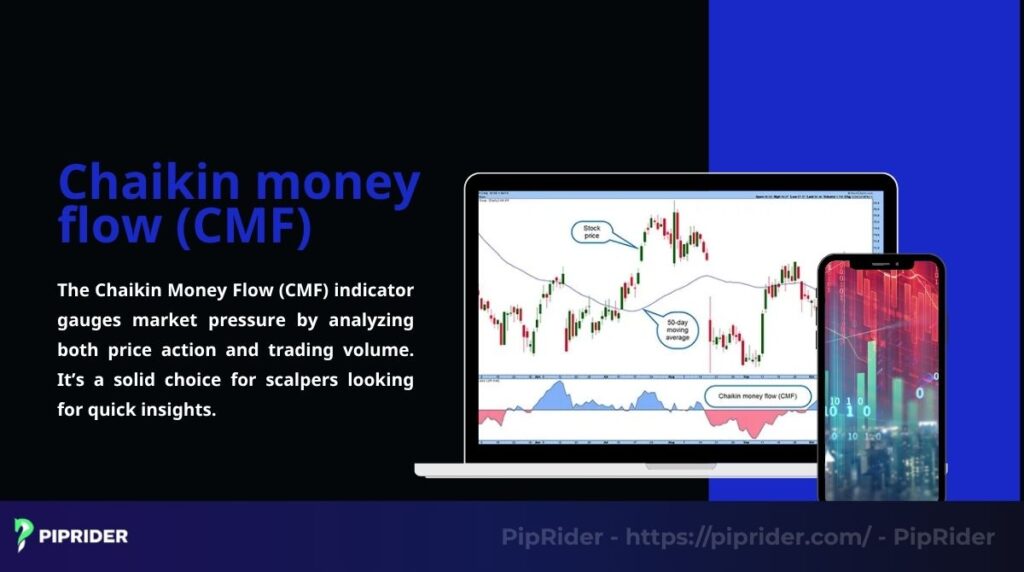
Use CMF on M1-M3 charts. Buy when CMF crosses above +0.05 with rising volume. Sell when it drops below -0.05 with selling pressure.
Pair with KVO to confirm momentum. On an EUR/GBP M3 chart, CMF signals often lead to 5-8 pip gains. Set stops just beyond support or resistance.
3.6. On-balance volume (OBV)
On-Balance Volume (OBV) monitors volume shifts to help identify whether buying or selling pressure is dominating. It’s great for confirming breakouts in scalping. I see OBV as a confirmation tool to avoid “false breakouts.” If the price breaks a resistance level but OBV doesn’t rise accordingly, it’s a red flag for me that the move lacks “fuel” and could soon fail.

Use default settings on M1-M5 charts. Enter a buy trade when OBV is climbing and the price breaks above a resistance level. Consider selling when OBV declines and the price drops below support.
Combine OBV with VWAP to enhance signal reliability. On the USD/CAD chart, an increasing OBV often anticipates a swift price rise. Keep an eye on divergences to minimize the risk of false signals.
3.7. Money flow index (MFI)
The Money Flow Index (MFI) integrates both price and volume data to identify potential overbought or oversold market conditions. It’s like RSI but with a volume twist, perfect for scalping. I prefer MFI over RSI because it adds the volume component, helping to distinguish between a strong price spike and a weak one.

When the MFI shows overbought conditions, it’s a powerful whisper from the market, telling you it’s not just about a high price, but about the buying volume finally giving up – a truly reliable signal for an exciting reversal!
For M5 (5-minute) charts, dial in the perfect 7-period setting. Feel the surge of confidence to buy when the MFI triumphantly drops below 20, backed by a wave of rising volume. And seize the moment to sell when it boldly climbs above 80, confirmed by strong selling volume.
For an extra layer of certainty, supercharge your analysis by pairing it with Bollinger Bands. I’ve personally watched this dynamic duo on the NZD/USD chart nail impressive 6-9 pip moves. Always use tight stops to lock in your profits and trade like a true pro!
3.8. Klinger volume oscillator (KVO)
KVO compares short- and long-term volume trends to spot momentum shifts. I see the KVO as my window into understanding market momentum. Sometimes, the KVO will cross over and signal a shift in money flow even before the price makes a strong reversal, giving me a timing advantage that other indicators might not offer.
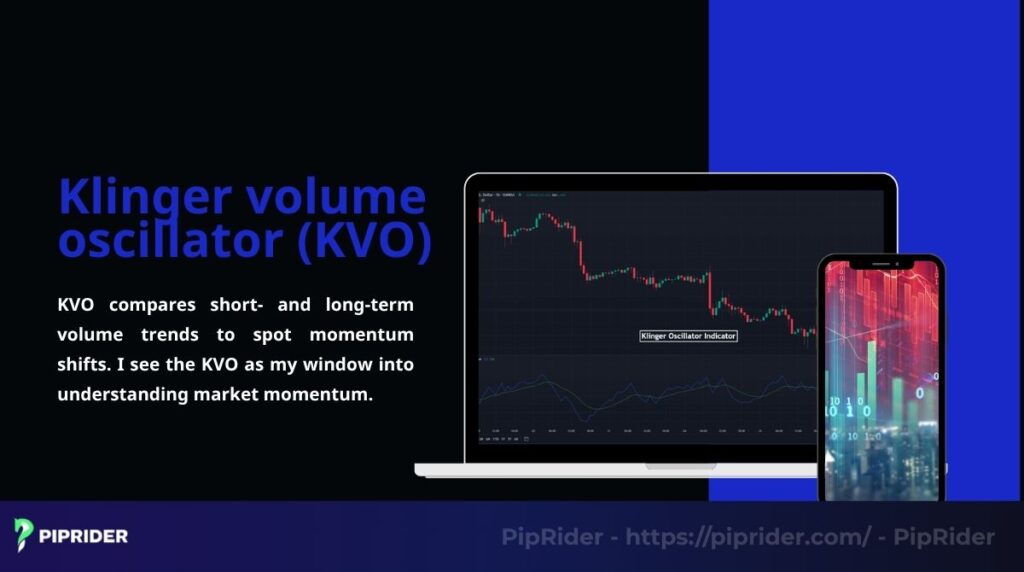
Use default settings on M1-M5 charts. Buy when the short-term MA crosses above the long-term MA. Sell when it crosses below.
Combine with EMA for trend confirmation. On a GBP/JPY chart, KVO signals often lead to 7-10 pip gains. Check volume spikes for stronger signals.
3.9. Parabolic SAR
The Parabolic SAR displays dots that indicate the direction of the trend and potential reversals. It’s a straightforward and reliable tool, especially useful for scalping. Beyond signaling trades, the Parabolic SAR helps traders stay disciplined, when the dots switch from below to above the price, it signals more than just a sell; it serves as a clear cue that the uptrend has ended and it’s wise to close the position to safeguard gains.
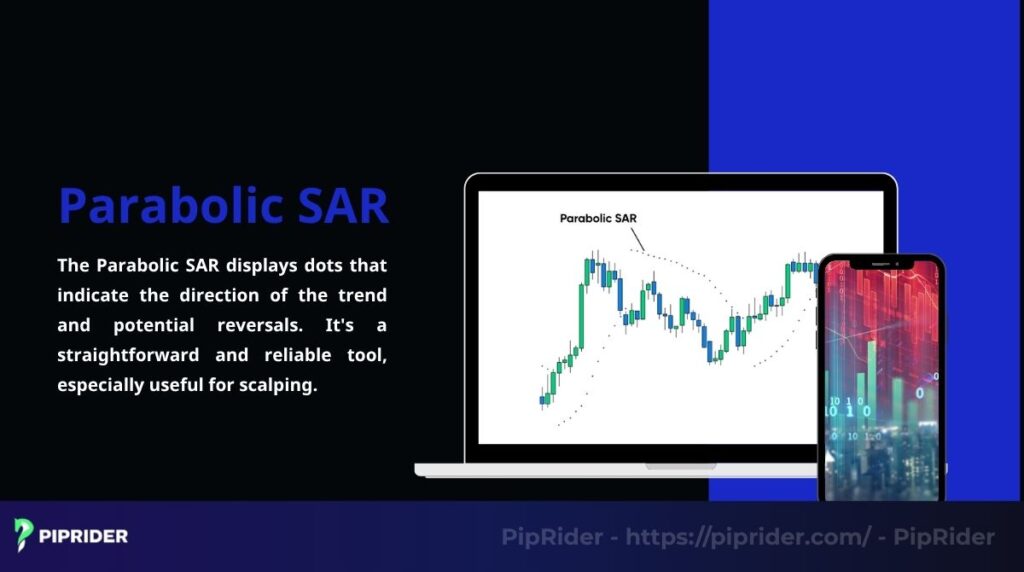
To capture the essence of a trend, apply the Parabolic SAR’s default settings on your M5 charts. Feel the exhilarating confidence when you see the dots shift below the price, a crystal-clear signal to buy and ride the momentum! The moment those dots move above, it’s a decisive cue to sell and lock in your profits before the trend reverses.
For a powerful double-check, pair this with the RSI to filter out any false alarms and execute your trades with absolute certainty. I’ve seen firsthand how this dynamic duo on the EUR/CHF chart can consistently lead to sharp 5-7 pip moves. Always set tight stops to protect your capital, ensuring every trade is a calculated, winning move!
3.10. Commodity channel index (CCI)
CCI measures how far the price deviates from its average, signaling reversals. I visualize the CCI as a rubber band. When the indicator stretches beyond the +/-100 levels, it shows that the price has been “stretched” too far from its average. That’s when I start looking for a trade as this “rubber band” is likely to snap back.
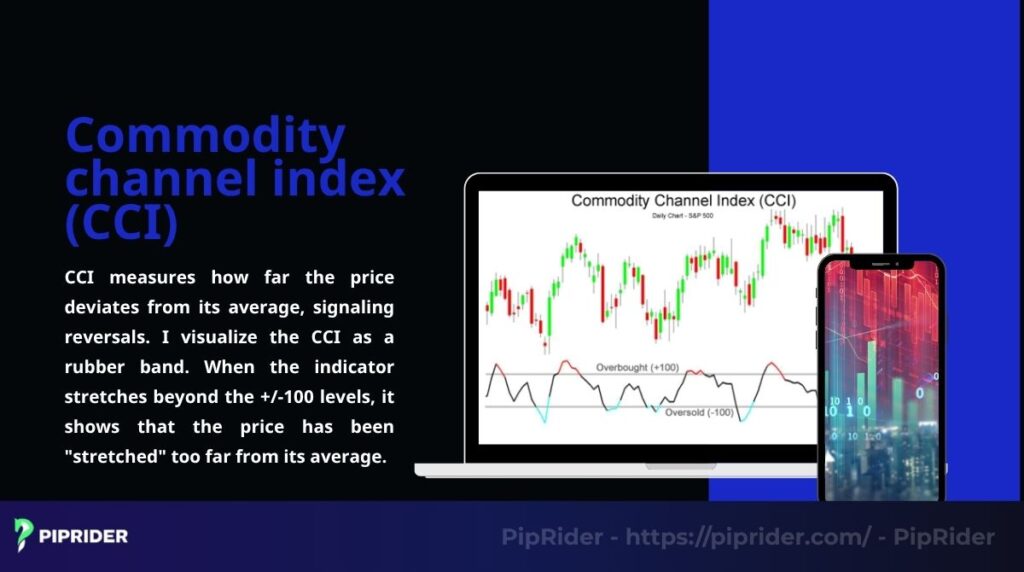
Set CCI to a period of 14 on M5 charts. Buy when CCI crosses above -100. Sell when it crosses below +100.
Pair with support/resistance levels. On a USD/CHF chart, CCI signals often yield 6-9 pip profits. Use chart patterns to confirm entries.
3.11. Moving average convergence divergence (MACD)
MACD tracks the relationship between two EMAs to show trend and momentum. It’s a versatile scalping tool. A MACD crossover on the M5 chart isn’t just a Buy signal for me; it’s a confirmation that “momentum” is building, giving me the confidence needed to enter the trade when hunting for short-term surges.
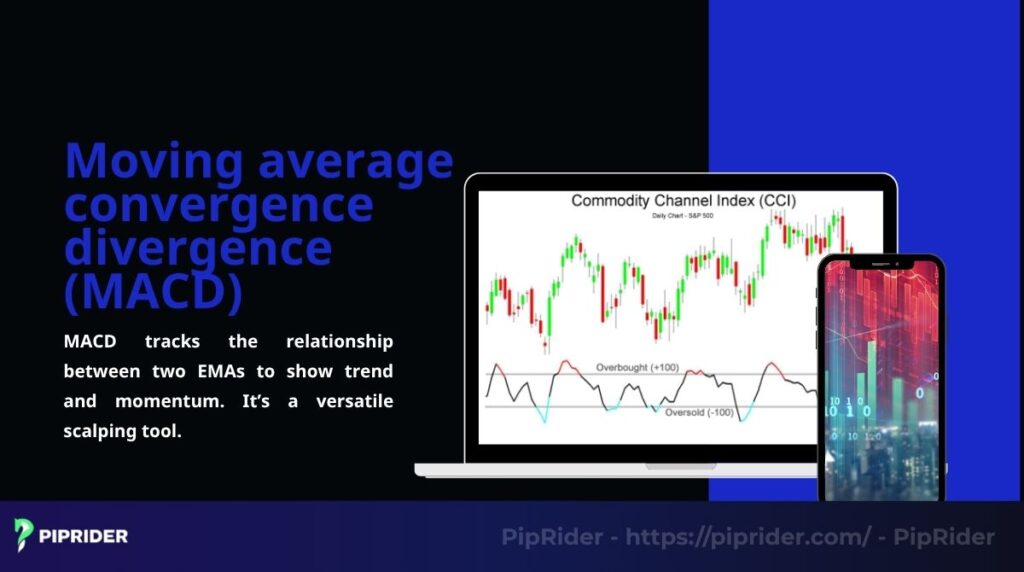
To conquer the fast-paced M1-M5 charts, fine-tune your MACD settings to a razor-sharp (5, 13, 3) to cut through the lag! Imagine the thrill of catching a perfect entry: a buy signal appears when the MACD line heroically crosses above the signal line, confirmed by an RSI soaring above 50, signaling unstoppable momentum. Feel the confidence build as you spot a sell opportunity when the MACD line dives below the signal line, with RSI’s descent below 50 validating the move.
For an unbeatable edge, turbocharge this strategy by pairing it with Bollinger Bands to confirm trend strength of a power duo! I’ve personally seen this magic on the EUR/USD chart, where MACD crossovers frequently signal juicy 7-10 pip moves. With tight stops in place, you’re not just trading; you’re executing a masterful plan for quick, exhilarating profits!
3.12. Stochastic oscillator
The Stochastic oscillator flags overbought and oversold conditions with momentum shifts. It’s a scalper’s friend for quick trades. In choppy markets where trend-following indicators become useless, the Stochastic oscillator shines. It helps me identify “buy the dip, sell the rip” opportunities within a tight range, a core strategy when the market lacks clear direction.
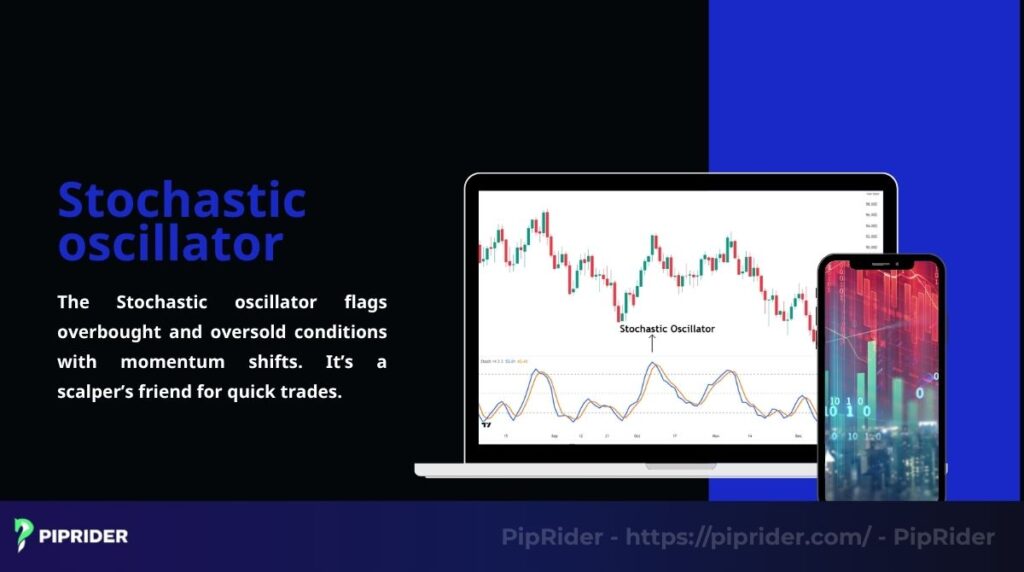
To dominate 1- to 5-minute charts, configure your Stochastic Oscillator with the powerful (5, 3, 3) settings. Feel the thrill of a buy signal as the lines cross upwards in the oversold zone (below 20), a perfect opportunity to jump in with confidence!
And when it’s time to take profits, open a sell position as the lines passionately cross downwards in the overbought zone (above 80), a clear sign the momentum is shifting.
For an unshakeable edge, pair this powerhouse with the EMA or VWAP to filter out false alarms and trade with unwavering certainty. I’ve personally seen this strategy work wonders on the GBP/USD chart, where Stochastic signals frequently lead to sweet 5-8 pip moves. Always use tight stops to protect your gains and trade like a true master!
Comparison table:
| Indicator | Timeframe | Key signals | Best paired with |
| EMA | M1-M5 | Price crosses EMA | RSI, CCI |
| Bollinger bands | M5 | Price touches bands | OBV, RSI |
| RSI | M1-M5 | Overbought/oversold exits | Keltner channels |
| VWAP | M5-M15 | Price crosses VWAP | CMF, OBV |
| CMF | M1-M3 | Crosses ±0.05 | KVO |
| OBV | M1-M5 | Rising/falling with breakouts | VWAP |
| MFI | M5 | Overbought/oversold with volume | Bollinger bands |
| KVO | M1-M5 | MA crossovers | EMA |
| Parabolic SAR | M5 | Dots shift position | RSI |
| CCI | M5 | Crosses ±100 | Support/resistance |
| MACD | M1-M5 | Line crosses signal | Bollinger bands |
| Stochastic | M1-M5 | Overbought/oversold crosses | EMA, VWAP |
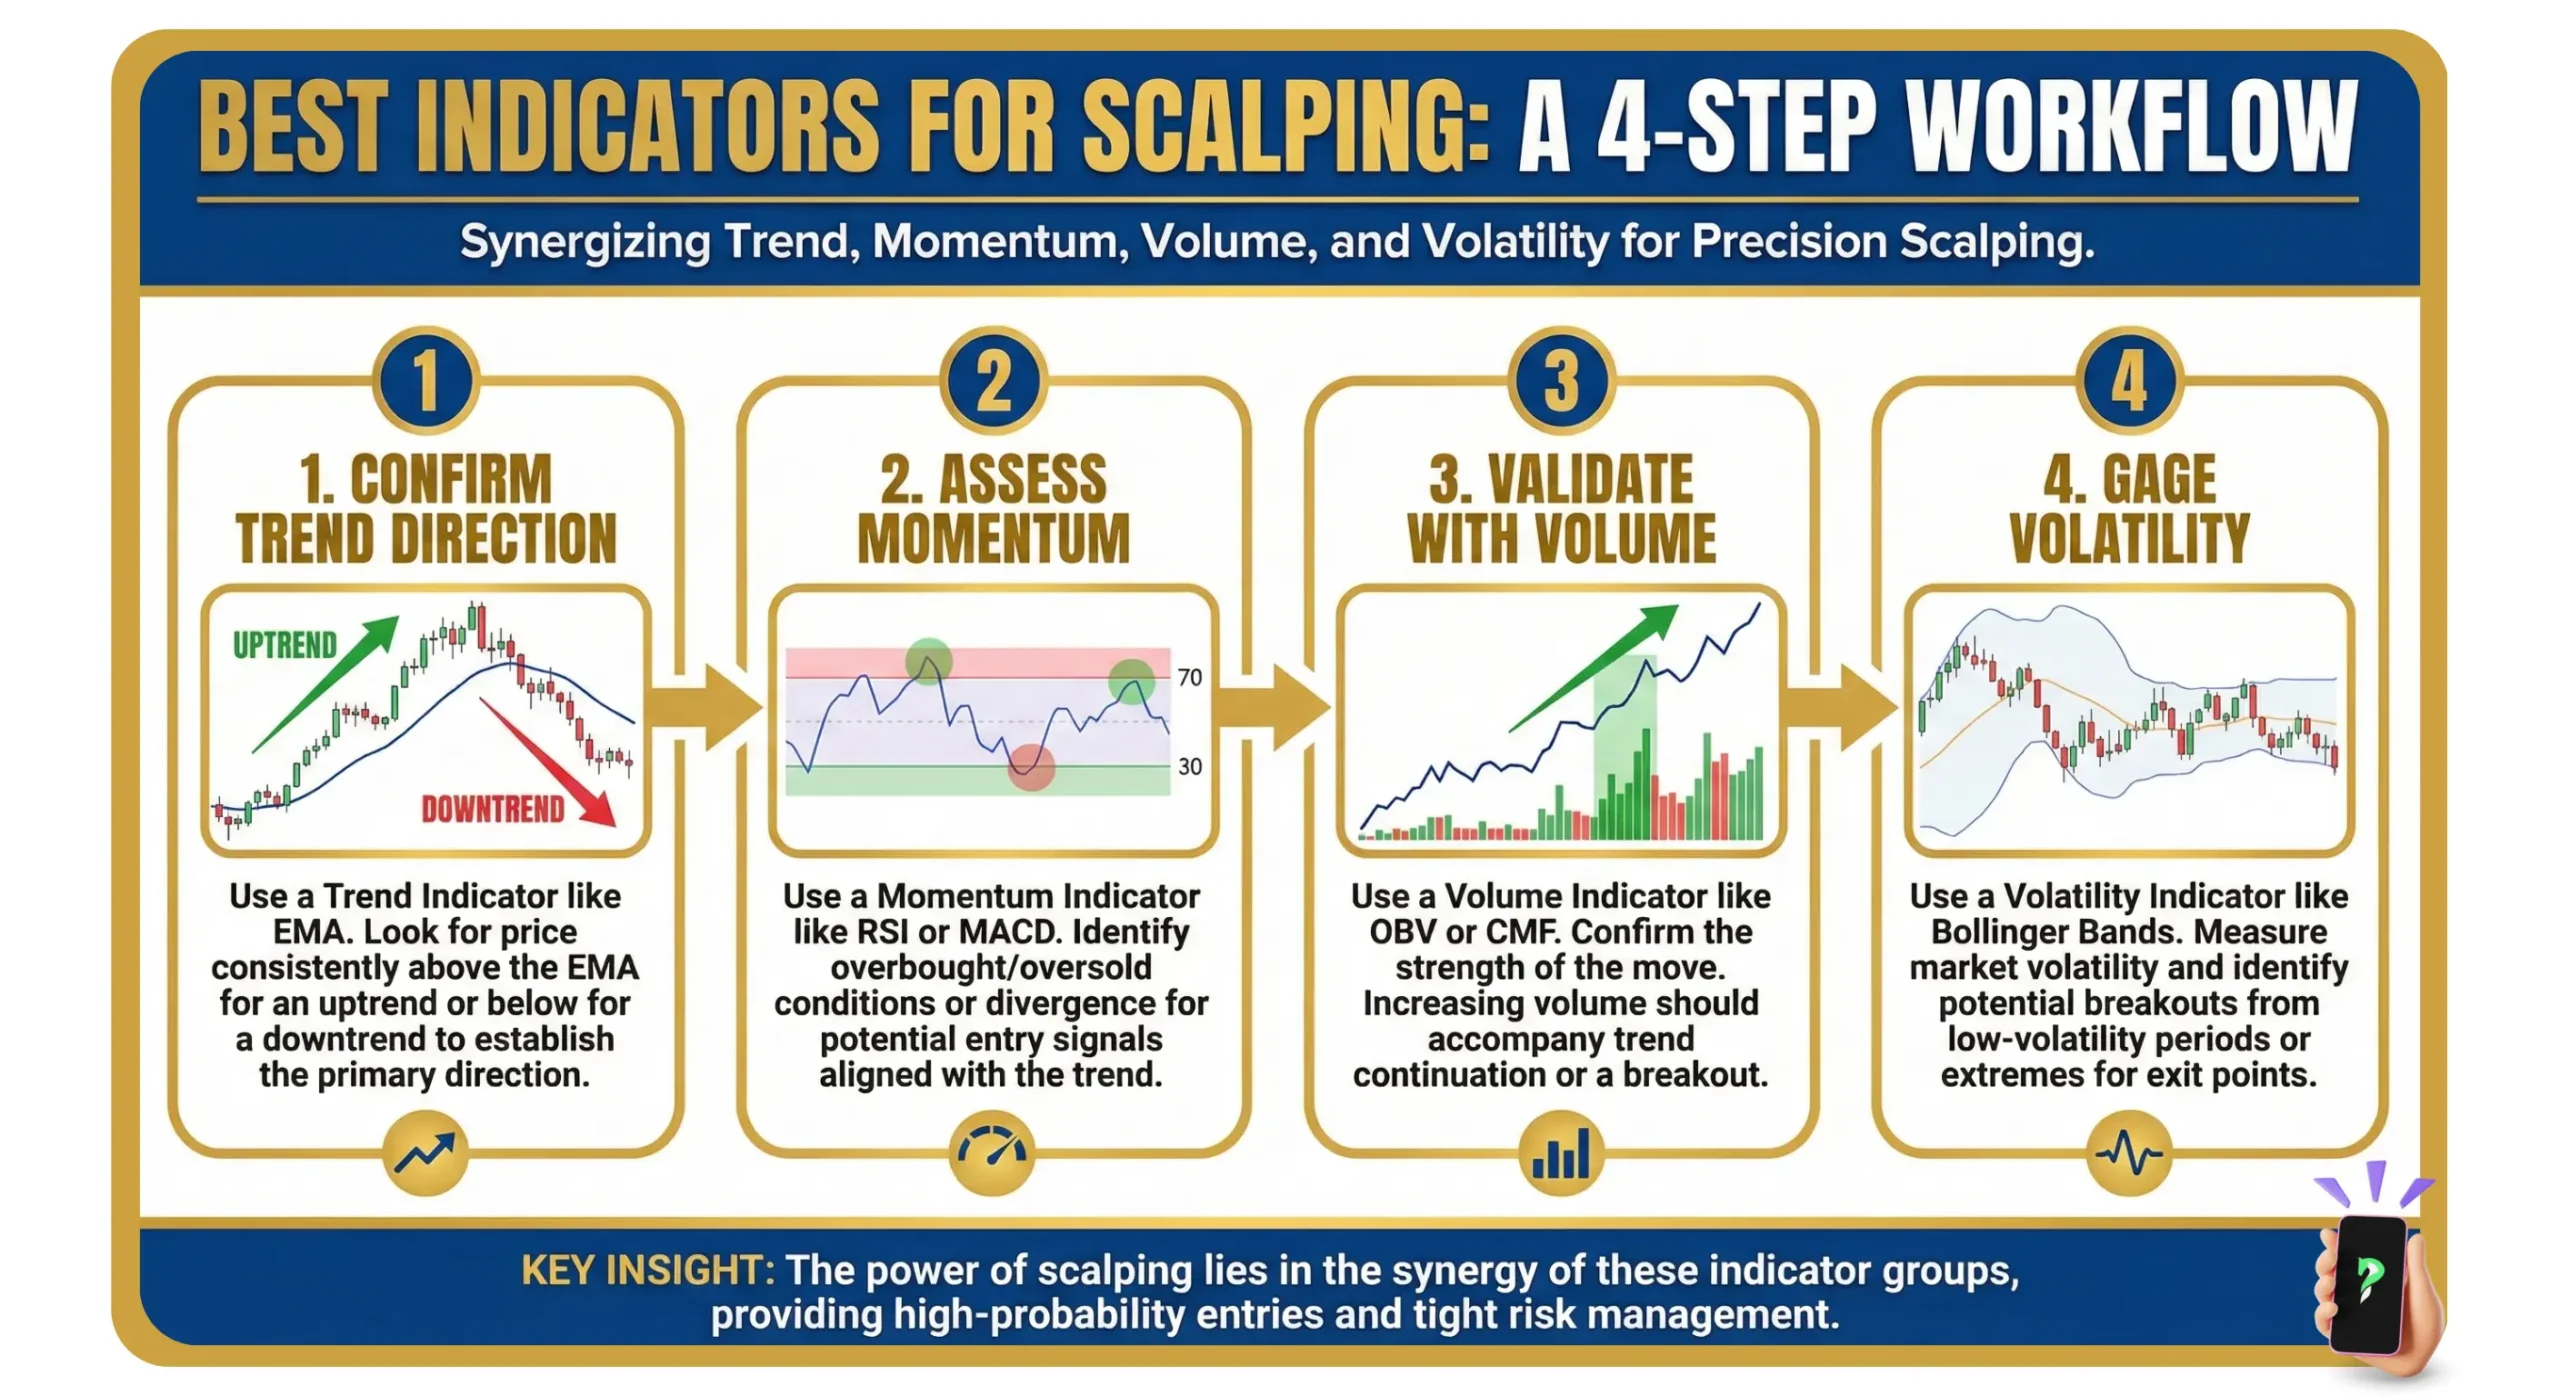
4. Building a winning scalping strategy with indicators
Scalping is all about precision, and combining indicators can give you an edge. The best indicators for scalping work better together, helping you spot high-probability trades. I’ve learned that a solid strategy keeps you calm in the heat of fast markets.
An effective strategy combines a trend indicator, an oscillator, and a volume indicator. For instance, using EMA(5), RSI(7), and VWAP on a 5-minute chart helps identify trends, confirm momentum, and support price moves with volume data.
Here’s how to do it:
- Step 1: Use EMA to check the trend direction – up or down.
- Step 2: Wait for RSI to confirm entry, like exiting oversold for a buy.
- Step 3: Check VWAP or OBV to ensure volume supports the move.
Managing risk is essential. Place stop-loss orders 1 to 2 pips beyond key support or resistance levels. This approach has helped me avoid losing trades, particularly in volatile market conditions.
5. Practical tips for scalping success
Scalping is a fast game, and small tweaks can boost your results. Using the best indicators for scalping trading is a start, but how you apply them matters just as much. Here are some tips I’ve picked up to trade smarter.
- Test indicators on a demo account first: It’s a safe way to see how they work without risking money.
- Stick to short timeframes like M1-M5: But check M15 or H1 charts to confirm the bigger trend.
- Trade high-liquidity pairs: Pairs like EUR/USD or USD/JPY have tight spreads, saving you on costs.
- Avoid low-volume times: The Asian session often moves slowly, leading to false signals.
- Automate signals with platforms: Tools like MT4 or TradingView can alert you to trade setups.
6. Pitfalls to watch out for
Scalping can be rewarding, but it’s easy to stumble if you’re not careful. Even with the best indicators for scalping, mistakes can hurt your profits. Here are some traps I’ve learned to avoid in my trading journey.
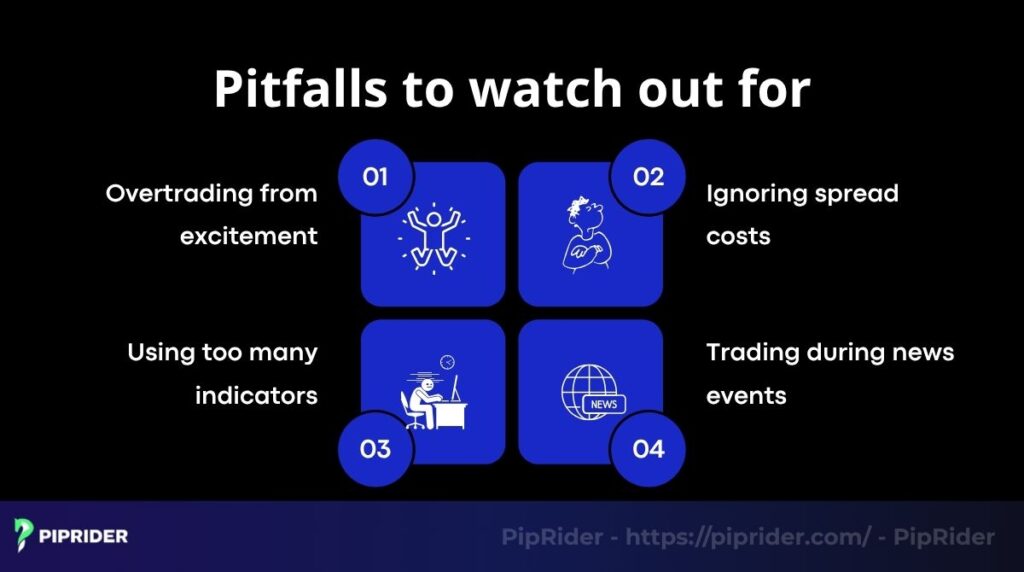
- Overtrading from excitement: Chasing every signal leads to burnout and losses.
- Ignoring spread costs: High spreads on exotic pairs eat into your small gains.
- Using too many indicators: Too much data causes confusion and missed trades.
- Trading during news events: Big price swings can wipe out your stops.
Early on, one of my biggest errors was relying too heavily on every signal from the indicators without question. I learned that even the best indicators for scalping are just tools. A clear trading plan, which includes risk management and understanding the market context, is what ultimately determines success.
7. Frequently asked questions about scalping
New traders often have questions about scalping indicators, and how to use them right. Here are answers to common queries to clear up confusion. These insights come from my time figuring out what works in fast-paced forex.
8. Conclusion
Scalping is a high-energy way to trade, and the best indicators for scalping make it easier to catch quick profits. Tools like EMA, RSI, VWAP, and nine others we’ve covered can guide your trades with precision. I’ve seen how combining them with a solid plan boosts results.
Success comes from practice, discipline, and smart risk management. Test these indicators on a demo account to find what works for you. Scalping is tough but rewarding with the right approach.
Explore more in our “best technical indicators” and “For Beginner” categories on the blog Pip Rider.
Infographic Section
-
Best Indicators for Scalping -
A 4-Step Workfilow -
Optimizing Scalping Indicators


