
Scalping in forex is a high-frequency trading style that requires rapid execution to capture small price movements. To navigate these fast-moving markets effectively, finding the best indicators for scalping is a necessity rather than an advantage. These tools help traders maintain discipline and make objective decisions amid market volatility.
This guide analyzes 12 essential tools for a high-speed trading environment. Whether you are a beginner or an experienced trader, these indicators can help refine your entries and exits on short timeframes.
Key Takeaways
- Definition: Scalping focuses on small profits from brief trades, typically on M1 (1-minute) or M5 (5-minute) charts.
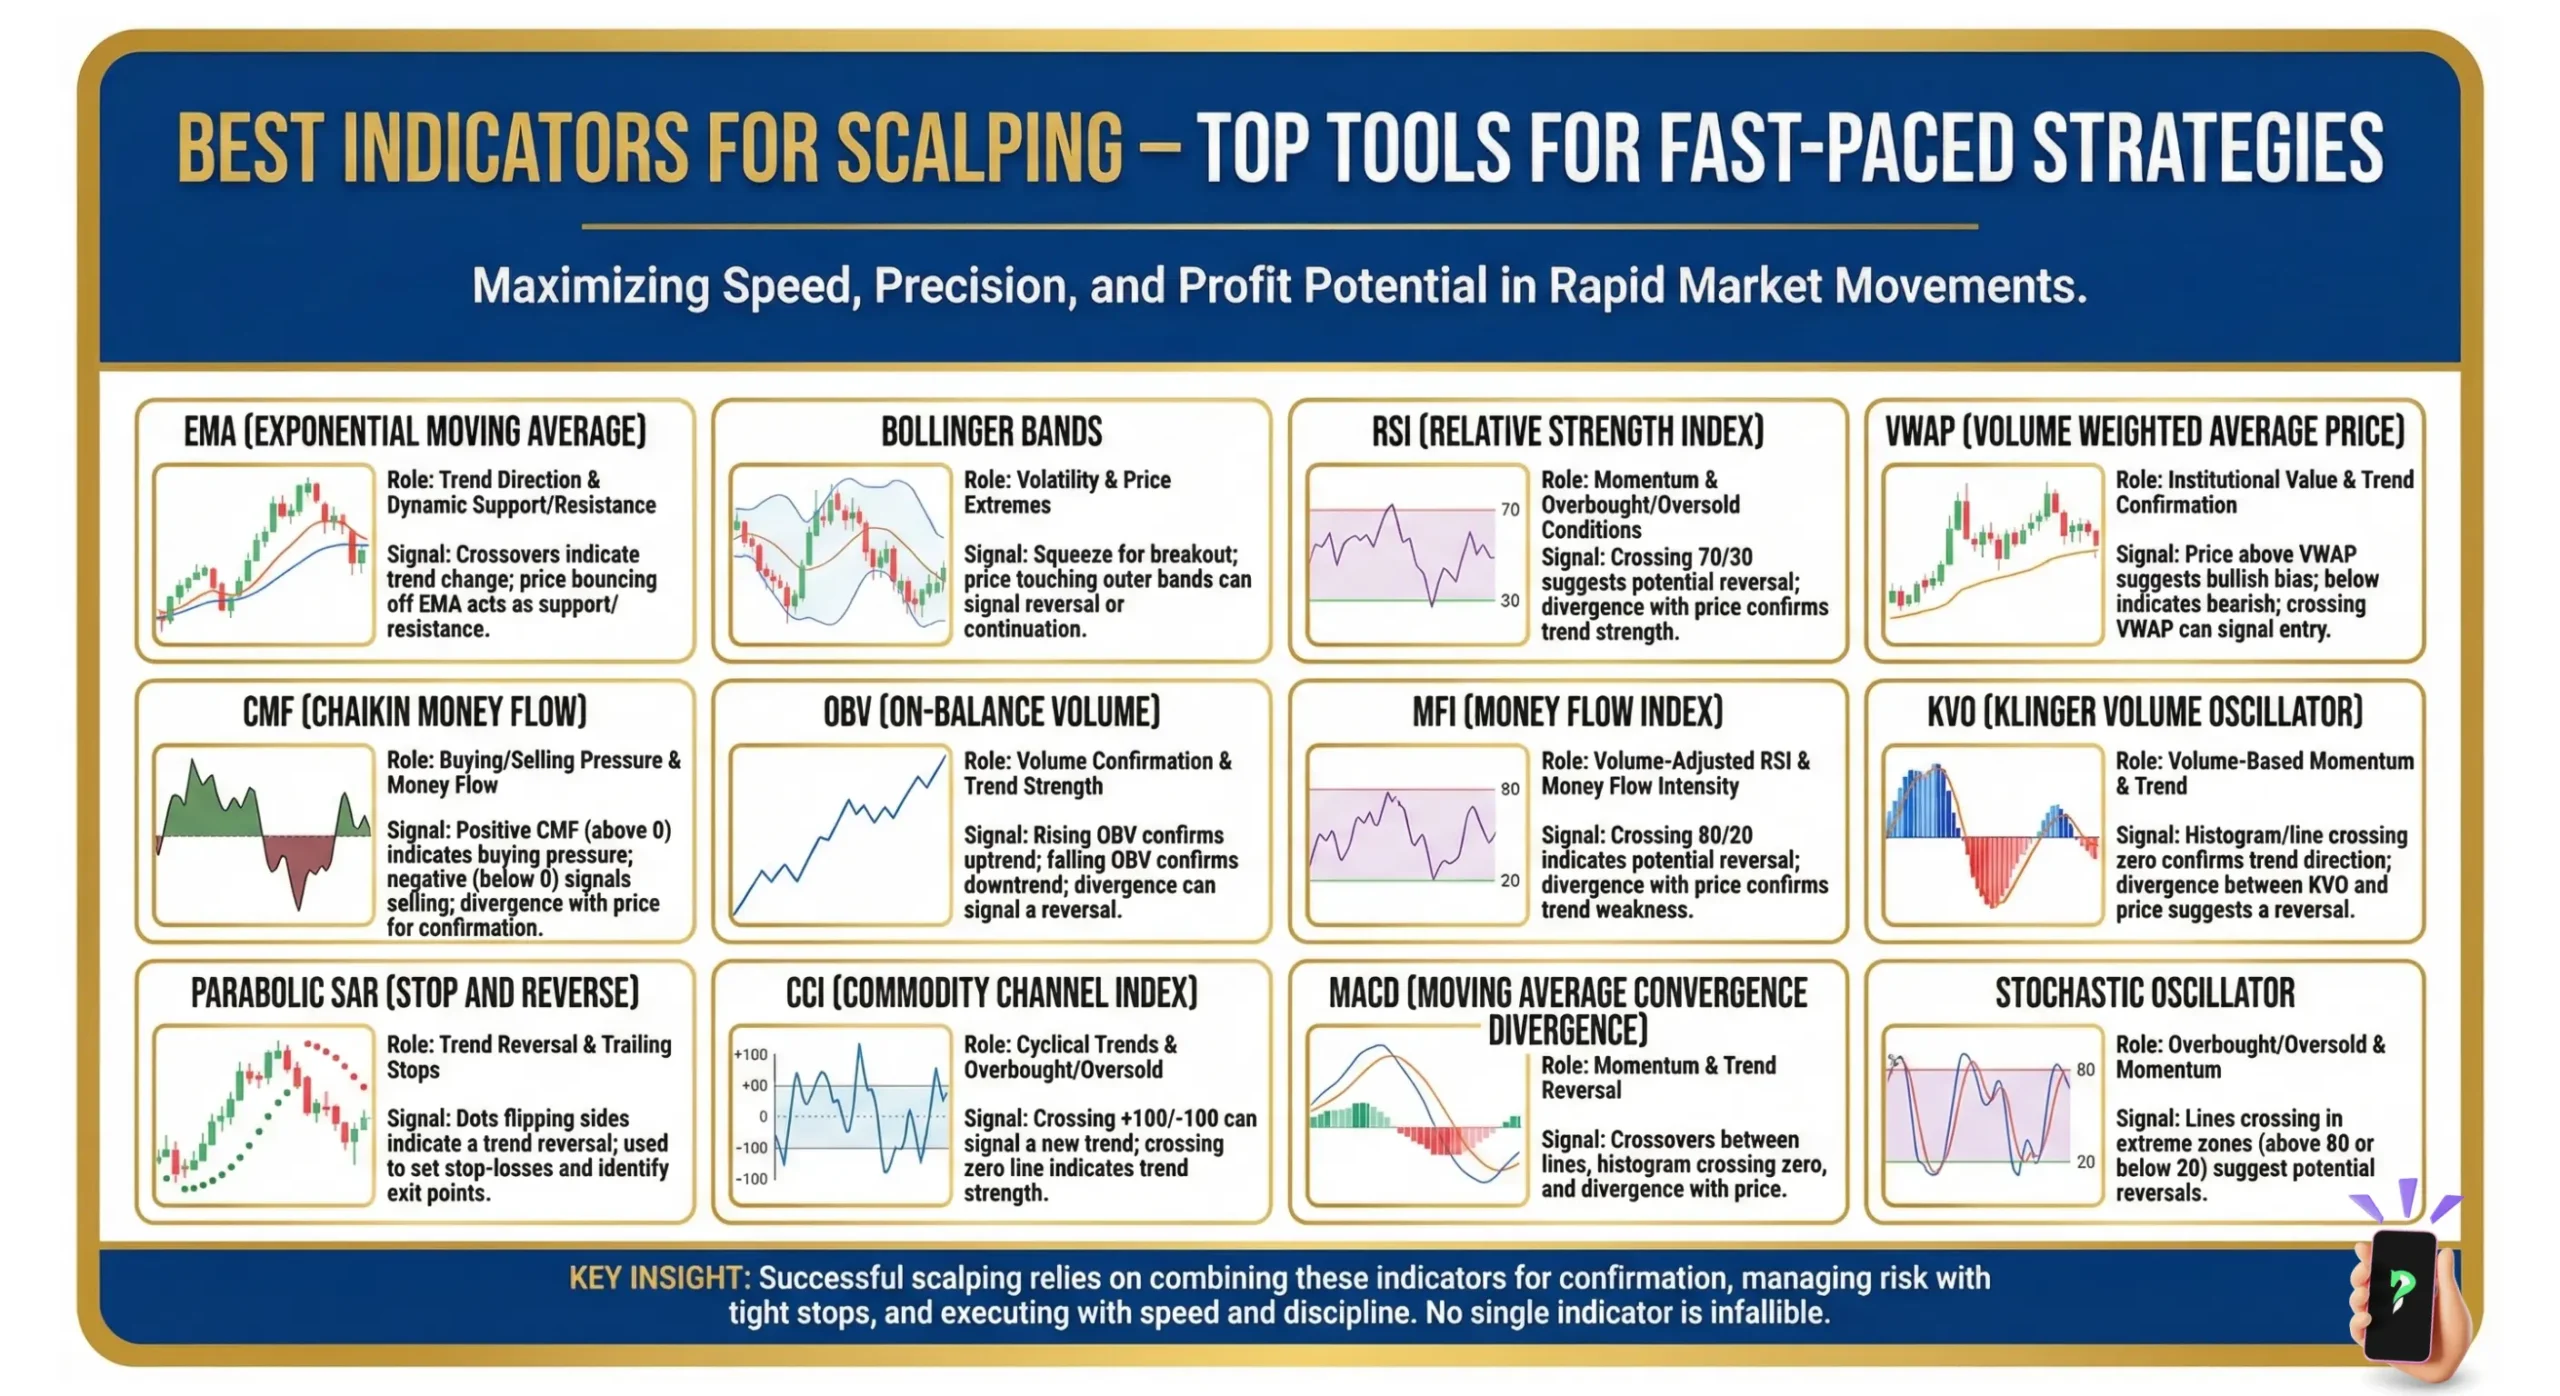
- Core tools: The top 12 indicators for scalping include EMA, Bollinger Bands, RSI, VWAP, CMF, OBV, MFI, KVO, Parabolic SAR, CCI, MACD, and Stochastic.
- Efficiency: Successful strategies often combine trend-following, momentum, and volume indicators to filter out false signals.
- Risk management: High liquidity and low spreads are critical for maintaining profitability.
Quick start: Avoid Information overload
If you are new to scalping, do not attempt to use all 12 indicators at once. For a balanced starting point, focus on three core components:
- Trend filter: Exponential Moving Average (EMA)
- Momentum trigger: Relative Strength Index (RSI)
- Volume confirmation: Volume-Weighted Average Price (VWAP)
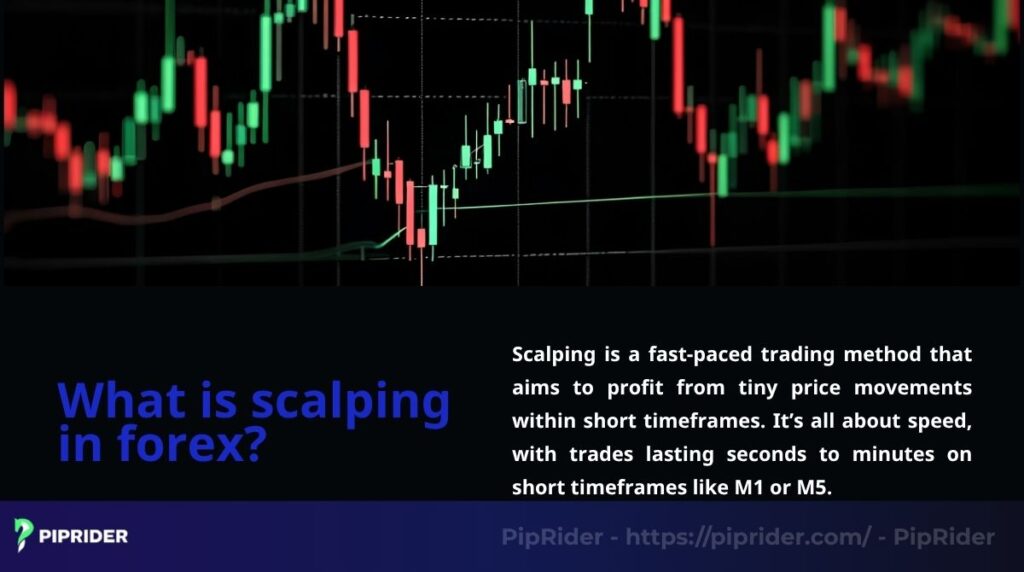
1. What is scalping in forex?
Scalping is a specialized trading method targeting minor price fluctuations within very short durations, ranging from a few seconds to several minutes. It is most effective in high-liquidity environments, such as major currency pairs (EUR/USD, GBP/USD), where tight spreads and fast execution are available.
While scalping offers frequent opportunities, it is demanding. It requires intense focus to manage the high volume of trades and the emotional pressure of rapid decision-making. Because profits per trade are small, transaction costs (spreads and commissions) can significantly impact your bottom line. Utilizing the best indicators for scalping helps streamline this process by identifying high-probability setups quickly.
2. The Role of Indicators: What They Can and Can’t Do
In the high-speed environment of scalping, indicators act as a filter for market noise. They provide a mathematical framework for entries and exits, which is essential for removing emotional bias when trading on 1-minute or 5-minute charts.
The limits of indicators
It is vital to understand that all indicators are “lagging” tools—they calculate data based on past price action. They cannot predict future movements with certainty, but they can identify high-probability zones.
Avoiding “analysis paralysis”
One of the most significant risks for a scalper is using too many tools at once. In a market where decisions must be made in seconds, having five different indicators providing conflicting signals leads to “analysis paralysis.” Effective scalping requires a lean setup; typically, one tool for trend direction, one for momentum, and one for volume confirmation is sufficient to maintain clarity and speed.
3. Best Scalping Indicators by Trading Style
Before diving into the full list, use this quick-reference guide to select the tools that best fit your specific trading goals and experience level.
| Trading Style | Recommended Indicator Combo | Primary Goal |
|---|---|---|
| Beginners | EMA + RSI + VWAP | Simplicity and trend following |
| Trend Scalping | EMA + MACD + VWAP | Riding strong momentum moves |
| Reversal Scalping | Bollinger Bands + RSI + Stochastic | Identifying overextended price points |
| Breakout Scalping | VWAP + OBV + EMA | Confirming volume behind price breaks |
| Volume Analysis | CMF + OBV + MFI | Tracking “smart money” and liquidity |
4. Choosing Indicators Based on Market Conditions
Scalping success often depends on matching the right indicator type to the current market environment. Using the wrong tool (e.g., an oscillator in a strong trend) is a primary cause of false signals.
| Market Condition | Best Indicator Type | Avoid |
|---|---|---|
| Strong Trend | Trend (EMA, MACD) + Volume (VWAP) | Stand-alone Oscillators (RSI) |
| Sideways/Range | Oscillators (RSI, Stochastic, CCI) | Stand-alone Trend Filters (SAR) |
| Breakout Setup | Volume (OBV, CMF) + EMA | Mean Reversion Tools (BB) |
| High-Noise (M1) | Simple Filters (EMA, VWAP) | Multiple Lagging Oscillators |
5. Deep Dive: Top 12 Indicators for Scalping
Each indicator below is selected for its reliability on M1-M5 charts. We have categorized them by their primary function to help you build a balanced trading stack.
5.1. Trend indicators
Trend indicators help you stay on the right side of the market by smoothing out price noise and identifying the dominant direction.
- Exponential Moving Average (EMA): Unlike a simple moving average, the EMA gives more weight to recent prices, making it more responsive for scalping. Common settings include the EMA(5) and EMA(9) for M1-M5 charts. When the price stays above the EMA, it suggests a short-term bullish bias; when below, it suggests a bearish bias.
- Volume-Weighted Average Price (VWAP): This is a benchmark used by many institutional traders. It represents the average price based on both volume and price. For a scalper, trading above the VWAP indicates buying pressure, while trading below suggests a selling bias. It serves as a dynamic support or resistance level throughout the day.
- MACD (Moving Average Convergence Divergence): MACD measures the relationship between two EMAs. Scalpers often use faster settings like (5, 13, 3) to reduce lag. A crossover above the signal line indicates building bullish momentum, especially if confirmed by a move above the zero line.
- Parabolic SAR: This tool appears as dots above or below the price. When the dots move from above to below, it signals a potential trend shift to the upside. It is often used to manage stop-losses, moving them as the trend progresses.
5.2. Reversal and Momentum indicators
These tools are designed to identify when a price move has reached an extreme and is likely to pull back or reverse.
- Relative Strength Index (RSI): The RSI measures the speed and change of price movements. For scalping, a shorter period (like 7) is often used to increase sensitivity. Typically, readings above 70-80 indicate overbought conditions, while below 30-20 indicate oversold conditions.
- Bollinger Bands: These bands consist of a middle moving average and two outer bands based on standard deviation. They expand during high volatility and contract during low volatility. Scalpers look for “band walks” during trends or bounces off the outer bands during range-bound markets to time reversals.
- Stochastic Oscillator: Similar to the RSI, the Stochastic identifies overbought and oversold zones. It is particularly effective in sideways markets. A cross of the %K line above the %D line in the oversold zone (below 20) can signal a quick buying opportunity in a choppy market.
- Commodity Channel Index (CCI): The CCI measures price deviation from its statistical mean. Readings above +100 or below -100 indicate price extremes. Scalpers use it to identify the start of new trends or the exhaustion of current ones.
5.3. Volume and Confirmation indicators
Since forex is decentralized, volume indicators help estimate the amount of liquidity and participation behind a price move.
- On-Balance Volume (OBV): OBV uses volume flow to predict changes in stock price. If the price is rising but OBV is falling, the move may lack sufficient backing and could reverse. It is a critical tool for confirming breakouts.
- Chaikin Money Flow (CMF): CMF measures the amount of Money Flow Volume over a specific period. A reading above zero indicates buying pressure, while a reading below indicates selling pressure.
- Money Flow Index (MFI): Often called the “volume-weighted RSI,” the MFI incorporates both price and volume. It is used to identify overbought or oversold signals backed by actual volume data, providing more reliability than RSI alone.
- Klinger Volume Oscillator (KVO): This tool compares short-term and long-term volume trends to identify shifts in momentum. It is often used to detect divergences that precede price reversals.
Comparison table:
| Indicator | Best For | Main Weakness | Timeframe | Best Paired With |
|---|---|---|---|---|
| EMA | Trend filtering | Whipsaws in ranges | M1-M5 | RSI, CCI |
| Bollinger Bands | Mean reversion | Lags in breakouts | M5 | Stochastic |
| RSI | Overextended moves | False exits in trends | M1-M5 | EMA, VWAP |
| VWAP | Institutional bias | Noise on low volume | M5-M15 | OBV, CMF |
| Stochastic | Timing in ranges | Premature signals | M1-M5 | EMA, BB |
| OBV | Breakout confirmation | Context-free data | M1-M5 | VWAP |
6. 3 Scalping Indicator Combinations That Actually Work
To avoid “analysis paralysis,” focus on proven workflows that combine different indicator types for higher probability setups.
Combo 1: Beginner Trend Scalping (EMA + RSI + VWAP)
- Best condition: Markets with a clear intraday direction.
- Entry logic: Buy when price is above VWAP, EMA(9) crosses above EMA(20), and RSI crosses above 50.
- Stop-Loss: 2-3 pips below the most recent swing low.
- Avoid: Sideways markets where EMA lines are flat or intertwined.
Combo 2: Reversal Scalping in Ranges (Bollinger Bands + Stochastic + CCI)
- Best condition: Low-volatility markets confined within price channels.
- Entry logic: Sell when price touches the Upper Bollinger Band, Stochastic is above 80 and crosses down, and CCI is above +100.
- Stop-Loss: Just above the Upper Band or previous local high.
- Avoid: Sudden news events or high-momentum breakouts.
Combo 3: Breakout Scalping (VWAP + OBV + EMA)
- Best condition: High-volume sessions (London/New York overlap) near key levels.
- Entry logic: Enter long when price breaks a consolidation zone, VWAP is pointing up, and OBV reaches a new intraday high.
- Stop-Loss: Inside the broken consolidation range to minimize risk.
- Avoid: Low-liquidity sessions where breakouts often fail (false breakouts).
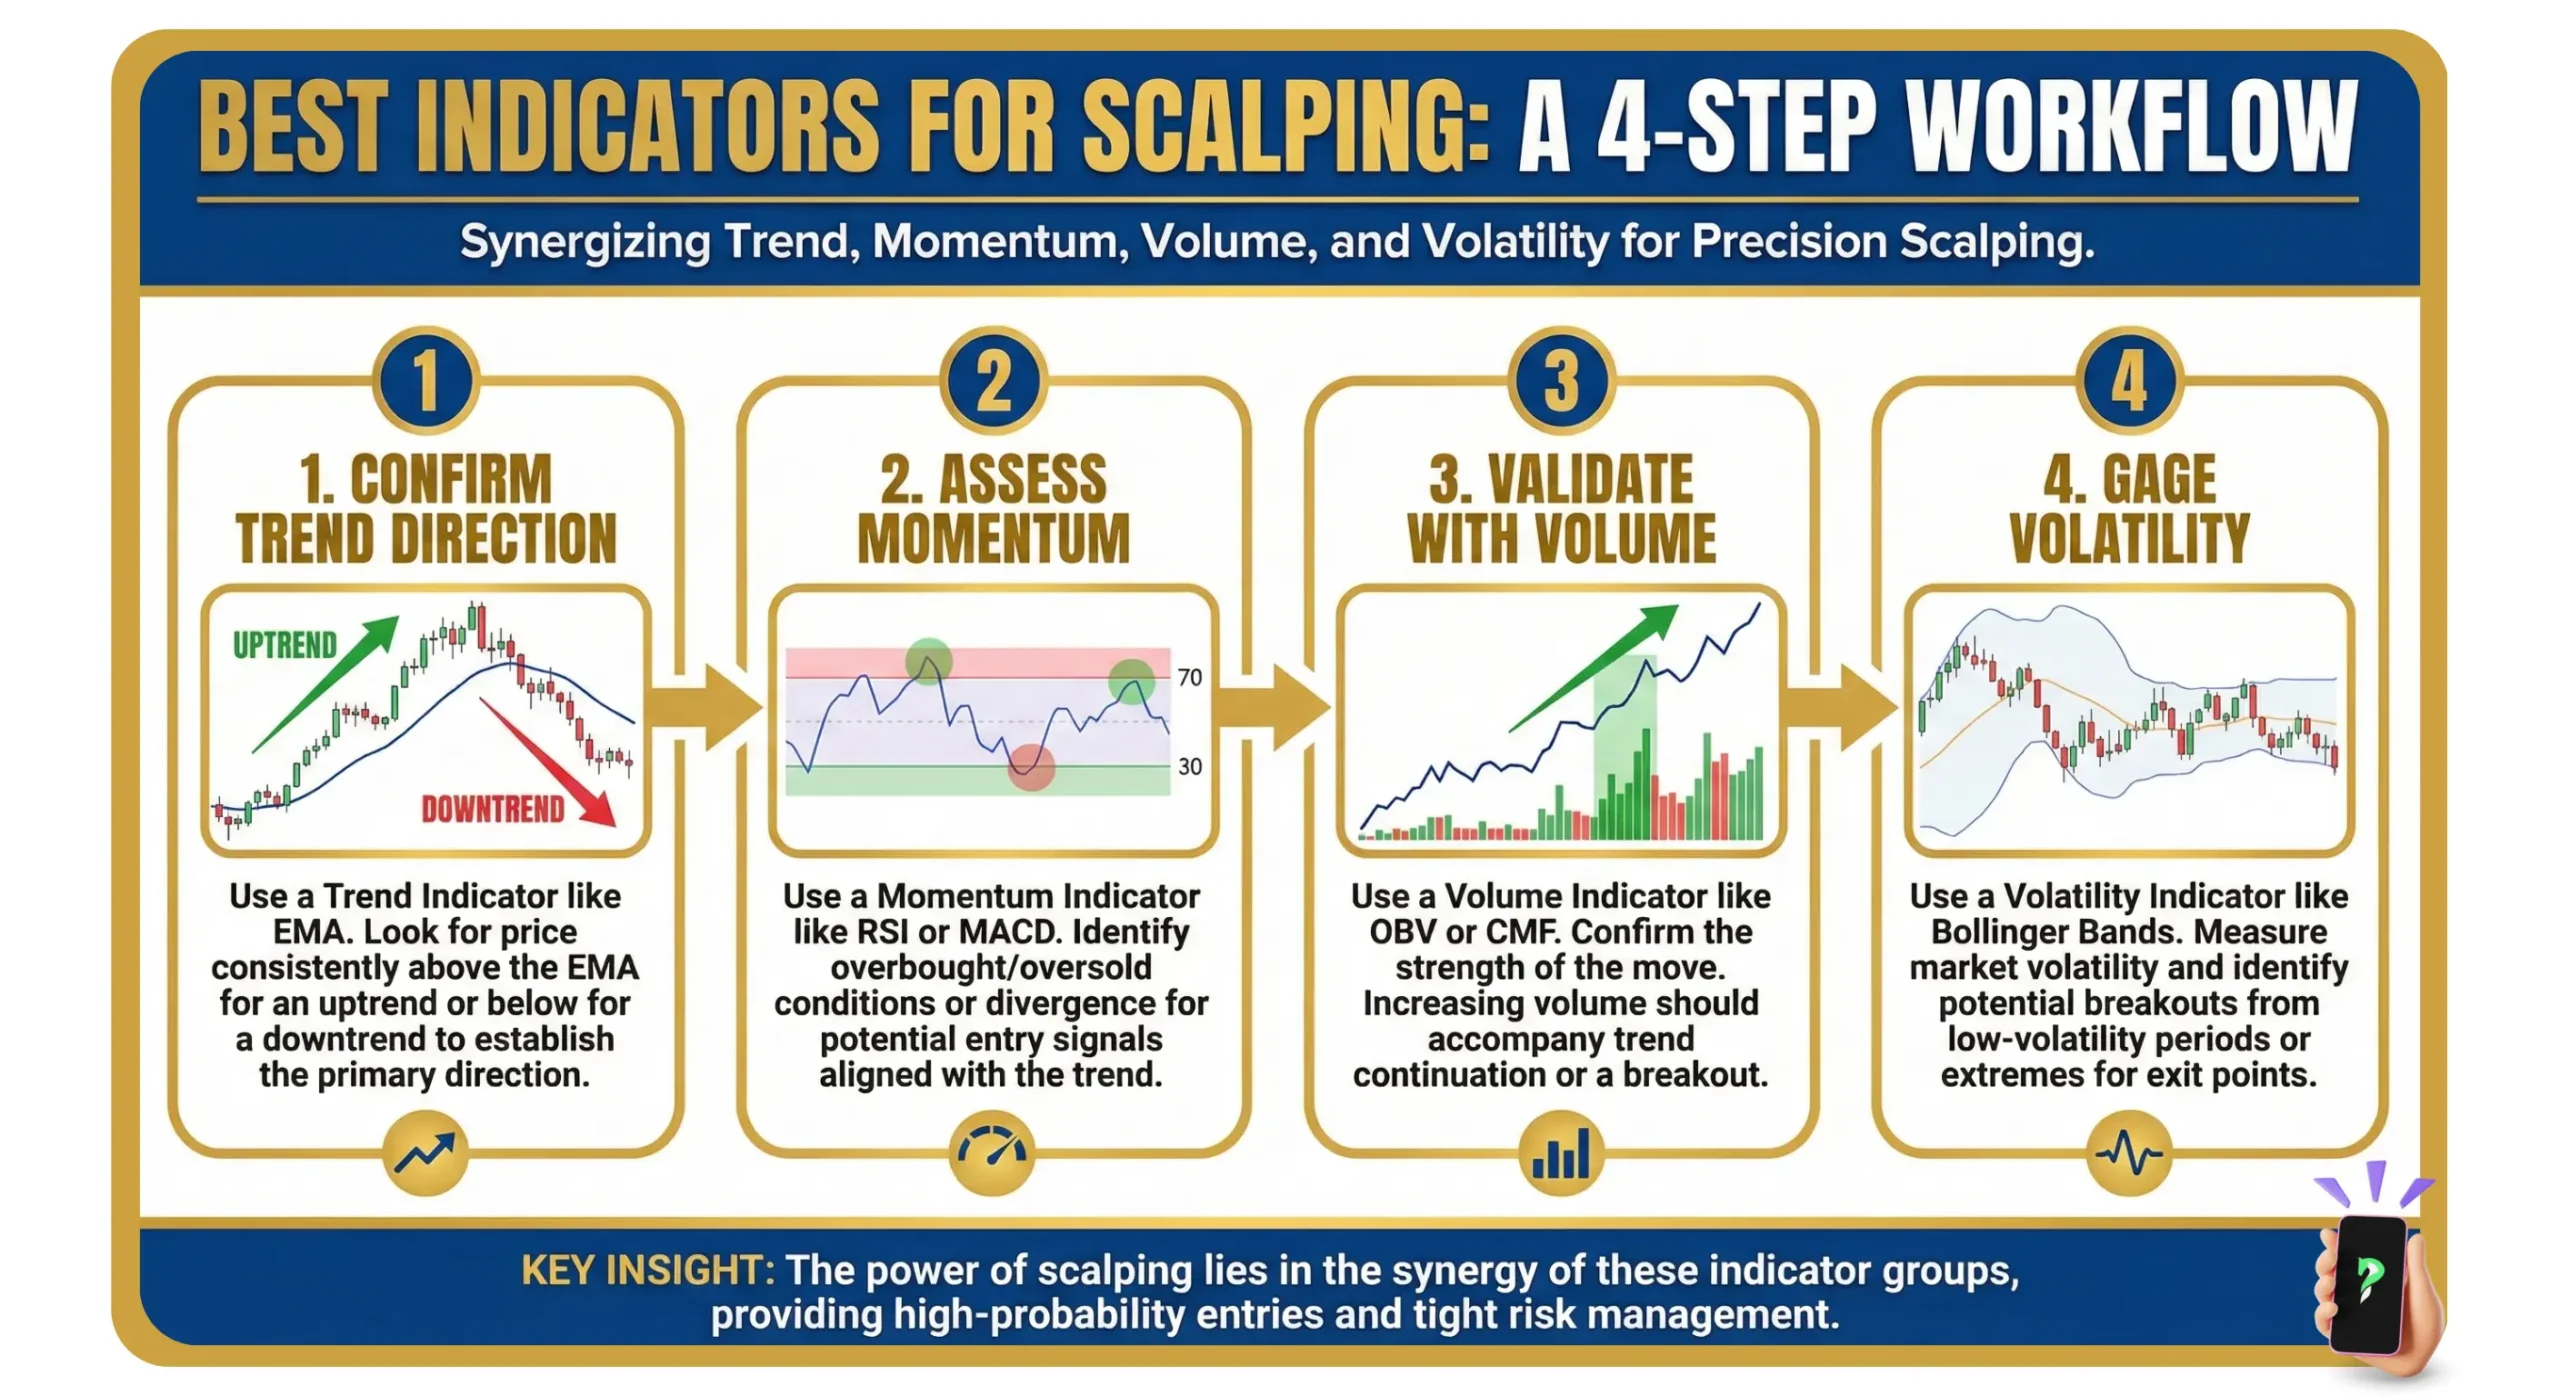
7. Building a Winning Scalping Strategy: The Playbook
Executing a scalping trade requires a systematic approach to ensure speed and consistency. Below is a professional 5-step workflow for most 5-minute setups.
- Assess market environment: Determine if the market is trending or ranging. If price action is erratic or volume is low (e.g., late Asian session), skip the trade.
- Identify the setup: Use your primary trend filter (like the EMA or VWAP) to establish the trade direction. For a long trade, ensure price is holding above these levels.
- Wait for confluence: Do not enter on a single signal. Wait for at least two indicators to agree. For example, wait for the price to bounce off the EMA while the RSI exits the oversold zone.
- Define risk before entry: In scalping, your stop-loss must be tight. Place it 1-2 pips beyond a recent swing high/low or a technical level (like the VWAP). Ensure your potential profit is at least equal to or greater than your risk (1:1.5 Risk/Reward ratio).
- Execute and manage: Enter the trade immediately upon signal confirmation. Scalping does not allow for hesitation. If the setup loses its momentum or the indicators reverse, exit the trade manually rather than waiting for a stop-loss to be hit.
8. Why Scalping Indicators Fail (and How to Avoid It)
Understanding why indicators provide false signals is just as important as knowing how to use them.
- The lag factor: All indicators calculate data from the past. On an M1 chart, a signal might arrive after the majority of a move has already occurred. Solution: Use leading indicators like volume (VWAP/OBV) to anticipate shifts.
- Low liquidity erasure: In low-volume sessions, spreads widen and price action becomes “choppy,” causing indicators to generate frequent, conflicting signals. Solution: Only trade during peak sessions (London/New York overlap).
- Entering before candle close: Indicators recalculate until a candle is finished. A signal that looks perfect mid-candle can vanish by the time it closes. Solution: Always wait for the candle to close before executing.
- Market context blindness: A “buy” signal from an oscillator in a strong downtrend is often a trap. Solution: Always use a trend filter (like a higher timeframe EMA) to ensure you aren’t trading against the dominant flow.
9. Scalping Rules That Matter More Than Indicators
Even the best indicators for scalping cannot protect a trader who ignores basic market discipline. Follow these core rules to preserve your capital.
- Trade high-liquidity pairs only: Stick to majors like EUR/USD, GBP/USD, or USD/JPY. Exotic pairs have wider spreads that can consume 50-100% of your target profit in a single trade.
- Respect the news calendar: High-impact economic news releases (like NFP or CPI) create slippage and extreme volatility. Most scalping indicators will fail during these events.
- Set a daily trade limit: Overtrading is the most common cause of “revenge trading” and burnout. Set a maximum number of trades per session (e.g., 5-10) to maintain focus.
- Strict spread thresholds: If the spread on your chosen pair exceeds 1.5 pips, it is generally not suitable for M1/M5 scalping. The cost of entry/exit becomes too high relative to the target pip gain.
- Automation is a tool, not a savior: Use platforms like MT4/MT5 for alerts, but always manually verify the market context before clicking “Buy” or “Sell.”
10. Frequently asked questions about scalping
New traders often have questions about scalping indicators, and how to use them right. Here are answers to common queries to clear up confusion. These insights come from my time figuring out what works in fast-paced forex.
11. Conclusion
Scalping is a demanding but rewarding trading style that relies on speed, discipline, and the right technical framework. By using tools like the EMA, RSI, and VWAP in combination, you can filter out market noise and focus on high-probability setups. Success in scalping comes not from finding a “magic” indicator, but from consistent execution of a proven strategy.
Infographic Section
-
Best Indicators for Scalping -
A 4-Step Workfilow -
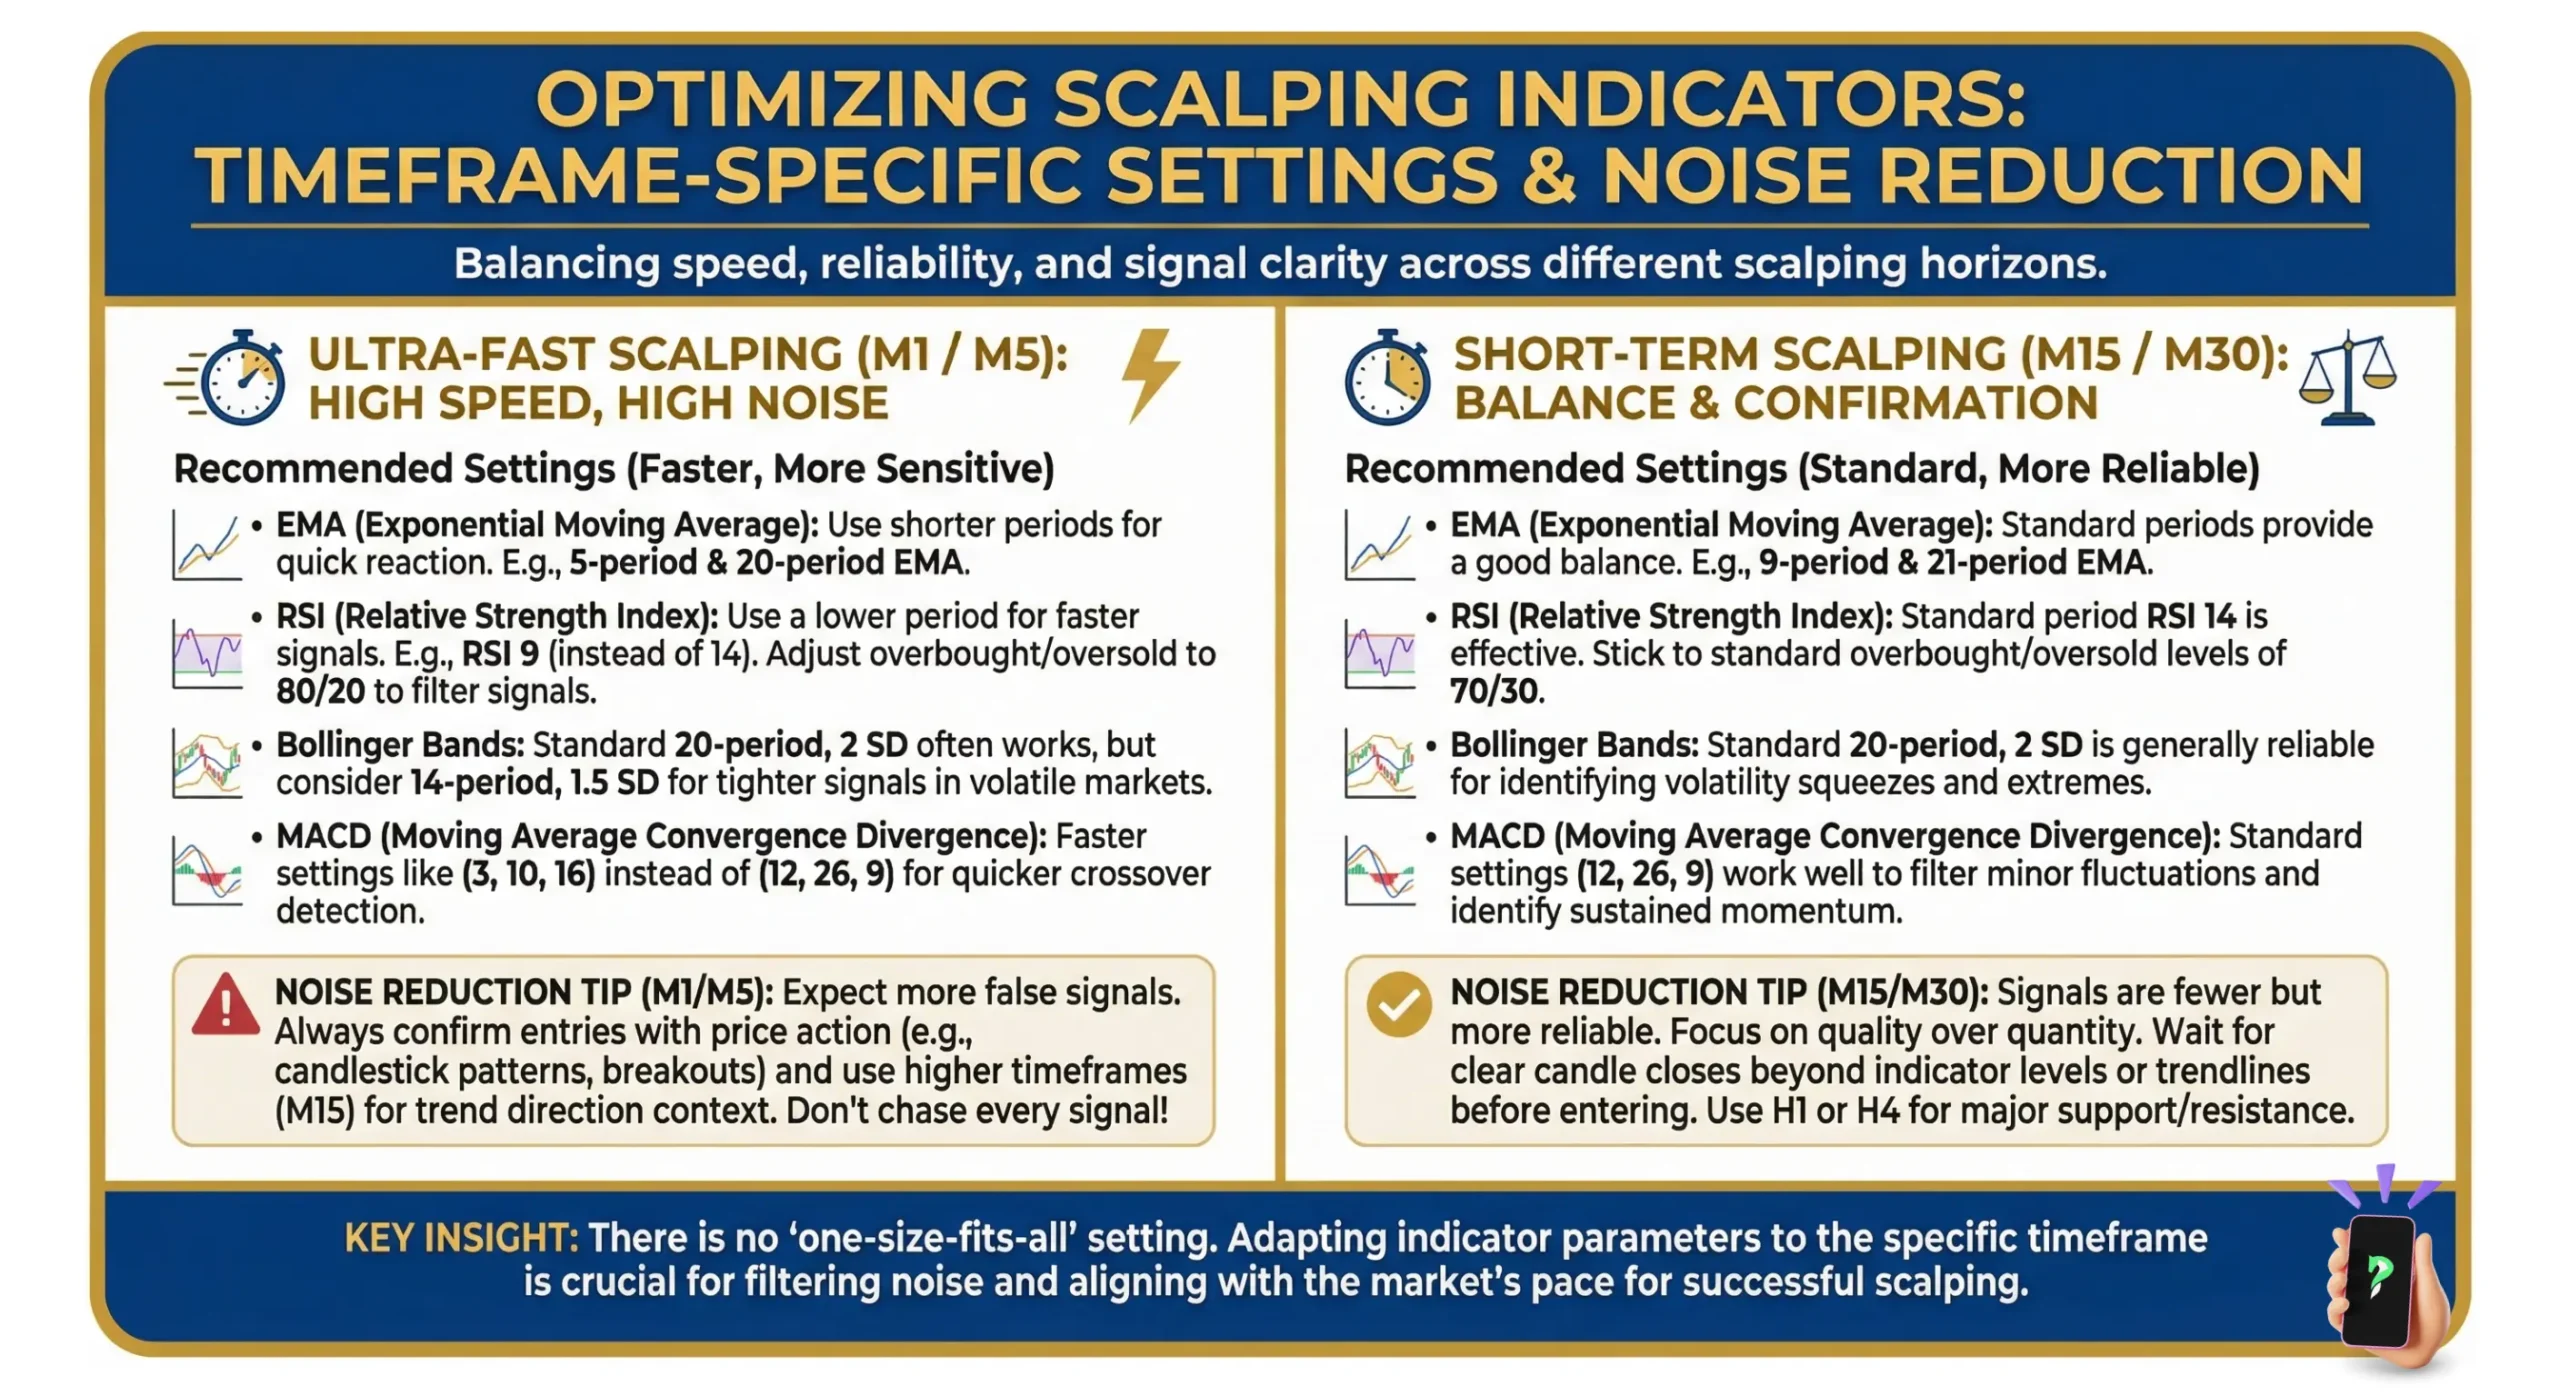
Optimizing Scalping Indicators


