
The Forex market can feel like a battlefield where buyers and sellers clash fiercely, each driven by hope, fear, and ambition as they try to push prices in their favor. As a trader, I’ve always been fascinated by tools that reveal who’s winning this tug-of-war, and that’s where bulls and bears power indicators come in.
These simple yet powerful tools help you see the strength of buyers (bulls) and sellers (bears), making it easier to spot trends and make smarter trades.
Imagine having a clear window into market sentiment, helping you decide when to jump in or stay out. This article will guide you through how these indicators work, practical ways to use them, and tips to boost your trading confidence. Whether you’re new to Forex or looking to sharpen your skills, let’s dive into this exciting tool and uncover its potential together!
Key Takeaways
- Understanding market dynamics: Bulls and Bears Power indicators, also known as Elder-Ray indicators, measure the strength of buyers (bulls) and sellers (bears), providing a clear view of market sentiment and control.
- Simple calculations: These indicators use a 13-period Exponential Moving Average (EMA) to quantify buyer and seller strength, with Bulls Power (High – EMA) and Bears Power (Low – EMA) offering straightforward insights.
- Versatile strategies: Use these indicators for confirming trends, spotting reversals, and identifying divergences, making them suitable for both beginners and experienced traders.
- Strengths and limitations: They provide clear signals and divergence detection but may lag in fast markets or produce false signals in choppy conditions, so pairing with other tools is recommended.
- Pro Tips: Combine with support/resistance or RSI, test on demo accounts, adjust timeframes to match trading style, and avoid low-volatility markets for best results.
1. What are Bulls and Bears Power indicators or the Elder-Ray Index?
Bulls and bears power indicators aren’t just technical tools, they’re like emotional barometers of the market, measuring the strength of buyers (bulls) and sellers (bears) in real time. When you’re caught in the chaos of a volatile market, these indicators help you sense who’s really in control.
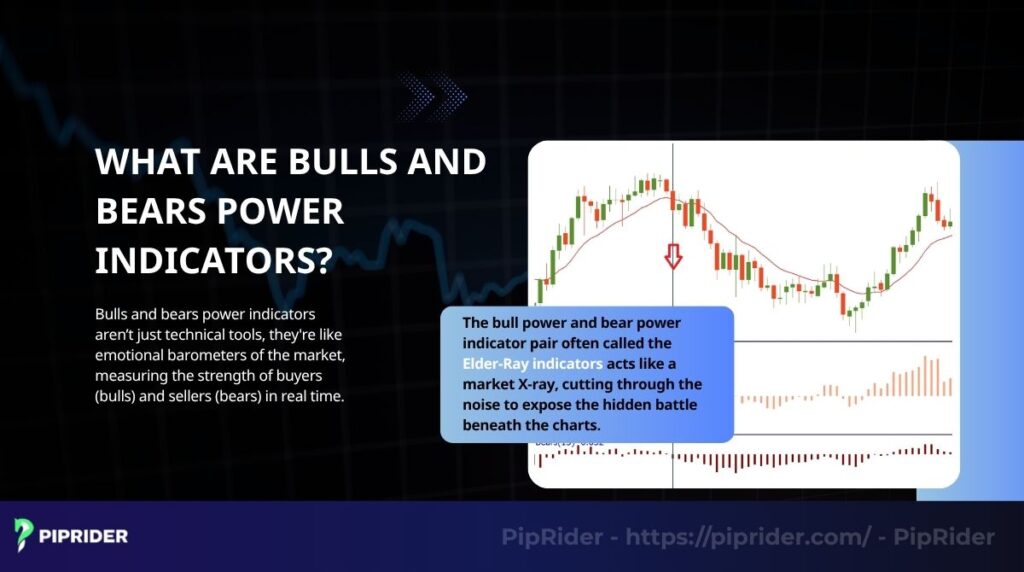
The bull power and bear power indicator pair often called the Elder-Ray indicators acts like a market X-ray, cutting through the noise to expose the hidden battle beneath the charts. You can almost feel the intensity as bulls charge forward with optimism or bears claw back with doubt and fear. For traders like us, this insight becomes more than data; it’s a compass to navigate the emotional tides of price movements with clarity and confidence.
Picture the Forex market as a constant push-and-pull between optimistic buyers and cautious sellers. I’ve always found it thrilling to decode this dynamic, and the bulls and bears power indicators, developed by Alexander Elder, make it possible.
These indicators simplify market sentiment analysis, making them ideal for beginners and seasoned traders alike. They work together to highlight whether buyers or sellers are dominating.
I love how these tools break down complex market battles into clear signals, they offer a straightforward way to understand market forces, giving traders a clear view of buyer-seller dynamics to inform their decisions.
2. How are bulls and bears power indicators calculated?
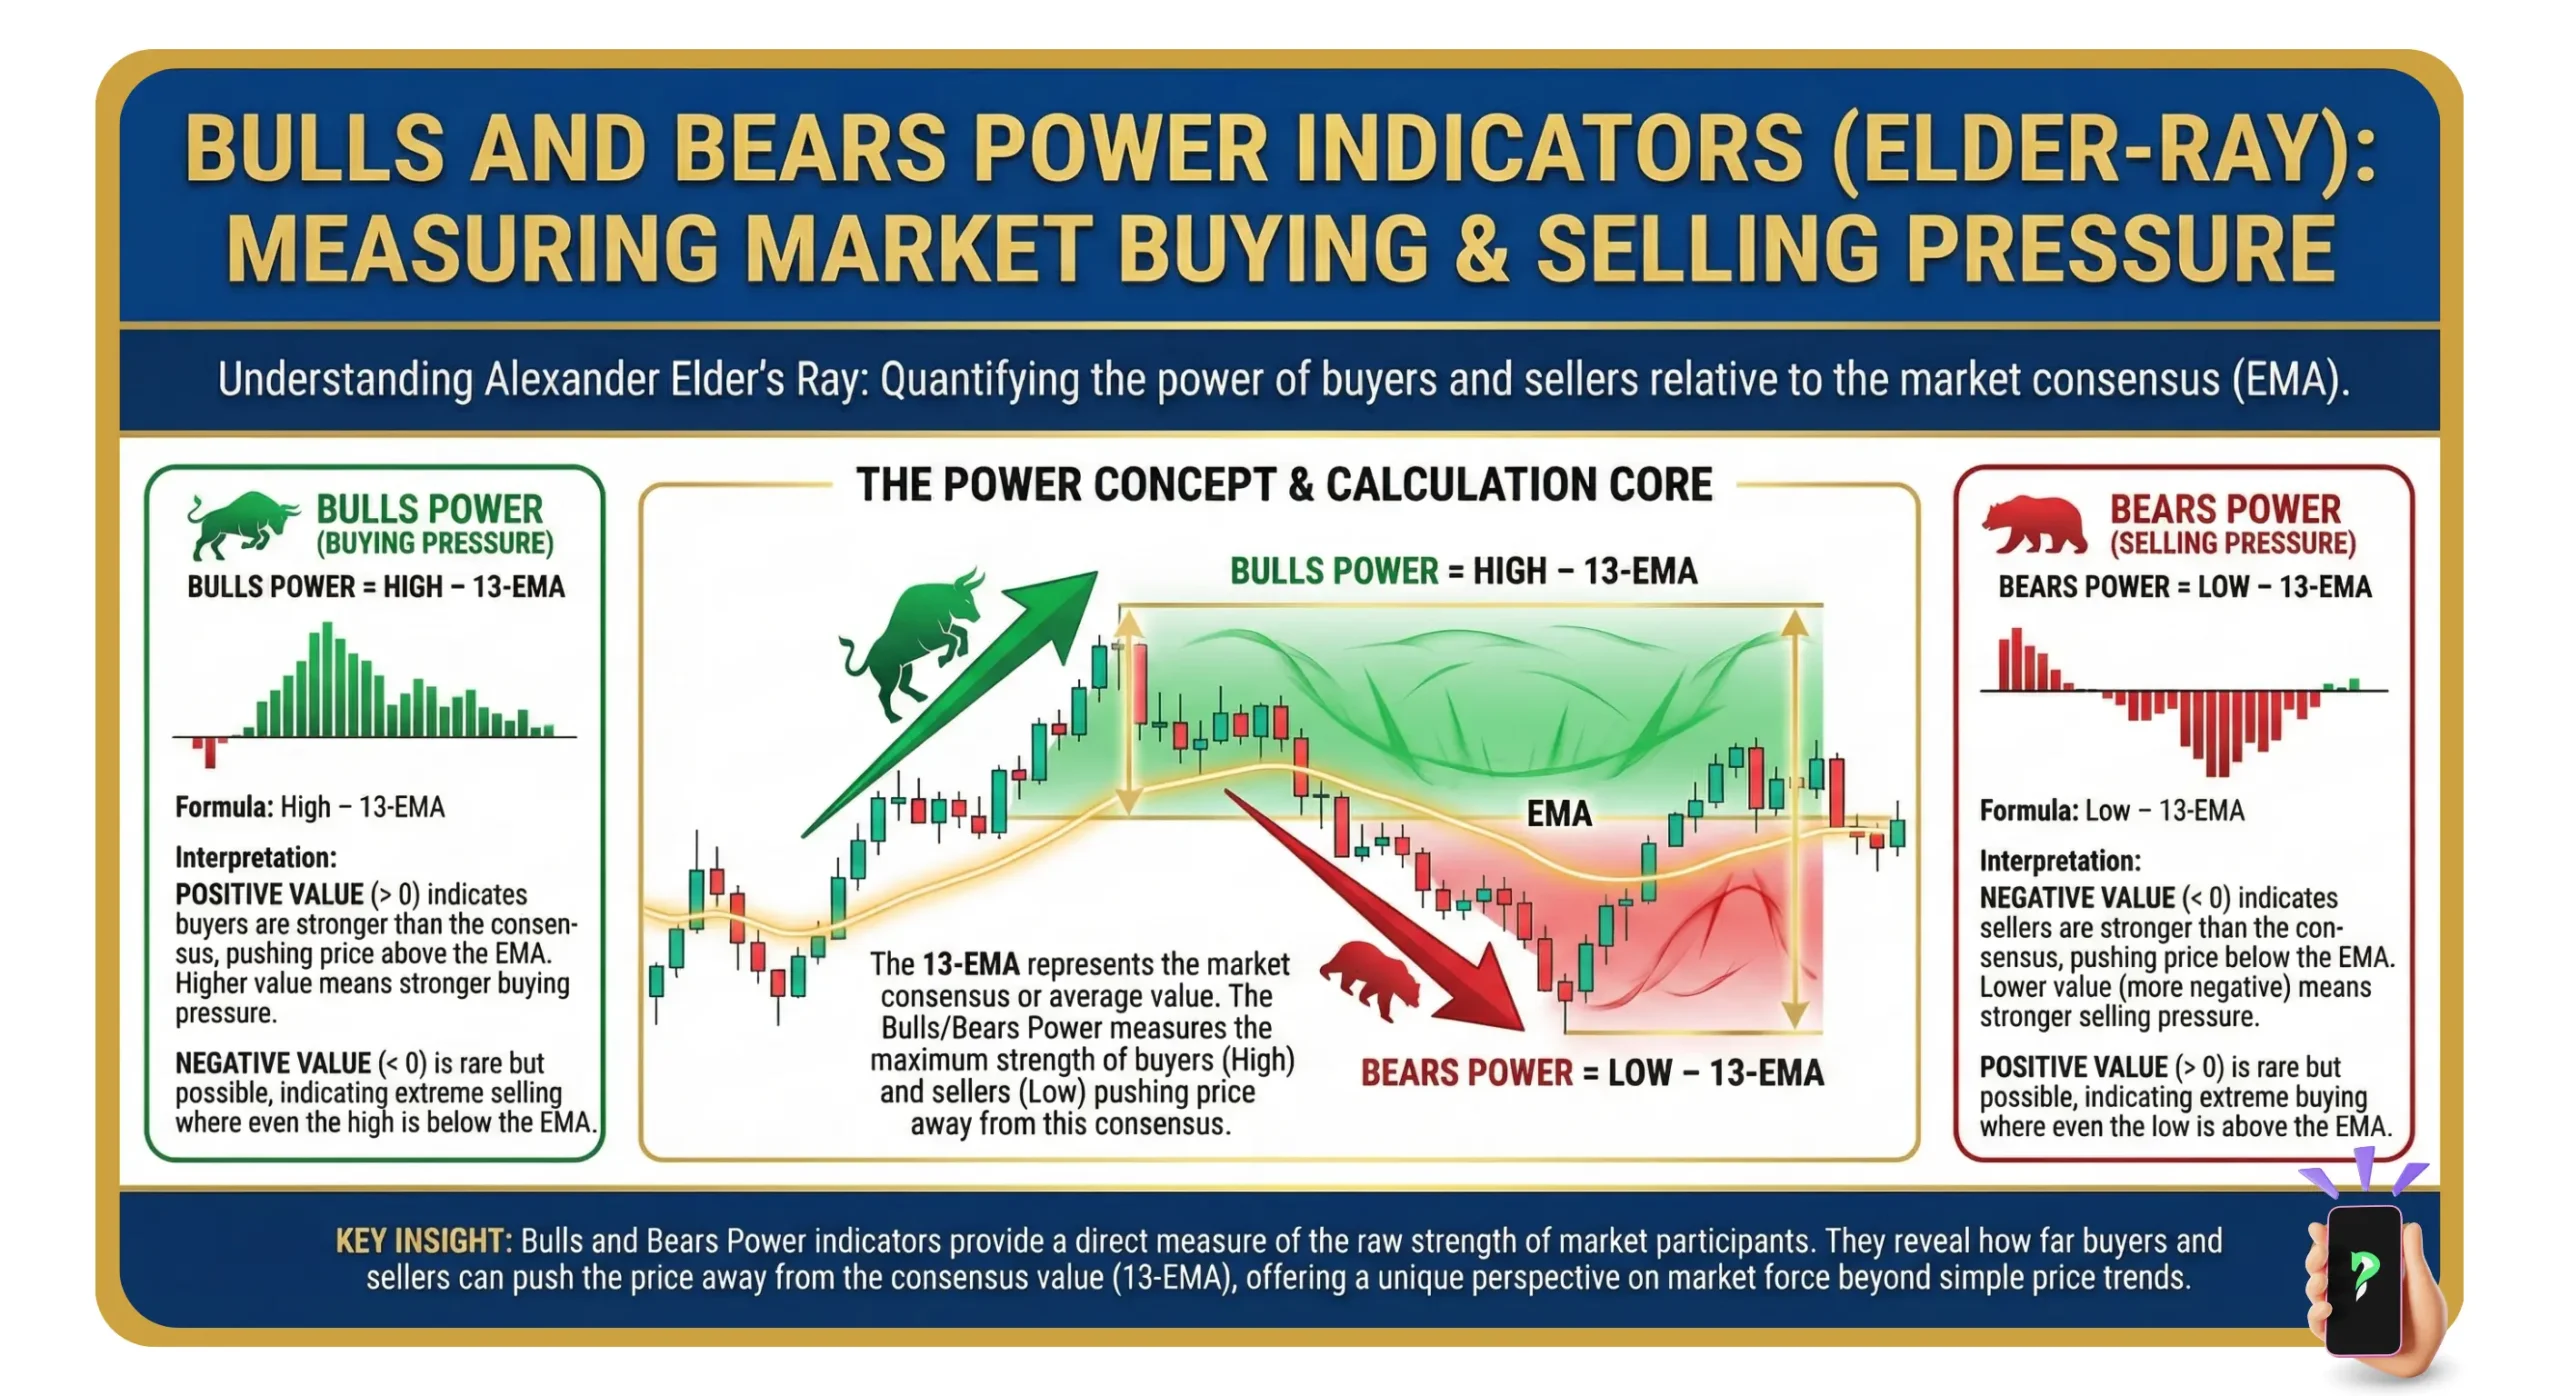
The bulls and bears indicator relies on a 13-period Exponential Moving Average (EMA), gently smoothing out the market’s often chaotic price fluctuations like bringing order to the madness. For me, there’s something strangely reassuring about it.
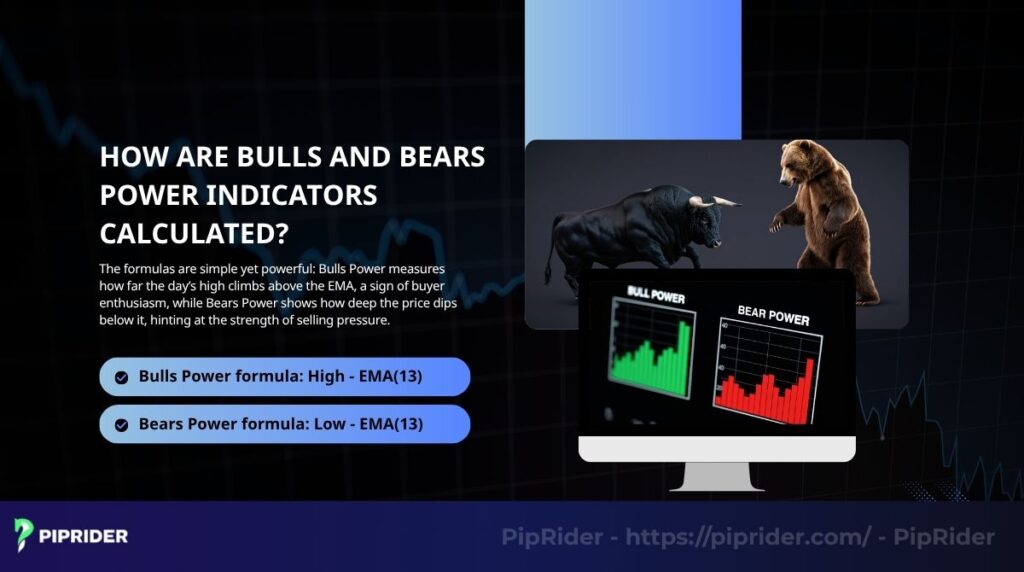
The formulas are simple yet powerful: Bulls Power measures how far the day’s high climbs above the EMA, a sign of buyer enthusiasm, while Bears Power shows how deep the price dips below it, hinting at the strength of selling pressure.
It’s more than just numbers, it’s a snapshot of collective emotion, fear, and conviction playing out in real time. Thankfully, trading platforms like MT4 or TradingView do the heavy lifting for you.
- Bulls Power formula: High – EMA(13)
- Bears Power formula: Low – EMA(13)
Here’s a quick comparison to clarify:
| Indicator | Formula | What it measures |
| Bulls Power | High – EMA(13) | Strength of buyers pushing prices up |
| Bears Power | Low – EMA(13) | Strength of sellers pulling prices down |
The bull power and bear power indicator uses simple formulas based on the 13-period EMA to quantify buyer and seller strength, making market analysis accessible. I’ve always appreciated how these calculations turn raw price data into clear insights.
3. Setting up bulls and bears power indicators on your charts
Adding bulls and bears power indicators to your charts is easier than it sounds, and I remember how excited I was when I first set them up. These tools are available on most trading platforms, and with a few clicks, you can start analyzing market trends.
Here’s how to set up the bulls vs bears indicator:
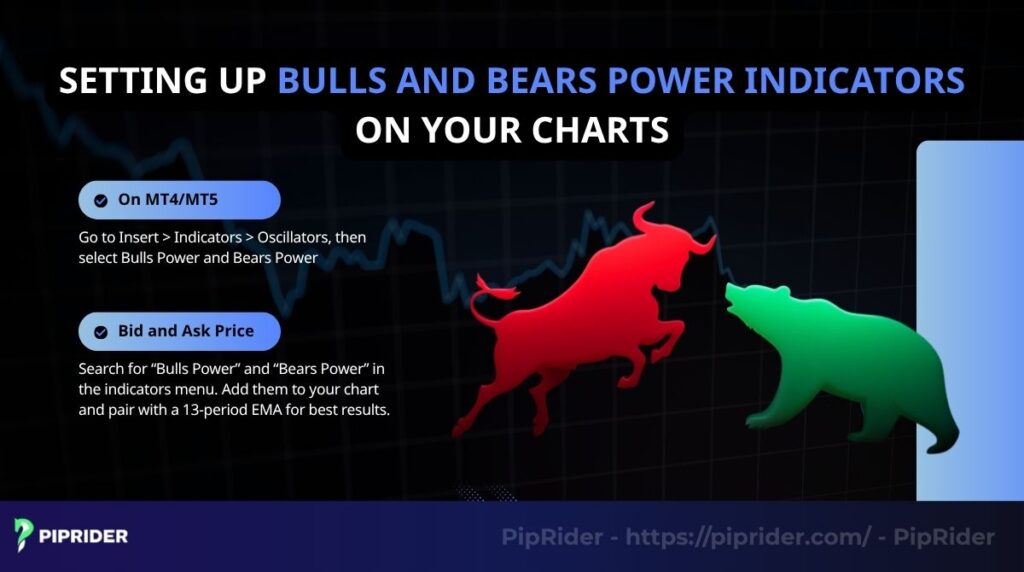
- On MT4/MT5: Go to Insert > Indicators > Oscillators, then select Bulls Power and Bears Power. Set the period to 13 for the EMA, and choose colors like green for Bulls and red for Bears.
- On TradingView: Search for “Bulls Power” and “Bears Power” in the indicators menu. Add them to your chart and pair with a 13-period EMA for best results.
- Pro tip: I can’t stress enough how much I love pairing the 13-period EMA with these indicators. It’s like adding the perfect lens to see the market’s full story! Plotting them together feels like unlocking a clearer, more vibrant picture of the price action, giving you that extra confidence to make smarter trades.
I’ve found that color-coding makes it easier to spot signals at a glance. Most platforms let you customize settings, so play around until the chart feels intuitive.
Summary: Setting up the bull power and bear power indicator is quick and straightforward, allowing you to visualize market dynamics with ease on platforms like MT4 or TradingView.
4. Trading strategies using bulls and bears power indicators in Forex
In Forex trading, timing and market sentiment are everything. For Forex traders, nothing beats the thrill of spotting a great trade setup, and bulls and bears power indicators have been a game-changer for me in navigating the dynamic currency market. These tools, when used with the 13-period EMA, offer clear signals for entering and exiting trades. Their simplicity and versatility make them especially valuable in the fast-paced world of Forex, where identifying momentum shifts early can make all the difference.
Let’s explore three practical strategies to help you make confident Forex trading decisions.
4.1. Confirming market trends
One of the most effective ways to use the bulls and bears power indicators is for riding trends. There’s a real satisfaction that comes from identifying and following strong market movements. When Bulls Power surges alongside rising prices and the EMA slopes upward, it’s a clear sign of a powerful bullish trend.
On the flip side, when Bears Power is deep below zero and continues to make new lows as prices tumble and the EMA slopes downward, this shows that sellers’ strength is overwhelming, confirming a solid bearish trend. This signal from the bull power and bear power indicator is very clear.
In Forex trading, this approach works well when trading major currency pairs like EUR/USD or GBP/JPY, where trends tend to be more stable and technical indicators like EMA and momentum tools are highly respected.
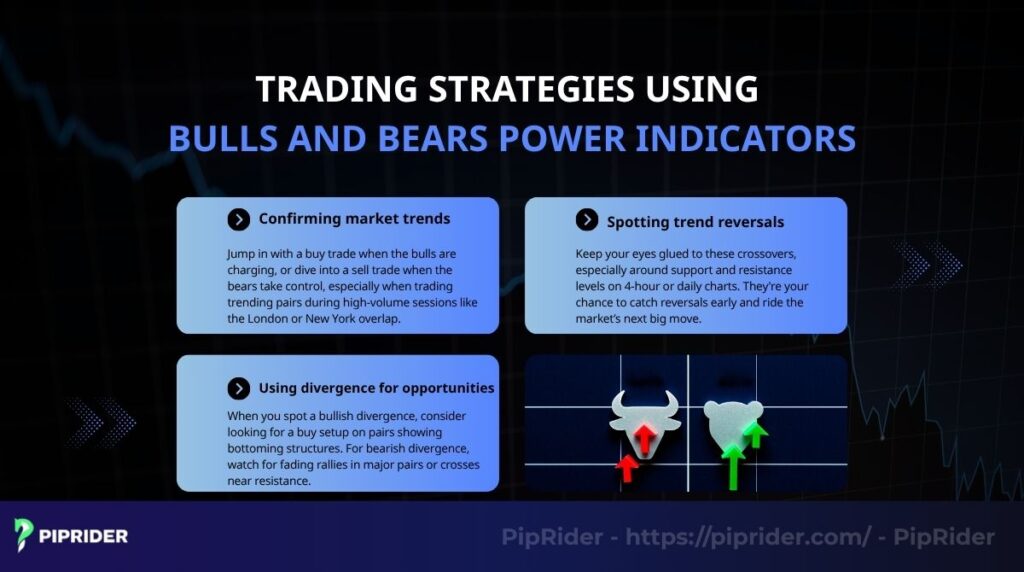
How to use: Jump in with a buy trade when the bulls are charging, or dive into a sell trade when the bears take control, especially when trading trending pairs during high-volume sessions like the London or New York overlap.
Tip for Forex traders: Always double-check the EMA’s direction. It’s like your trusty compass to confirm the trend’s strength and keep you on the right path!
4.2. Spotting trend reversals
Catching reversals is a key part of the bears and bulls indicator strategy. A potential buy signal appears when the EMA has already started to slope upwards, and Bears Power (which is below the zero line) stops making new lows and begins to rise towards the zero line. This indicates that sellers are losing their strength and a fresh bullish wave may be ready to begin.
On the other hand, a potential sell signal appears when the EMA has already started to slope downwards, and Bulls Power (which is above the zero line) stops making new highs and begins to fall towards the zero line. It signals a weakening in buying pressure, which could open the door to a bearish reversal.
This is particularly useful in Forex when spotting reversals after news events, like NFP or central bank announcements, where initial spikes often reverse sharply.
How to use: Keep your eyes glued to these crossovers, especially around support and resistance levels on 4-hour or daily charts. They’re your chance to catch reversals early and ride the market’s next big move.
Personal tip for Forex traders: I remember when I first started, I tried using the bears and bulls indicator strategy on the 15-minute chart and kept getting frustrated by noisy signals. It wasn’t until I moved to higher timeframes like the 4-hour chart that the reversal signals became much clearer and more reliable especially when trading volatile pairs like GBP/USD. That simple change made a huge difference in my trading results.
4.3. Using divergence for opportunities
Divergence stands out as a key signal in bulls and bears power analysis. In a bullish scenario, while the market price creates a deeper low, the Bears Power indicator reflects a shallower decline.
This suggests that even though the price is lower, the actual selling pressure is weakening, a thrilling hint that sellers are losing their grip and the market may be poised for a bullish reversal.
In contrast, the bulls vs bears indicator signals a bearish divergence when market prices climb to a fresh high, but the Bulls Power indicator registers a weaker high. It feels like the buyers are running out of steam despite the higher price, signaling that a dramatic market shift could be ahead.
For Forex traders, divergence is especially powerful when combined with price action around key psychological levels like 1.1000 or 145.00, where reversals often occur.
How to use: When you spot a bullish divergence, consider looking for a buy setup on pairs showing bottoming structures. For bearish divergence, watch for fading rallies in major pairs or crosses near resistance.
Tip: Pair these signals with support and resistance levels to sharpen your aim. It’s like adding a laser scope to your trading rifle for pinpoint accuracy.
4.4. Summary
The bears and bulls indicator strategy offers versatile ways to trade in the Forex market, from confirming trends to spotting reversals and divergences. These tools empower Forex traders to make informed decisions based on momentum shifts and market psychology, two of the most crucial forces driving price action in currency pairs.
5. Advantages and limitations of bulls and bears power indicators
I’ve always found it exciting to explore tools like bulls and bears power indicators because they simplify complex market dynamics. However, like any trading tool, they have strengths and weaknesses. Let’s break down what makes these indicators shine and where they might fall short to help you use them wisely.
5.1. Advantages
The bulls vs bears indicator offers clear benefits for traders at any level.
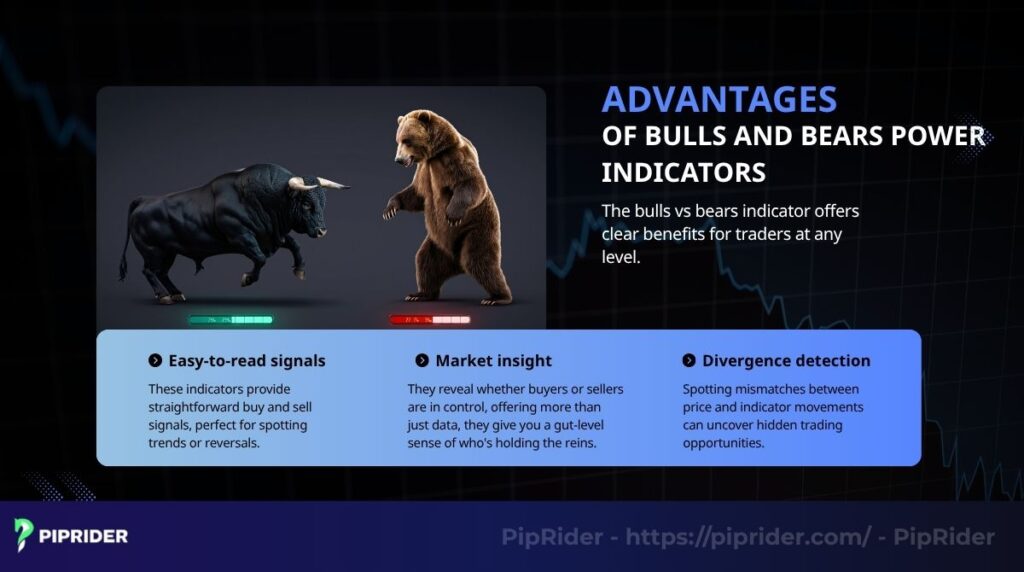
- Easy-to-read signals: These indicators provide straightforward buy and sell signals, perfect for spotting trends or reversals.
- Market insight: They reveal whether buyers or sellers are in control, offering more than just data, they give you a gut-level sense of who’s holding the reins. In those moments of doubt, when the market feels like it’s pulling you in every direction, this clarity can feel like a breath of fresh air, grounding your decisions in something real.
- Divergence detection: Spotting mismatches between price and indicator movements can uncover hidden trading opportunities.
5.2. Limitations
No tool is perfect, and these indicators have their challenges.
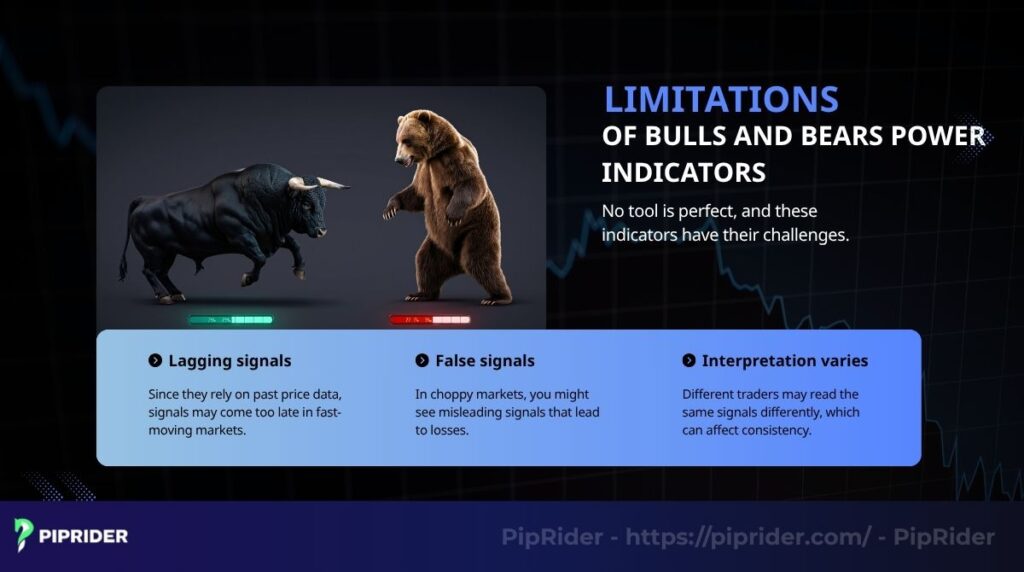
- Lagging signals: Since they rely on past price data, signals may come too late in fast-moving markets.
- False signals: In choppy markets, you might see misleading signals that lead to losses.
- Interpretation varies: Different traders may read the same signals differently, which can affect consistency.
Over time, I’ve learned to pair bulls and bears indicators with other tools like support and resistance zones, just to hear a clearer signal through the market’s noise. This simple habit has saved me from countless bad trades and just as importantly, from emotional burnout.
Summary: The bulls and bears power indicator is like a trusted friend in the wild, unpredictable world of Forex always by your side, helping you make sense of the chaos. It shines a light on market dynamics when everything else feels uncertain, offering clarity in moments of doubt.
Like a trusted friend, it’s there for you, brimming with insights that light up your path with hope. Still, flaws and all, I find myself relying on it time and again. Because in a market full of noise and pressure, having a tool that almost understands what you’re feeling can make all the difference.
Pairing it with other strategies feels like teaming up with a seasoned guide, helping you navigate the market’s twists and turns with greater confidence and precision.
6. Tips for maximizing bulls and bears power indicators
Using bulls and bears power indicators feels like having a secret weapon, but only if you know how to wield it. I’ve spent countless hours tweaking my approach to these tools, and the right habits can make all the difference. Here are practical tips to help you get the best results from these indicators.
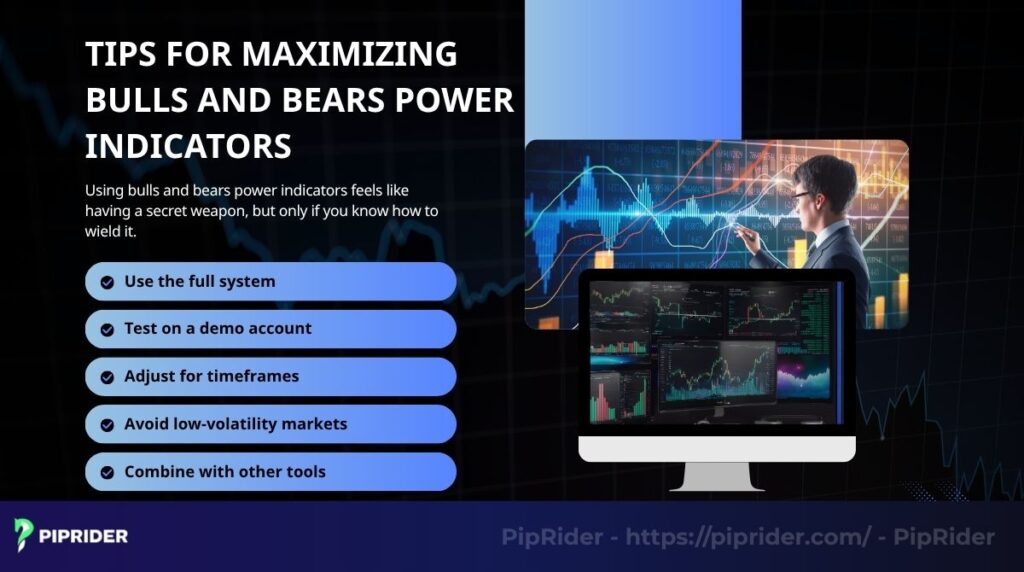
6.1. Use the full system
Combine Bulls Power, Bears Power, and the 13-period EMA, as they’re designed to work together for clearer signals.
6.2. Test on a demo account
Think of it as your training ground, a safe space where mistakes don’t cost you sleep or money. Practicing your strategies in a risk-free environment helps build the kind of quiet confidence every trader needs before facing the real pressure of live markets.
6.3. Adjust for timeframes
Every trader has a rhythm like a heartbeat that syncs with the market’s flow. If you’re the kind who thrives on fast decisions and lives for the adrenaline of quick trades, a shorter EMA like the 9-period can feel like an extension of your instincts.
But if you breathe easier with patience and precision, the 20-period EMA might feel more like home, guiding your swing trades with quiet confidence. I’ve learned sometimes the hard way that when your tools match your temperament, trading stops feeling like a fight… and starts feeling like a conversation you were meant to have.
6.4. Avoid low-volatility markets
I’ve been there, eyes locked on a jagged chart, the screen’s glow pulling me in, my heart racing with every flickering candle, yearning for a breakout that feels so close it hums in my bones. It’s like standing in a quiet field, gazing at a sky streaked with golden clouds, each one whispering promises of rain that could bring the world to life.
Choppy markets sing with a mischievous charm, teasing with sudden bursts of motion that light a fire of hope in your chest. Even when they fade, leaving you to question your instincts or your carefully laid plans, there’s a stubborn spark inside a quiet thrill that keeps you chasing the next move, certain the tide will turn.
Yet, there’s a quiet strength in waiting for clearer trends, a patient kind of courage that feels dull in the moment but wraps you in calm, like a steady hand guiding you through the fog.
6.5. Combine with other tools
No single indicator holds all the answers. I’ve found real peace of mind by pairing bulls and bears indicators with support/resistance or RSI, it’s like having a second opinion before making a big decision. That extra confirmation often makes all the difference between acting with doubt and trading with conviction.
I’ve found that testing setups on historical data helps me spot patterns that work. Patience and practice are key to mastering these indicators.
Summary: Maximizing the potential of the bull power and bear power indicator comes down to consistent practice. By using the complete system, testing it diligently on a demo account, and combining it with other tools, you can build a more robust and reliable trading process.
7. Frequently asked questions
8. Conclusion
Exploring bulls and bears power indicators feels like unlocking a secret to understanding the Forex market’s pulse. I’ve seen firsthand how these tools can transform a trader’s ability to read market trends and make confident decisions.
From setting them up on your charts to applying strategies like trend confirmation or divergence, these indicators are versatile and beginner-friendly. I encourage you to experiment with them on a demo account to find what works for you. Visit the Pip Rider blog, especially our Best technical indicators and For Beginner sections, to keep learning and growing as a trader.
Infographic Section
-
Bulls and Bears Power Indicators -

Trading Strategies with Bulls and Bears Power Indicators -

Bulls and Bears Power Indicators: Pros, Cons and Strategic Combinations


