
Bulls Power and Bears Power, collectively known as the Elder-Ray Index, measure the absolute strength of buyers and sellers relative to a 13-period Exponential Moving Average (EMA). Professional traders utilize these momentum oscillators to mathematically confirm established trends, spot weakening momentum, and identify structural divergence near potential market turning points.
Crucially, the Elder-Ray Index is designed as a confirmation tool, not a standalone entry signal. This guide deconstructs the underlying formula, core signals, and actionable strategies to effectively integrate these indicators into a high-probability trading system.
Key Takeaways
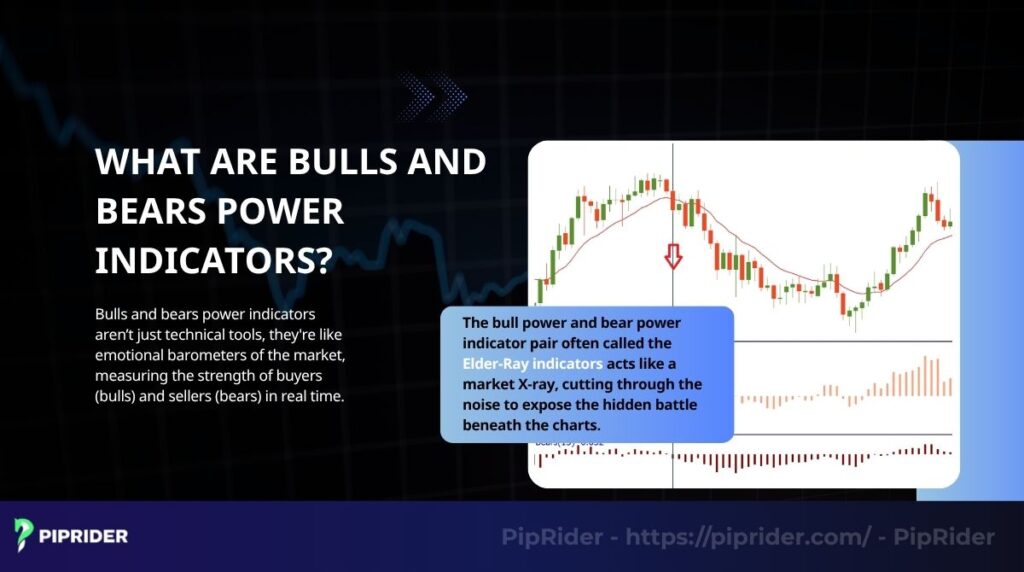
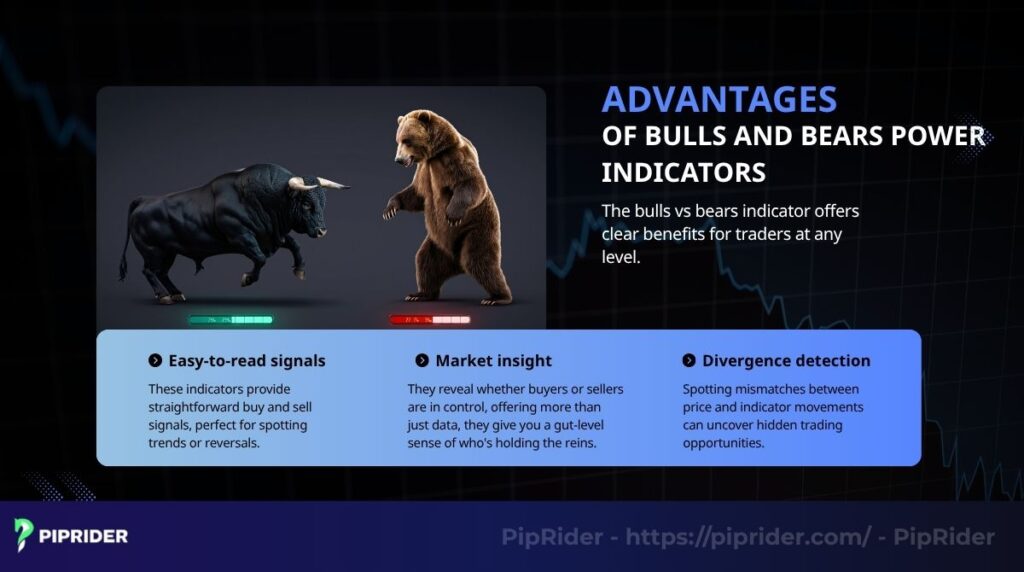
- Understanding market dynamics: Bulls and Bears Power indicators, also known as Elder-Ray indicators, measure the strength of buyers (bulls) and sellers (bears), providing a clear view of market sentiment and control.
- Simple calculations: These indicators use a 13-period Exponential Moving Average (EMA) to quantify buyer and seller strength, with Bulls Power (High – EMA) and Bears Power (Low – EMA) offering straightforward insights.
- Versatile strategies: Use these indicators for confirming trends, spotting reversals, and identifying divergences, making them suitable for both beginners and experienced traders.
- Strengths and limitations: They provide clear signals and divergence detection but may lag in fast markets or produce false signals in choppy conditions, so pairing with other tools is recommended.
- Pro Tips: Combine with support/resistance or RSI, test on demo accounts, adjust timeframes to match trading style, and avoid low-volatility markets for best results.
1. What are Bulls and Bears Power indicators or the Elder-Ray Index?
Bulls and Bears Power indicators are momentum oscillators designed to measure the absolute strength of buyers and sellers relative to a 13-period Exponential Moving Average (EMA). Collectively known as the Elder-Ray Index, these tools act as a diagnostic “X-ray” of market sentiment, allowing traders to quantify the buying and selling pressure behind every price movement.
Quick Definition: Elder-Ray Index
- Also called: Bulls Power and Bears Power Indicators.
- Mechanism: Measures buyer and seller strength relative to a 13-period Exponential Moving Average (EMA).
- Best for: Trend confirmation, identifying momentum exhaustion, and spotting structural divergence.
- Professional Rule: Designed strictly as a confirmation tool; should not be used alone.
The “X-Ray” Logic of Market Sentiment
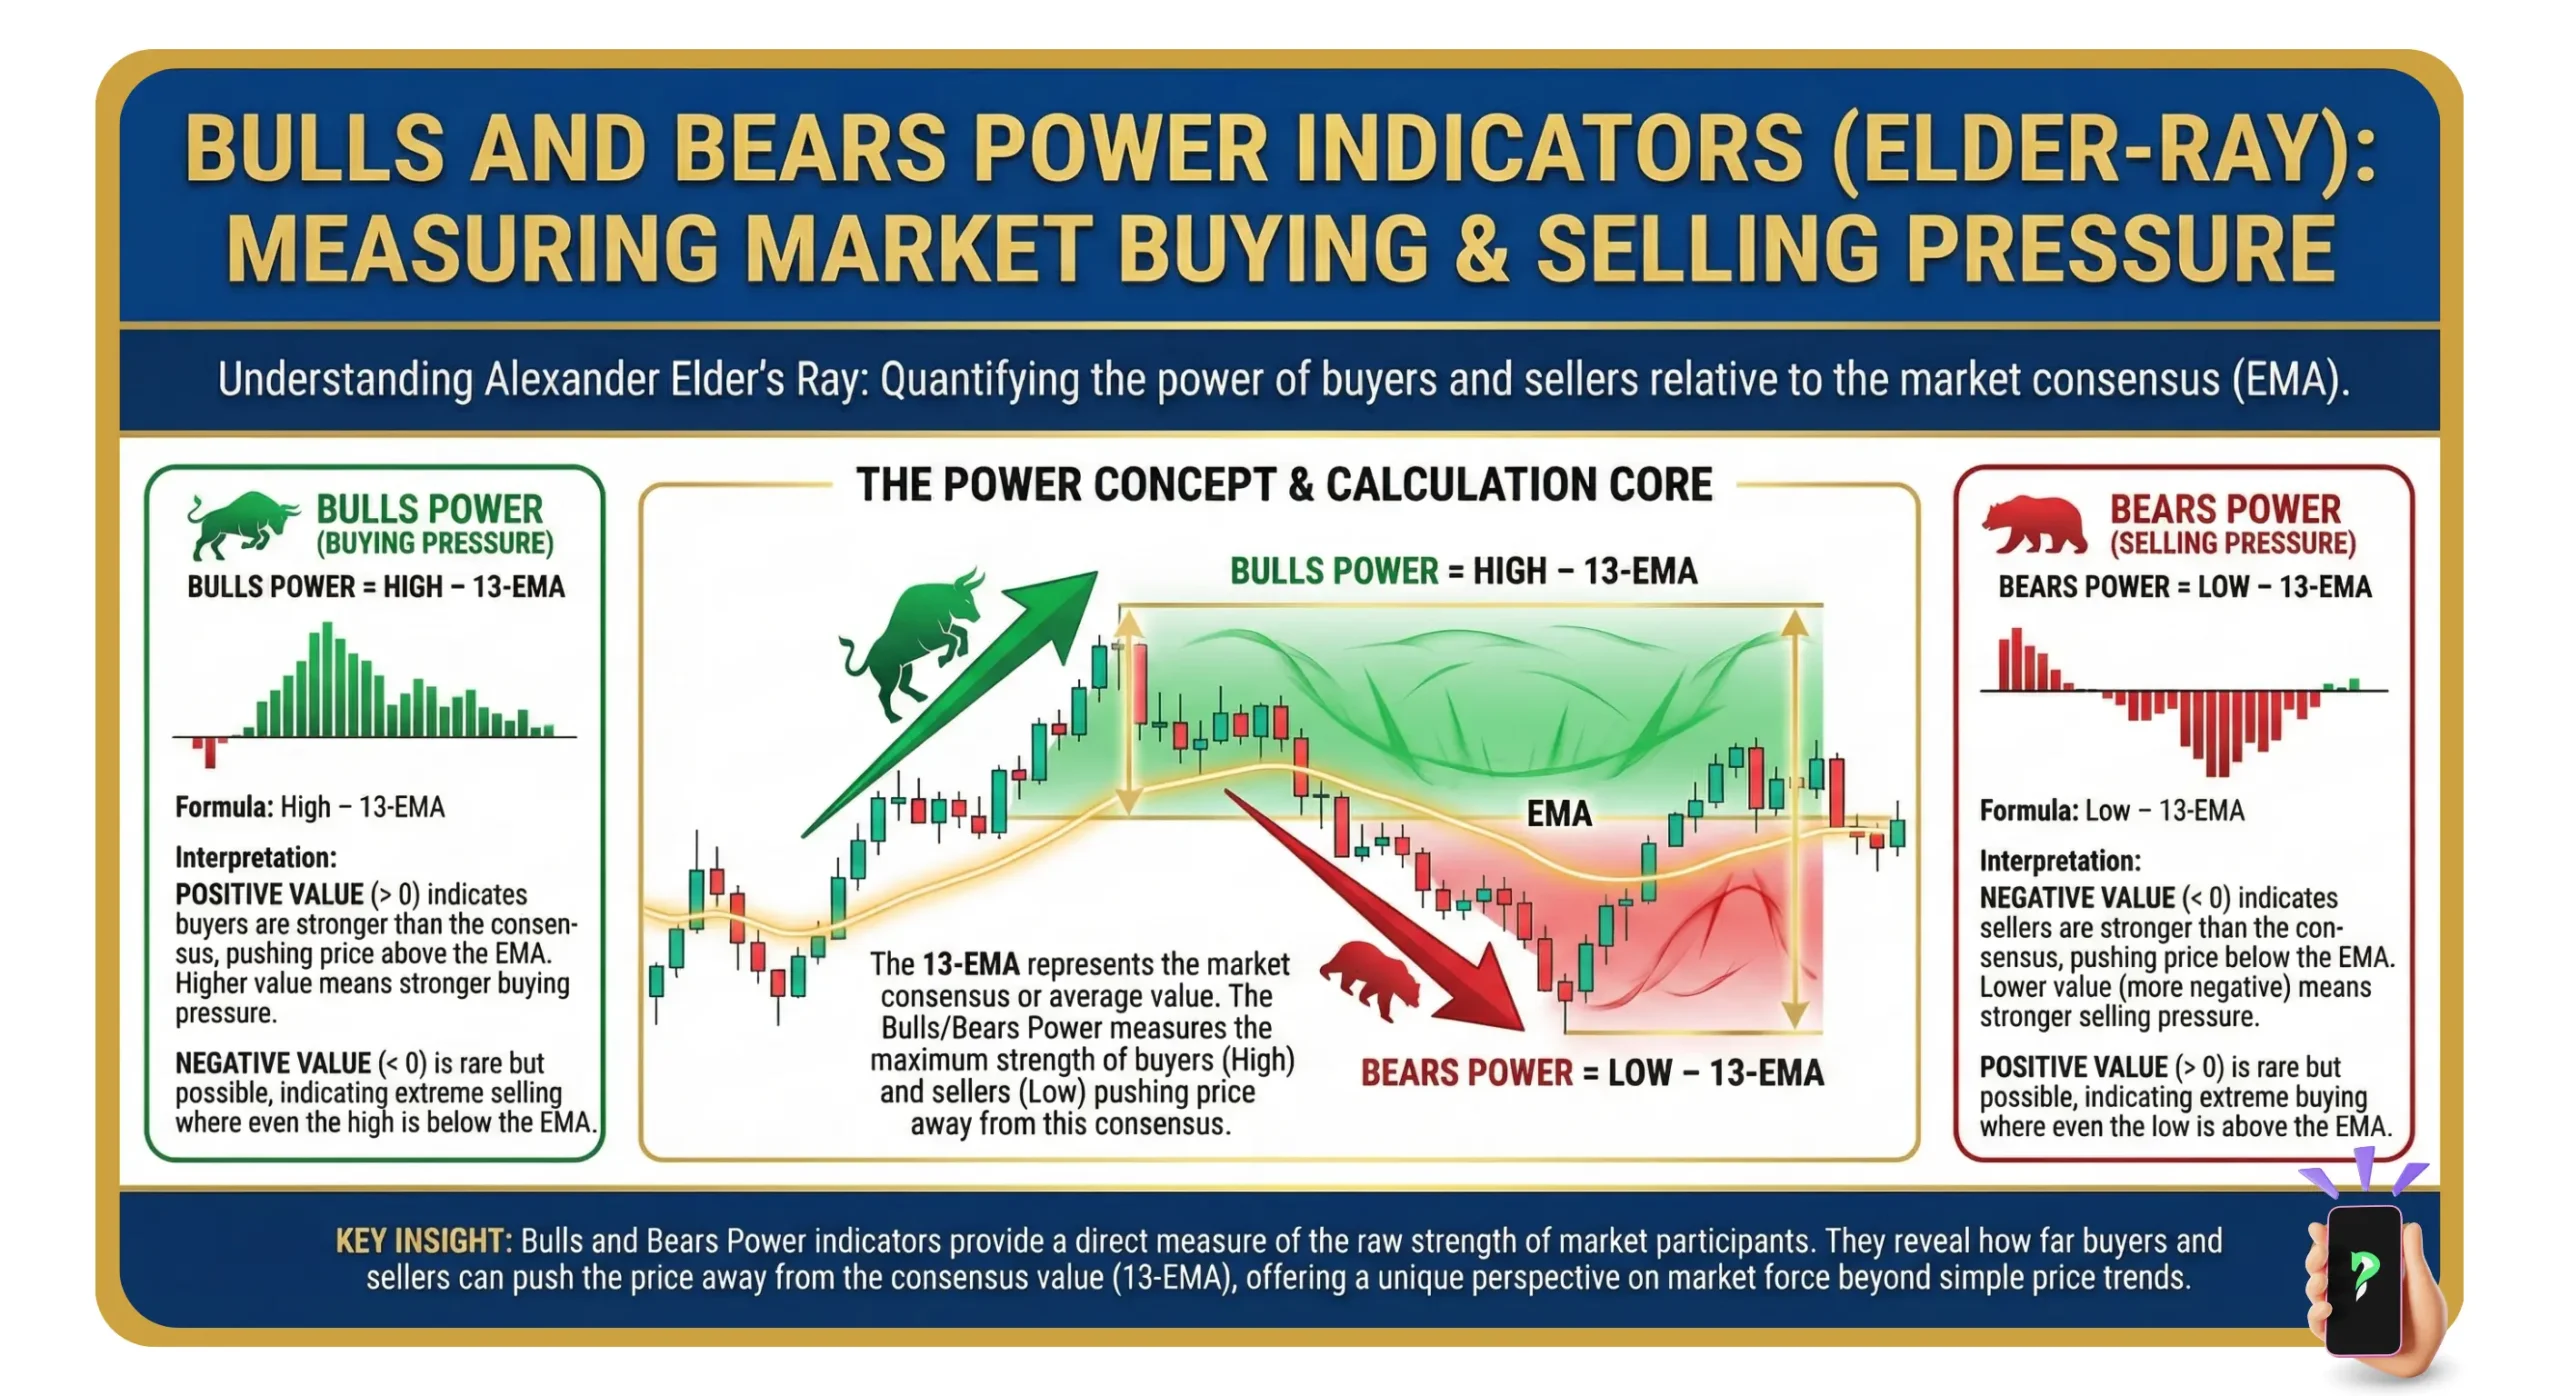
Introduced by Dr. Alexander Elder in his 1993 classic Trading for a Living, the Elder-Ray Index is based on the premise that price represents a consensus of value, while the 13-period EMA represents the average consensus of value.
- Bulls Power: Quantifies the capacity of buyers to push prices above the average consensus (the EMA). It serves as a mathematical gauge of the maximum buying pressure within a specific period.
- Bears Power: Quantifies the capacity of sellers to drive prices below the average consensus. It reveals the maximum selling pressure exerted against the baseline.
By analyzing the distance between the period’s extremes (Highs and Lows) and the 13 EMA, the indicator strips away market noise. This allows traders to see “under the hood” of price action, identifying whether the dominant side is gaining or losing the structural momentum required to sustain a trend.
2. How are Bulls and Bears Power indicators calculated
Understanding the underlying calculation of the Elder-Ray Index is essential for interpreting momentum shifts. While modern trading platforms automate these computations, the logic resides in the relationship between price extremes and the 13-period Exponential Moving Average (EMA).
2.1. The Core Formulas
The Elder-Ray Index consists of two distinct mathematical components:
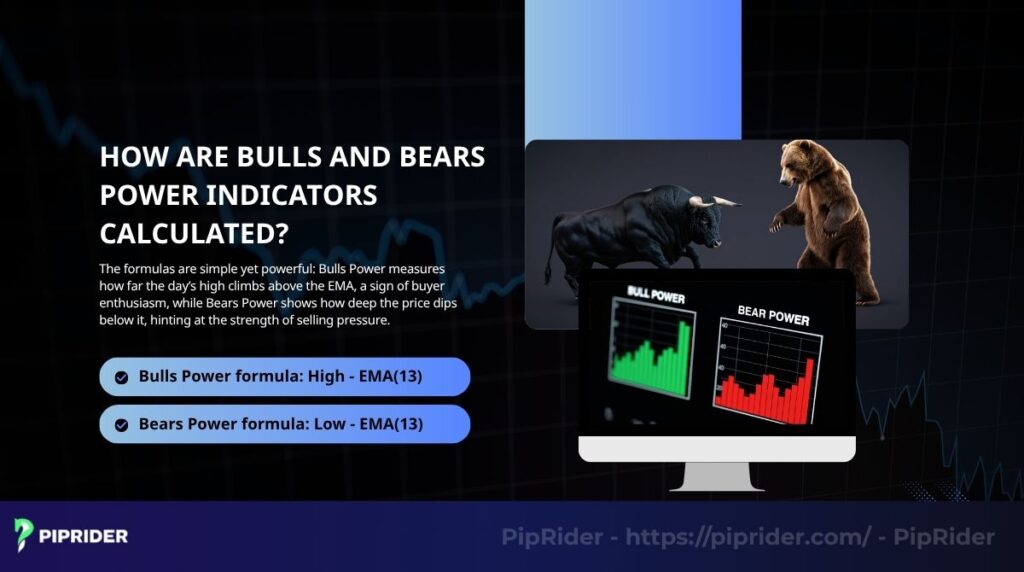
Bulls Power: Quantifies the distance between the period’s highest price and the 13-period EMA.
Bulls Power = High – 13-period EMA
Bears Power: Quantifies the distance between the period’s lowest price and the 13-period EMA.
Bears Power = Low – 13-period EMA
2.2. Calculation Summary Table
The following table provides a concise summary of the Elder-Ray Index components, outlining the specific mathematical inputs required and their corresponding significance in determining structural market sentiment:
| Component | Mathematical Input | Market Significance |
|---|---|---|
| Bulls Power | High – 13-period EMA | Measures the maximum capacity of buyers to push price above the average consensus. |
| Bears Power | Low – 13-period EMA | Measures the maximum capacity of sellers to drive price below the average consensus. |
| 13-period EMA | Exponentially Weighted Average | Represents the “fair value” or the baseline market consensus over the last 13 periods. |
2.3. Practical Insight
Most professional traders do not calculate these values manually. What matters is the conceptual understanding: Bulls Power measures how strongly price can push above the EMA, while Bears Power measures how strongly price can push below it.
When these values are positive, the market extremes are above the average; when negative, they are below. The widening or narrowing of these distances (the histogram bars) provides an objective view of whether the dominant side is gaining or losing the strength required to sustain the current market structure.
3. Trading Strategies: The Institutional Setup Playbook
In professional trading, technical indicators are ineffective without a strict execution framework. The Elder-Ray Index provides high-probability signals only when combined with market structure analysis and rigid risk management rules.
Below is the definitive playbook for executing three core setups using the Bulls and Bears Power indicators.
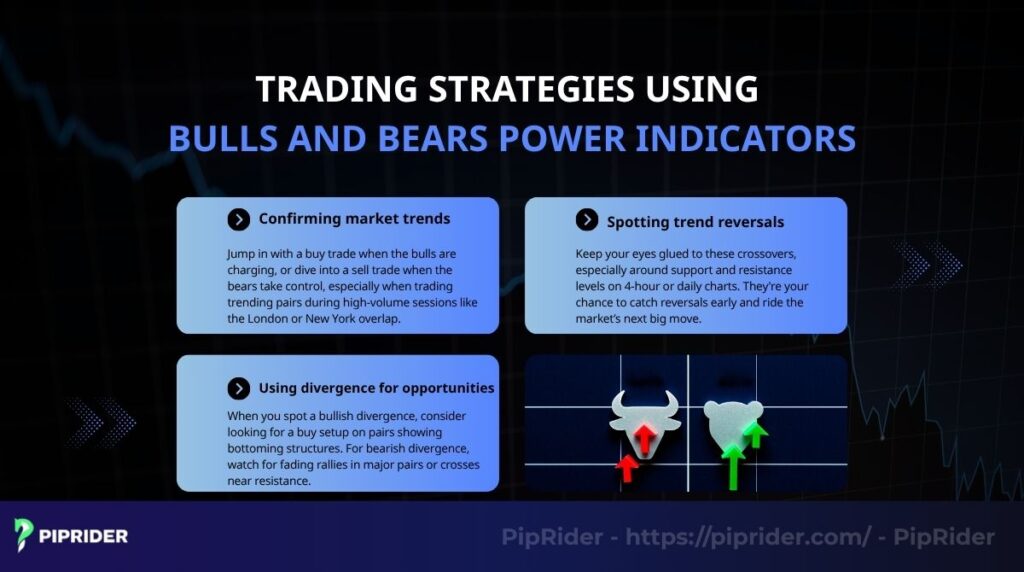
3.1. Strategy 1: Trend Confirmation Setup
This setup capitalizes on established institutional order flow. By aligning the 13 EMA’s slope with the absolute strength quantified by Bulls or Bears Power, traders can objectively validate trend health and execute high-probability pullback entries without guessing.
- Best for: Trend-following traders.
- Use when: Price action aligns directionally with the 13 EMA, and the Bulls/Bears Power oscillators validate the underlying buying or selling strength.
- Buy idea: The 13 EMA is steeply sloping upward. Bulls Power sustains above the zero line or creates a higher high, while price action simultaneously maintains a bullish market structure.
- Sell idea: The 13 EMA is sloping downward. Bears Power sustains below the zero line or creates a deeper low within a confirmed downtrend.
- Entry trigger: Wait for a structural pullback to conclude. Execution is validated by a continuation candlestick pattern (e.g., engulfing or pin bar) returning to the direction of the dominant trend.
- Stop-loss: Placed structurally just outside the most recent swing low (for longs) or swing high (for shorts).
- Avoid when: Price action is trapped in a sideways consolidation phase and the 13 EMA is completely flat.
3.2. Strategy 2: Reversal Weakness Setup
This setup acts as an early detection system for fading institutional momentum. By identifying when Bulls or Bears fail to push their power lines to new extremes despite ongoing price movement, traders can anticipate structural shifts before the broader market reacts.
- Best for: Traders targeting early, validated reversals.
- Use when: Bears Power stops creating deeper lows despite prevailing price weakness, or Bulls Power fails to create stronger highs even as the price continues its upward trajectory.
- Entry trigger: Never front-run the oscillator. Execution requires strict price action confirmation, such as a rejection at a major support/resistance zone or a minor break of structure (BOS) on the price chart.
- Stop-loss: Placed strictly outside the absolute extreme (the highest peak or lowest trough) of the reversal zone.
- Avoid when: The weakness signal is only visible on the indicator without any definitive price action confirmation.
3.3. Strategy 3: The Divergence Setup
Divergence exposes the hidden discrepancy between price action and underlying volume. When price pushes into new structural territory but the power indicators fail to confirm, it mathematically signals retail momentum exhaustion and a lack of institutional liquidity.
- Best for: Reversal and swing traders capitalizing on momentum exhaustion.
- Bullish divergence: Price action forms a lower low (LL), but the Bears Power indicator forms a shallower low (Higher Low). This proves that actual selling pressure is evaporating.
- Bearish divergence: Price action forms a higher high (HH), but the Bulls Power indicator forms a weaker high (LH). This indicates that buying volume is drying up despite the higher price.
- Entry trigger: Execution is validated by a definitive reversal candlestick or a minor break of structure occurring exactly at a key historical or psychological liquidity level.
- Stop-loss: Placed immediately outside the extreme divergence pivot.
- Avoid when: Divergence occurs in the middle of a massive, highly impulsive trend without the price touching a key macroeconomic or structural level.
4. Practical Case Studies: Institutional Execution
To master the Elder-Ray Index, we must analyze its performance during verified historical market shifts. The following case studies utilize actual price action data from 2023 and 2024 to demonstrate high-probability execution.
Case Study 1: Bullish Divergence on EUR/USD (Oct – Nov 2023)
This study highlights the identification of a macro-structural reversal after a 3-month bearish cycle.
- Market Context: In early October 2023, EUR/USD hit a multi-month liquidity floor. On October 3, the pair printed a definitive low at 1.0448.
- The Signal: Throughout late October, price action remained stagnant near the 1.0500 handle, attempting to retest the lows. However, the Bears Power indicator printed a series of Higher Lows (HL), creating a clear Bullish Divergence. This mathematically confirmed that sellers lacked the momentum to drive prices back to the 1.0448 extreme.
- Confirmation: On November 1, 2023, following the Federal Open Market Committee’s decision to maintain interest rates (Federal Reserve, 2023), a decisive bullish engulfing candle closed above the 13-period EMA (TradingView, 2023).
- Execution Parameters:
- Entry: 1.0580 (Post-FOMC daily close).
- Stop-Loss: 1.0440 (Below the Oct 3 structural low).
- Target: 1.0850 (Prior major resistance), hit on Nov 21, 2023.
- The Lesson: Divergence at a psychological level like 1.0450 is a lead indicator of institutional accumulation. When price fails to follow the indicator’s weakness, a reversal is imminent.
Case Study 2: Trend Continuation on GBP/JPY (May 2024)
This study demonstrates the “Resilience Setup” during the height of the 2024 Yen Carry Trade.
- Market Context: In May 2024, GBP/JPY was in a violent parabolic uptrend. Following the Ministry of Finance’s record ¥9.79 trillion intervention executed by the Bank of Japan in early 2024 (Ministry of Finance Japan, 2024), the pair recovered toward the 193.00 zone.
- The Signal: Between May 7 and May 10, 2024, the pair underwent a standard corrective pullback. Crucially, while the price dipped toward the 13-period EMA, Bulls Power remained resiliently above zero. This proved that despite the intraday profit-taking, the institutional “Buy-the-Dip” order flow remained dominant.
- Confirmation: On May 10, a H4 hammer candle rejected the 13 EMA baseline, followed by Bulls Power printing a fresh, higher peak.
- Execution Parameters:
- Entry: 194.50 (On the breakout of the hammer candle high).
- Stop-Loss: 193.20 (Below the local corrective low).
- Target: 199.00 (Major psychological extension), achieved by May 22, 2024.
- The Lesson: In a high-velocity trend, the indicator’s strongest signal is positive resilience. If Bulls Power stays above zero during a pullback, the trend is fundamentally healthy and offers a low-risk re-entry.
5. The Institutional Decision Framework: Optimal Market Environments
Even the most accurate technical indicator is mathematically destined to fail if deployed in the wrong market regime. To protect capital and maximize win rates, professional traders run the Elder-Ray Index through a strict environmental filter.
Here is the definitive framework dictating exactly when to execute and when to stay flat.
5.1. Where the Elder-Ray Index Excels (High-Probability)
The Bulls and Bears Power indicators provide the highest statistical edge under these specific conditions:
- Trending Markets: The system is inherently designed to measure momentum, making it highly accurate for riding established macroeconomic trends rather than fighting the tape.
- Higher Timeframes (H4 & D1): Operating on the 4-Hour and Daily charts allows institutional order flow to neutralize intraday algorithmic noise, generating vastly more reliable signals.
- EMA Confluence: Win rates surge when trade execution strictly aligns with the directional slope of the baseline 13-period EMA.
- Structural Liquidity Zones: The indicator’s power is multiplied when signals (especially divergence) occur exactly at major historical support or resistance levels.
- Exhaustion Detection: It excels at identifying the exact moment an aging trend loses institutional backing near major turning points.
5.2. Where the Elder-Ray Index Fails (Low-Probability)
Traders will experience severe drawdowns if they attempt to force setups in the following environments:
- Sideways Consolidation: When the market is range-bound and the 13 EMA is completely flat, the oscillators will repeatedly cross the zero line, generating continuous false signals (whipsaws).
- Low-Volatility Sessions: During historically illiquid periods (e.g., the mid-Asian session or global bank holidays), the mathematical output becomes erratic and untradable.
- Micro Timeframes (M15 and below): Without rigorous secondary filtering, relying on these indicators on 1-minute to 15-minute charts exposes the trader to massive high-frequency trading (HFT) noise and liquidity sweeps.
- Trading in Isolation: The Elder-Ray Index is blind to macro price structure. Relying solely on the oscillator without mandatory price action validation is a critical error.
- Forcing Signals: Attempting to front-run the indicator (e.g., predicting a divergence before the candlestick definitively closes) consistently leads to trapped positions.
6. Indicator Comparison: Bulls and Bears Power vs. RSI vs. MACD vs. Awesome Oscillator
Professional traders do not rely on a single technical tool. Building a robust trading system requires understanding the mathematical differences between momentum oscillators to avoid indicator redundancy.
While the Elder-Ray Index is highly effective, it serves a different structural purpose compared to other popular momentum indicators. The table below breaks down the optimal use cases, core strengths, and primary limitations of each tool.
| Indicator | Best For | Core Strength | Primary Weakness |
|---|---|---|---|
| Bulls & Bears Power (Elder-Ray) | Quantifying absolute buyer-seller pressure and identifying structural divergence. | Measures extreme price action (Highs/Lows) relative to a dynamic baseline (13 EMA). | Can generate excessive algorithmic noise and false signals if traded in isolation. |
| RSI | Identifying overbought/oversold conditions and mean reversion zones. | Highly intuitive for beginners; operates on a strict, normalized 0-100 scale. | Frequently remains trapped in extreme zones for extended periods during strong macro-trends. |
| MACD | Capturing momentum crossovers and macro-trend transitions. | Delivers clean, easily readable signals for trend continuation and momentum shifts. | Inherently slower (lagging) due to its reliance on the convergence/divergence of multiple moving averages. |
| Awesome Oscillator (AO) | Visualizing broader momentum shifts across market cycles. | Offers a simple, zero-line histogram view based on mid-prices (SMA 5 and 34). | Less specific regarding absolute high/low buying or selling pressure compared to the Elder-Ray Index. |
Which Indicator is Best for Beginners?
For novice traders, the RSI (Relative Strength Index) (Wilder, 1978) generally provides the most intuitive starting point due to its fixed boundaries and straightforward overbought/oversold logic.
However, as a trader evolves from basic concepts to understanding true institutional order flow, the Bulls and Bears Power indicators become a vastly superior tool. Rather than simply indicating that a market is “overextended,” the Elder-Ray Index actively decodes the underlying mechanics of who is currently dominating the tape—the buyers or the sellers (Elder, 1993).
(Pro Tip: For optimal market analysis, combine the extreme pressure readings of the Elder-Ray Index with the trend transition signals of the MACD to build a comprehensive, multi-timeframe strategy).
7. Advantages and Limitations: A Professional Assessment
Technical indicators are tools of probability, not certainty. To integrate the Elder-Ray Index into a professional trading system, traders must balance its high-resolution momentum insights against its inherent mathematical constraints. This objective evaluation ensures the indicator is used only in environments where it provides a statistical edge.
7.1. Strengths: The Institutional Edge
The Elder-Ray Index provides a unique “X-ray” of market dynamics by measuring the absolute power of buyers and sellers relative to a moving baseline. This structural approach offers several key advantages for disciplined traders who prioritize trend confirmation and precision.
- High-Resolution Momentum: By measuring the distance between price extremes (Highs/Lows) and the 13 EMA, it quantifies the “maximum reach” of market participants. This offers deeper insight into market conviction than standard oscillators that only utilize closing prices.
- Leading Reversal Signals: The system is exceptionally effective at spotting structural divergence. It often provides an objective warning of trend exhaustion or “momentum fade” well before price action confirms a full reversal.
- Objective Market Filtering: When combined with the 13-period EMA, the indicator creates a binary filter. This helps traders eliminate low-probability setups that lack sufficient institutional backing or directional volume.
- Immediate Visual Clarity: The histogram format allows for rapid recognition of momentum shifts. Traders can instantly see whether buying or selling pressure is expanding or contracting without needing to interpret complex numerical data.
7.2. Limitations: Where the System Fails
Despite its strengths, the Elder-Ray Index is a derivative of moving averages and carries specific risks. Understanding these limitations is critical to protecting capital during unfavorable market regimes or periods of high volatility.
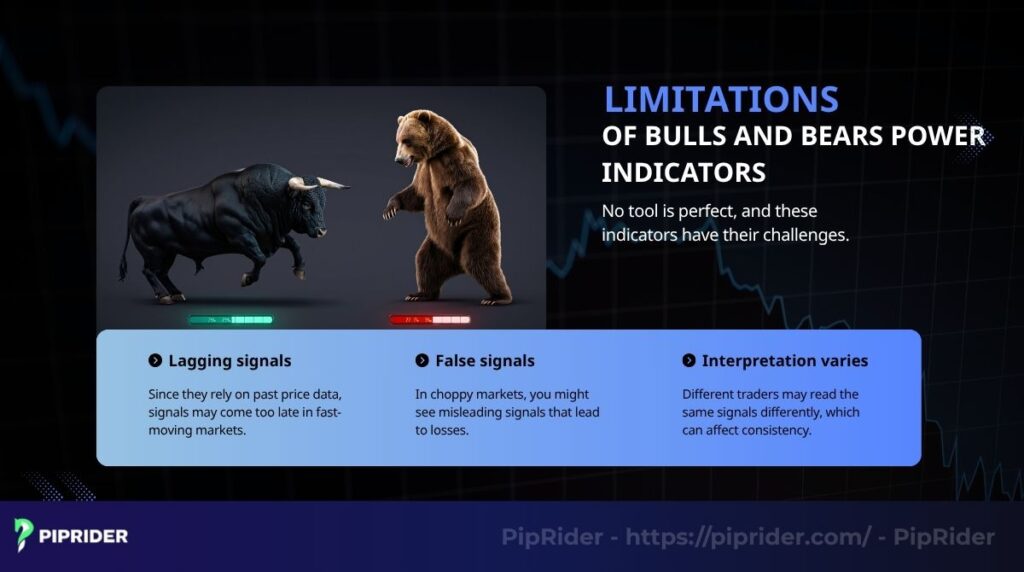
- Inherent Mathematical Lag: As a reactive tool, the signals are naturally delayed compared to raw price action. In high-velocity reversals or “V-shaped” recoveries, the indicator may only confirm the move after a significant portion of the price action has already occurred.
- Whipsaws in Consolidation: During “choppy” or sideways markets where the 13 EMA is flat, the oscillators lose their predictive power. This leads to a high frequency of false zero-line crosses, which can result in excessive drawdowns for trend-following strategies.
- Vulnerability to Liquidity Shocks: Sudden spikes in volatility (such as high-impact news events like CPI or NFP) can cause extreme readings in Bulls and Bears Power. These readings often reflect temporary panic rather than a sustainable shift in the macro trend.
- Context Dependency: The indicator is “blind” to macroeconomic levels and historical price structure. Signals occurring in a vacuum, without confirmation from major support/resistance zones, carry a significantly lower win rate and should be treated with caution.
8. Platform Configuration: Setting Up the Elder-Ray Index
While the mathematical logic of the Elder-Ray Index is advanced, deploying it on modern trading terminals takes only seconds. Professional traders use the following strict configuration checklist to maintain clean, readable charts:
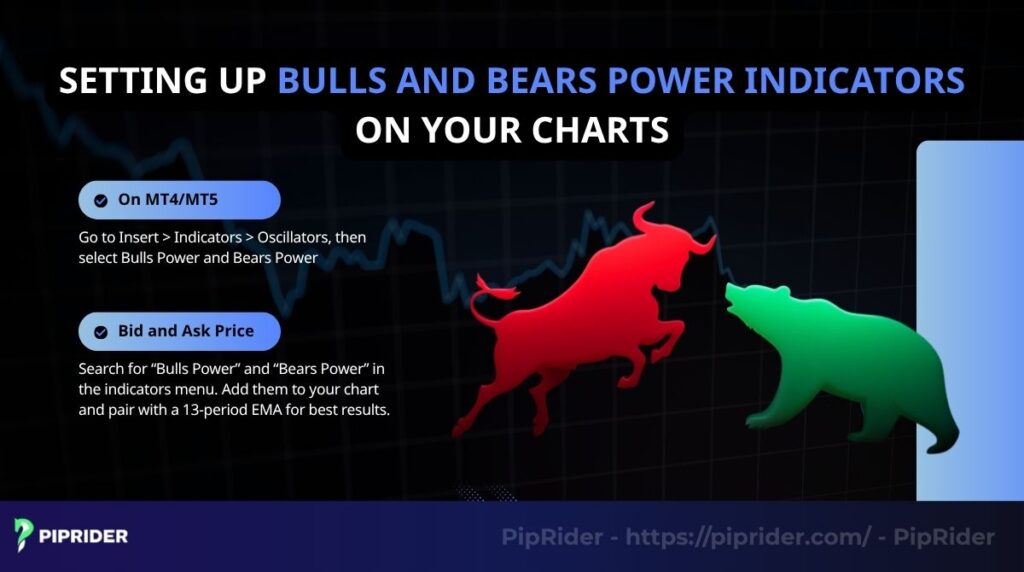
- MetaTrader 4/5 (MT4/MT5): Navigate to
Insert > Indicators > Oscillators. Select both Bulls Power and Bears Power. Ensure the baseline calculation period is strictly set to13. - TradingView: Open the Indicators tab and search for Bulls Power and Bears Power. Note: You must manually add a Moving Average Exponential (EMA) to the main price window and configure its length to
13to serve as the directional baseline. - Visual Calibration (Pro-Tip): Color-code the oscillator histograms to instantly reflect order flow (e.g., bright green for Bulls, deep red for Bears). This eliminates cognitive delay, allowing for instant visual recognition of momentum shifts without reading the raw numerical data.
9. Best Practices for Trading the Elder-Ray Index
Professional traders rely on strict operational rules to maximize the efficiency of technical indicators. To avoid common pitfalls and increase your win rate, adhere strictly to these core execution principles:
- Deploy the Complete System: Never trade Bulls or Bears Power in isolation. Always use both oscillators simultaneously alongside the 13-period EMA to capture the complete spectrum of market momentum.
- Optimize for Higher Timeframes (H4/D1): Prioritize the 4-Hour and Daily charts. Lower timeframes are heavily saturated with algorithmic noise, making the indicator’s signals unreliable.
- Avoid Low-Volatility Environments: Stay flat during sideways, range-bound markets or historically illiquid trading sessions. The Elder-Ray Index is a momentum tool and will produce continuous false signals (whipsaws) without directional volume.
- Require Structural Confirmation: Never front-run the oscillator. Always validate momentum signals with underlying price action, major support/resistance zones, or secondary filters like the RSI.
- Execute Mandatory Forward-Testing: Before risking live capital, rigorously backtest your setups and forward-test them in a simulated (demo) environment to build statistical confidence in your execution framework.
10. Frequently asked questions
11. Conclusion
The Bulls and Bears Power indicators (Elder-Ray Index) provide a precise mathematical lens for quantifying buyer and seller strength against a 13-period EMA baseline. Its primary value lies in identifying momentum exhaustion and structural divergences that are invisible on standard price charts.
To achieve consistent results, treat the Elder-Ray Index as a confirmation layer, not a standalone signal. Success depends on the discipline to wait for confluence at major liquidity zones and the commitment to rigorous backtesting. Mastered correctly, this system provides the clarity required to execute high-probability trades with institutional-grade precision.
Visit the PipRider blog, especially our Best technical indicators and For Beginner sections, to keep learning and growing as a trader.
Infographic Section
-
Bulls and Bears Power Indicators -

Trading Strategies with Bulls and Bears Power Indicators -

Bulls and Bears Power Indicators: Pros, Cons and Strategic Combinations


