
Discovered by Scott Carney in 2000, the Crab Pattern is a precise harmonic structure designed to pinpoint extreme market reversals. Unlike basic setups, it utilizes a unique 1.618 Fibonacci extension to identify “stop hunt” zones where trends exhaust. This guide covers the essential validation rules and execution strategies to trade the Crab successfully across stocks, Forex, and cryptocurrencies.
Key Takeaways
- A five-point harmonic pattern that signals high-probability reversals at extreme price action levels.
- Comes in two forms: a Bullish Crab (signaling a bullish reversal) and a Bearish Crab (signaling a bearish reversal).
- Defined by a critical 1.618 Fibonacci extension levels of the initial XA leg.
- Provides a clear trading plan with a precise entry zone (PRZ) and risk management levels.
- Applicable in the stock market, forex, and crypto.
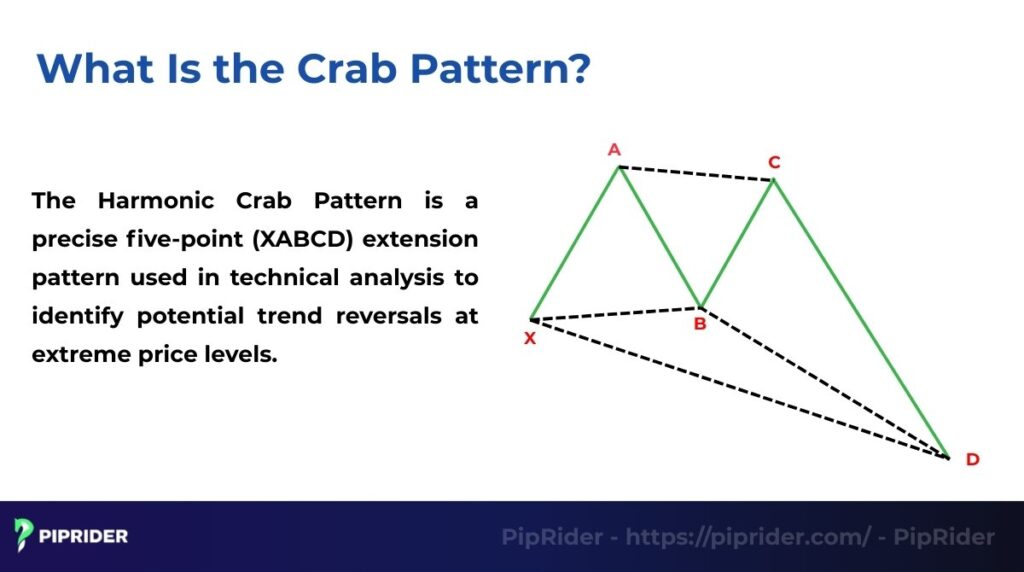
1. What Is the Crab Pattern?
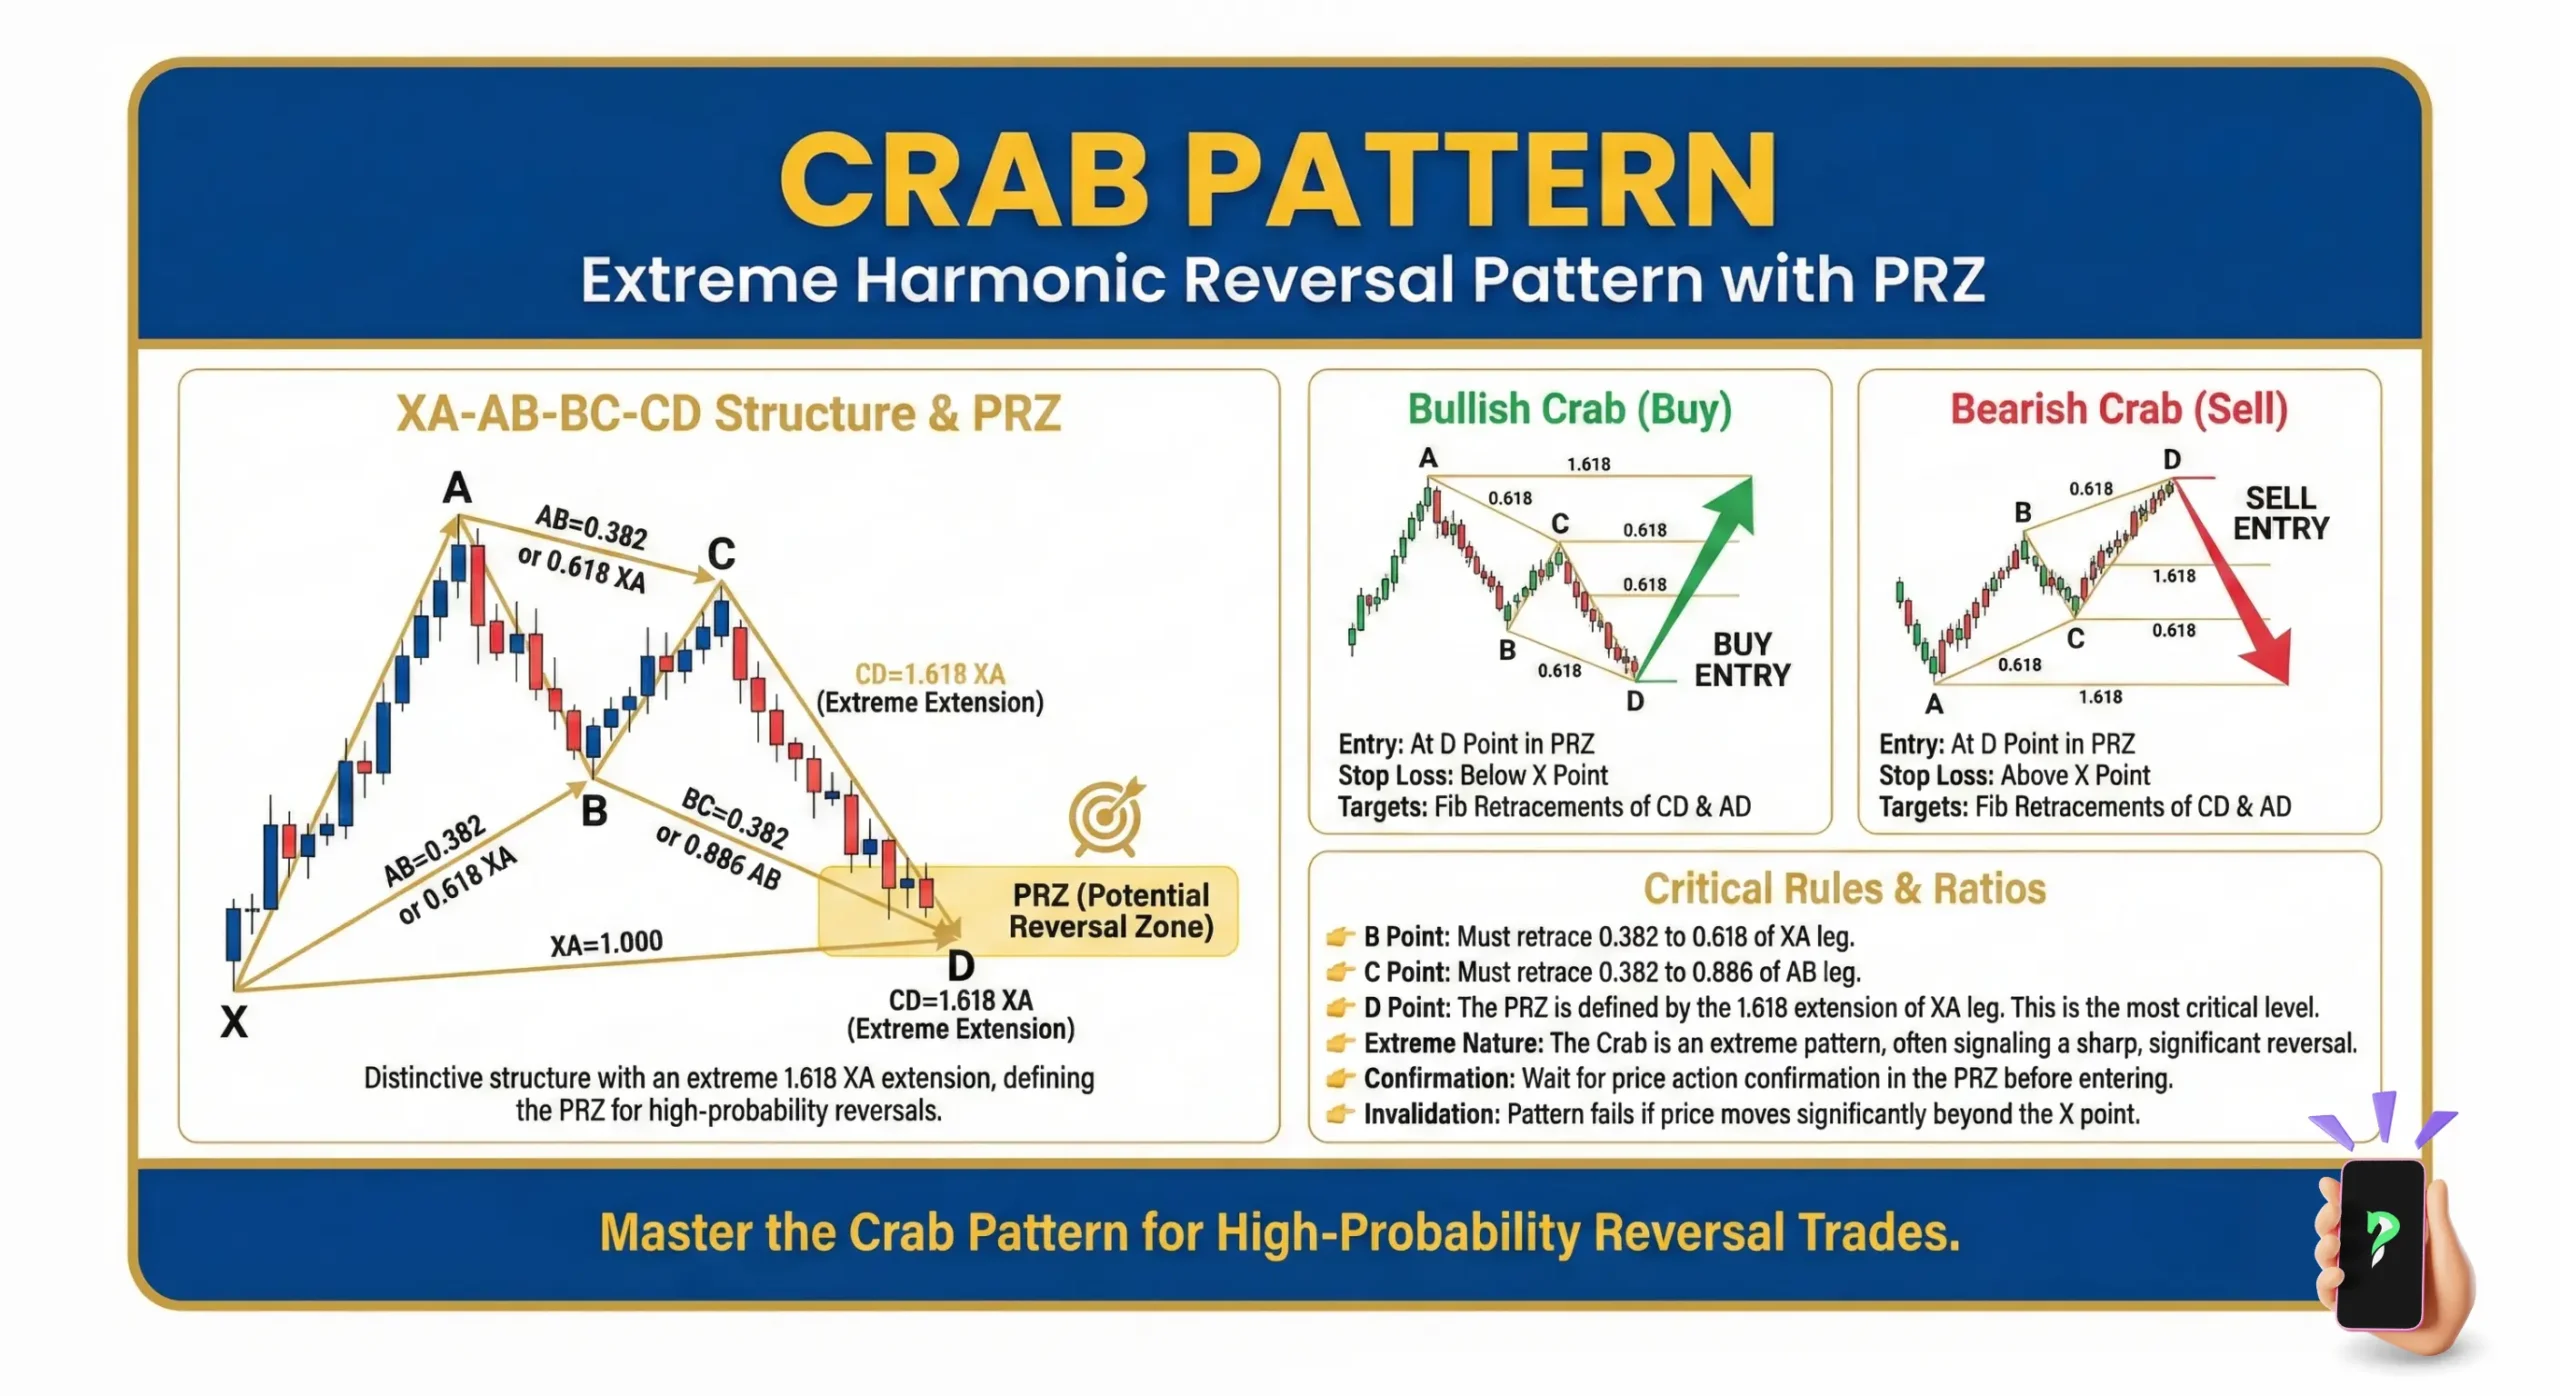
The Harmonic Crab Pattern is an advanced 5-point chart formation used in technical analysis to identify precise trend reversals. It is distinct from other harmonic structures due to its extended final leg, which signals that a market move has become overstretched.
Crab Pattern at a Glance:
- Pattern Type: Reversal (Bullish or Bearish).
- Key Feature: Extreme 1.618 Fibonacci extension in the CD leg.
- Discovery: Discovered by Scott Carney in 2000.
- Goal: To define a Potential Reversal Zone (PRZ) where price is likely to snap back.
- Markets: Applicable to Forex, Crypto, Stocks, and Indices across all timeframes.
Unlike basic patterns, the Crab does not guarantee a reversal solely by its shape. It serves as a high-probability alert, identifying a zone where traders should look for confluence (such as RSI divergence or candlestick confirmation) before entering a trade.
2. Key Components & Variations
The Crab pattern is defined by a 5-point structure (X, A, B, C, D) creating four distinct legs. Unlike basic trading patterns, the Crab requires strict adherence to specific measurements to be valid.
2.1. The Two Variations
The pattern appears in two forms depending on the trend direction. Instead of relying on subjective shapes like “M” or “W”, professional traders identify them by the location of the final point D:
- Bullish Crab: This forms during a downtrend. The structure begins at a high point X and ends at a new extreme low at point D. A reversal here signals a potential rally to the upside.
- Bearish Crab: This forms during an uptrend. The structure begins at a low point X and ends at a new extreme high at point D. A reversal here signals a potential drop to the downside.
In both versions, the sharp extension of the final CD leg is the hallmark trait that indicates market exhaustion.
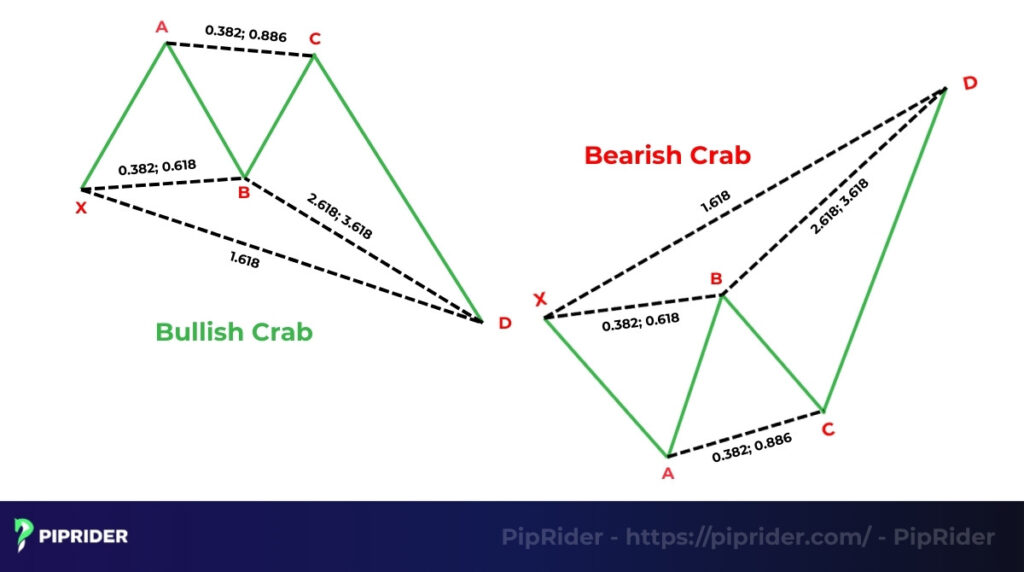
2.2. The Ratios Cheat Sheet (Validation Rules)
To validate a Crab setup, traders must verify the specific Fibonacci relationships between the points. Use this table as the primary checklist.
| Pattern Segment | Measurement Rule | Role in Setup |
| B Point | 0.382 – 0.618 of XA | Defines the structure type. Note: If B touches 0.786, it is likely a Butterfly, not a Crab. |
| C Point | 0.382 – 0.886 of AB | Setup leg. Determines the projection range. |
| D Point (The Anchor) | 1.618 extension of XA | Critical Level: The most important rule. Price must hit this extreme to complete the pattern. |
| BC Projection | 2.24 – 3.618 | Confirmation: Acts as a secondary confirmation level within the reversal zone. |
The “Cluster” Concept:
Ideally, the 1.618 XA extension and the BC projection (e.g., 3.618) should align closely. This alignment creates a Potential Reversal Zone (PRZ), a specific price cluster where you look for trade entry signals.
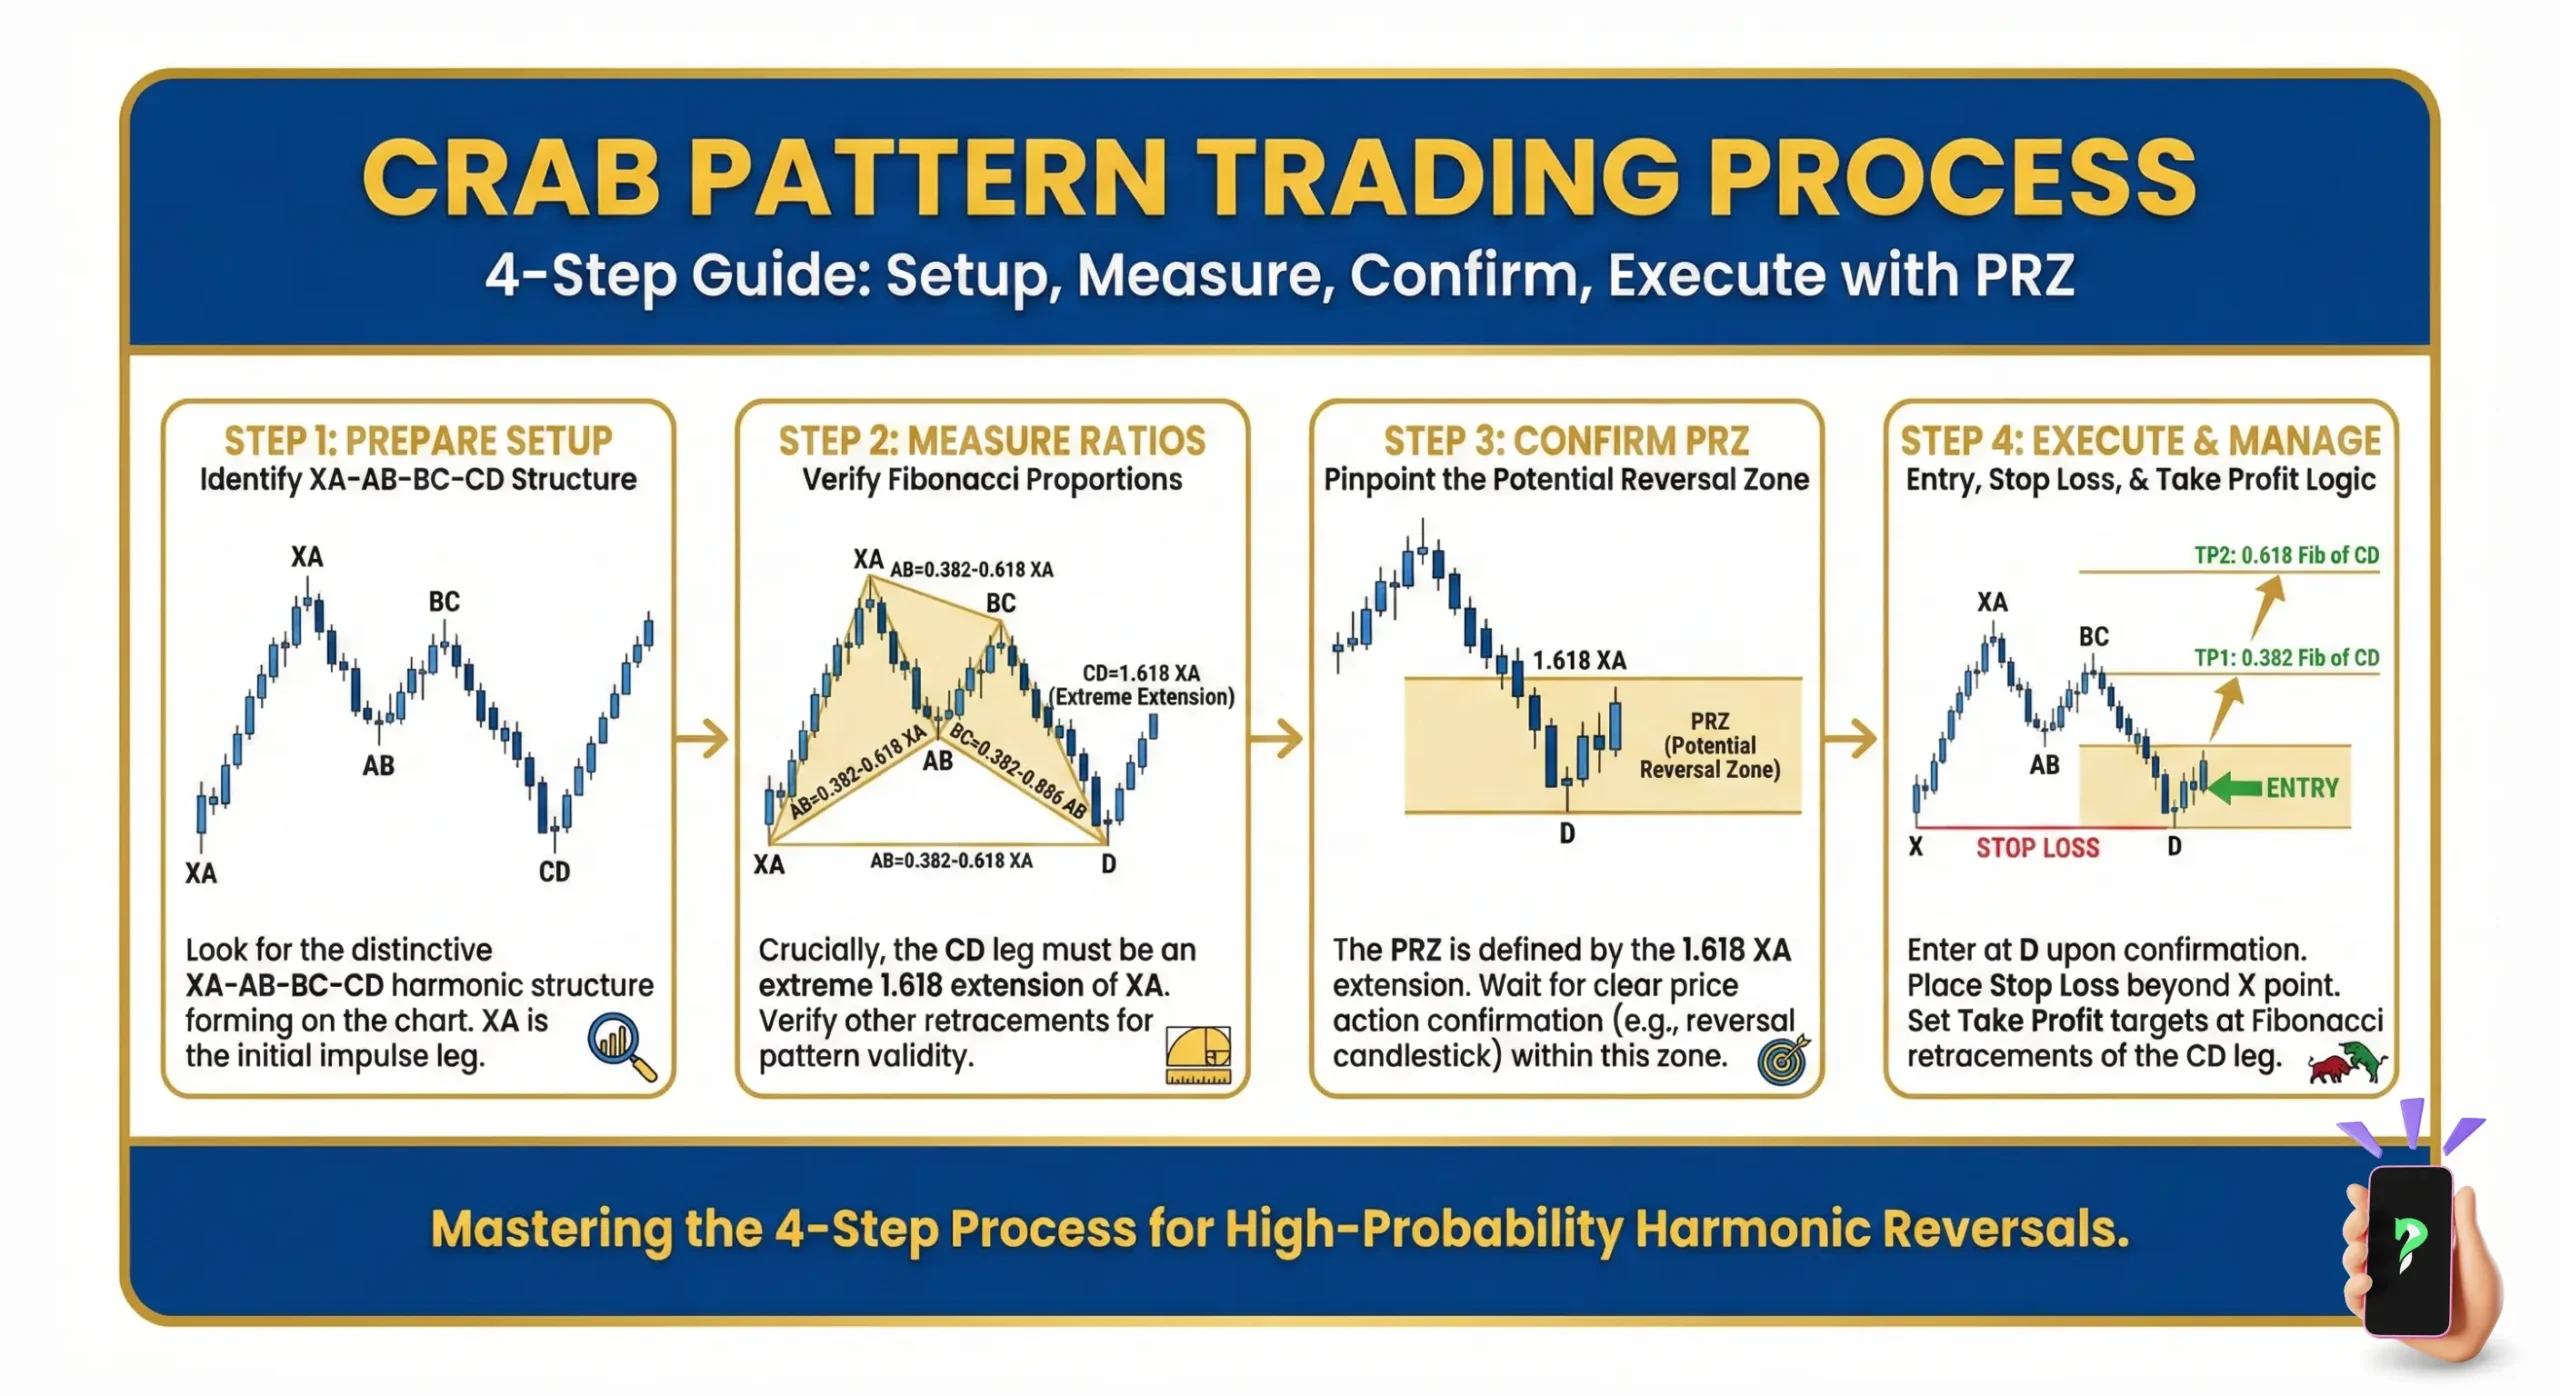
3. How to Identify the Crab Pattern
Identifying a valid Crab pattern requires a disciplined process of confirming both its visual shape and its precise Fibonacci measurements. The following checklist is used by technical analysts to filter out low-quality setups.
Step 1: Visual Scan (The “Extreme” Rule)
The identification process begins with a visual scan for a 5-point structure where the final leg is significantly longer than the others. Rather than relying on subjective shapes, traders focus on the extreme position of Point D:
- For Bullish Setups: Point D must extend below X, creating the lowest point of the chart structure.
- For Bearish Setups: Point D must extend above X, creating the highest point of the chart structure.
Step 2: Fibonacci Validation (The Filter)
Fibonacci tools are then applied to measure specific ratios. This step is critical for distinguishing the Crab from other harmonic look-alikes:
- Check the CD Extension (Must be 1.618): The final leg must hit the 1.618 extension of XA. This specific metric separates the Crab from the Butterfly (typically 1.272) or the Bat (a retracement pattern that remains within the XA range).
- Check the B Point Retracement (0.382 – 0.618): The B point generally indicates the structure type. If B retraces deeply to the 0.886 level, market analysis suggests a Deep Crab or a Bat pattern rather than a standard Crab.
Step 3: Confluence Confirmation
Finally, the Potential Reversal Zone (PRZ) is validated using technical indicators. Professional traders typically avoid entering positions unless at least one of the following conditions is met:
- Key Levels: The PRZ aligns with a major Support or Resistance zone.
- Divergence: Momentum indicators (RSI or MACD) show divergence as price approaches point D.
- Candlestick Signal: A clear reversal candle (e.g., Pin Bar, Engulfing) forms strictly at the 1.618 level.
4. Trading Strategy: Rules & Real-World Examples
Trading the Crab pattern requires a disciplined execution strategy centered around the Potential Reversal Zone (PRZ). Unlike basic support and resistance setups, successful harmonic trading relies on a precise three-step protocol: Trigger, Execution, and Management.
4.1. The Trigger (Confirmation)
Blindly entering a trade exactly at the 1.618 extension is considered a high-risk approach, often referred to as “catching a falling knife.” Professional strategies typically require specific confirmation signals before capital is committed:
- Candlestick Confirmation: Wait for a decisive reversal candle (e.g., Pin Bar, Hammer, or Bearish Engulfing) to close within the PRZ. This confirms that opposing pressure has entered the market.
- Indicator Divergence: The setup probability increases significantly if the RSI indicator shows divergence (e.g., price makes a higher high, but RSI makes a lower high) as price hits the D point.
4.2. Entry and Stop Loss (Risk Protocol)
Once the trigger is confirmed, the position is opened with strict risk parameters defined by the pattern’s limits.
Entry Strategy:
- Conservative: Enter a Market Order only after the confirmation candle closes.
- Aggressive: Place a Limit Order at the 1.618 XA extension. This captures the exact wick but carries higher risk if momentum is strong.
Stop Loss (SL) Placement:
- The SL is placed just beyond the extreme of the PRZ logic.
- Invalidation Rule: The trade is considered invalid (failed) if the price closes decisively beyond the 2.0 Fibonacci extension of the XA leg. At this point, the harmonic structure is broken.
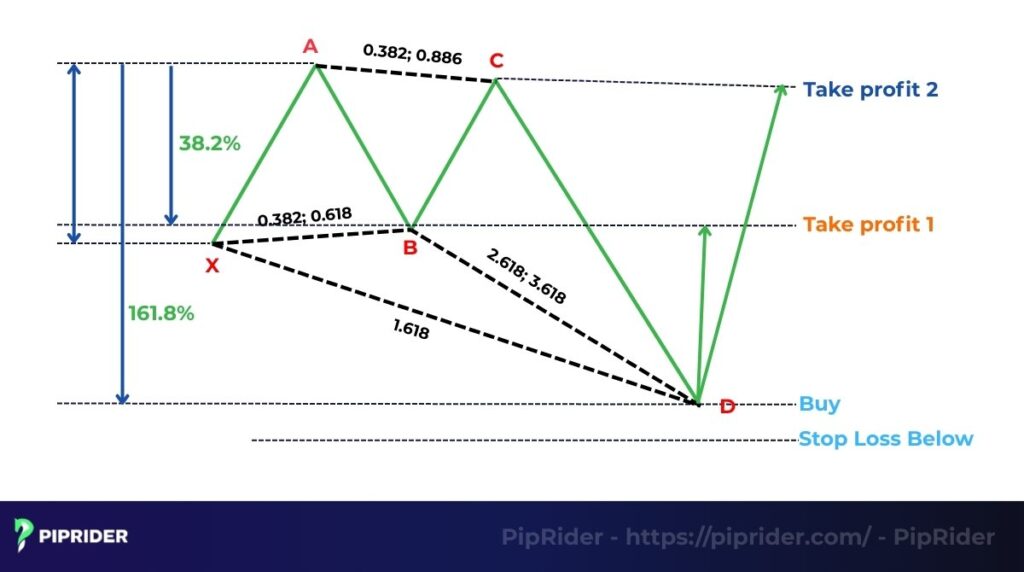
4.3. Profit Targets (The TP Ladder)
Harmonic traders typically utilize a scaling-out strategy to lock in gains while keeping a runner for potential trend reversals. Targets are measured based on the retracement of the AD leg (the entire move from A to D):
| Target Level | Fibonacci Level | Management Action |
| TP 1 (Conservative) | 0.382 of AD Leg | Close 50% of the position. Move Stop Loss to Breakeven. |
| TP 2 (Standard) | 0.618 of AD Leg | Close the majority of the remaining position. |
| TP 3 (Extended) | Re-test of Point A | Leave a small “runner” open if trend momentum is strong. |
Pro Tip: Always move your Stop Loss to the entry price (Breakeven) once TP1 is hit. This ensures that a profitable trade never turns into a loss (“Scratch Trade”).
4.4. Case Study 1 (Stock – Bullish)
In this scenario, we analyze a setup on a blue-chip stock where the pattern identifies a bottoming process after a prolonged downtrend.
The Trade Setup (Microsoft – MSFT)
- Market Context: The stock has been in a corrective downtrend for several weeks.
- Timeframe: Daily Chart (D1).
- Pattern Identification: The structure forms a new low, with the final CD leg extending aggressively to the 1.618 extension of the XA leg.
- The Trigger: A Bullish Hammer candle forms exactly at the PRZ, rejecting lower prices. Volume spikes on this candle, indicating institutional buying.
Execution Plan:
- Entry: Buy Order placed slightly above the high of the Hammer candle.
- Stop Loss: Placed just below the low of the Hammer (which aligns with the PRZ extreme).
- TP 1 (Conservative): 38.2% retracement of the AD leg (Risk removed).
- TP 2 (Extended): 61.8% retracement of the AD leg.
4.5. Case Study 2 (Forex – Bearish)
In this scenario, we look at a high-volatility Forex pair where the pattern identifies exhaustion after a parabolic rally.
The Trade Setup (GBP/JPY)
- Market Context: The pair is in a strong uptrend but showing signs of overextension.
- Timeframe: 4-Hour Chart (H4).
- Pattern Identification: The price makes a sharp “stop hunt” move, pushing to a new high that hits the 1.618 XA extension.
- The Trigger: A Bearish Pin Bar (Shooting Star) forms at the peak. RSI shows clear bearish divergence (price makes a higher high, RSI makes a lower high).
Execution Plan:
- Entry: Sell Stop order placed below the low of the Pin Bar.
- Stop Loss: Placed 15 pips above the high of the Pin Bar (invalidation point).
- TP 1 (Conservative): 38.2% retracement of the AD leg.
- TP 2 (Extended): 61.8% retracement of the AD leg.
5. Advantages and Limitations
No trading pattern is perfect. Understanding the specific strengths and weaknesses of the Crab structure is essential for realistic risk management and setting proper expectations.
5.1. The Advantages (Why Trade It?)
Why do professional traders favor this pattern over others? Here are the key technical benefits that make the Crab a staple in institutional strategies:
- Unmatched Precision: Unlike subjective chart patterns (like Head & Shoulders), the Crab relies on exact Fibonacci numbers. The 1.618 extension provides a specific “hard target” for entries, eliminating guesswork.
- Superior Risk-to-Reward (R:R): Because trades are entered at the extreme exhaustion point (1.618), the Stop Loss can be very tight. A successful reversal often yields a payout of 3:1 or 5:1 relative to the risk.
- “Stop Hunt” Exploitation: The pattern is designed to identify false breakouts. It allows you to enter exactly when amateur traders are getting trapped, putting you on the side of “Smart Money.”
5.2. The Limitations (The Risks)
However, the high reward comes with significant risks. Traders must be aware of the following structural and psychological challenges before executing a trade:
- Counter-Trend Danger: Trading the Crab means betting against a strong trend (catching a falling knife). If momentum is too strong, the price can blow through the 1.618 level without pausing.
- Strict Rules: The Crab is unforgiving. If the B-point is slightly off or the D-point falls short, the pattern is invalid. It requires patience and exact measurements, making it difficult for impatient traders.
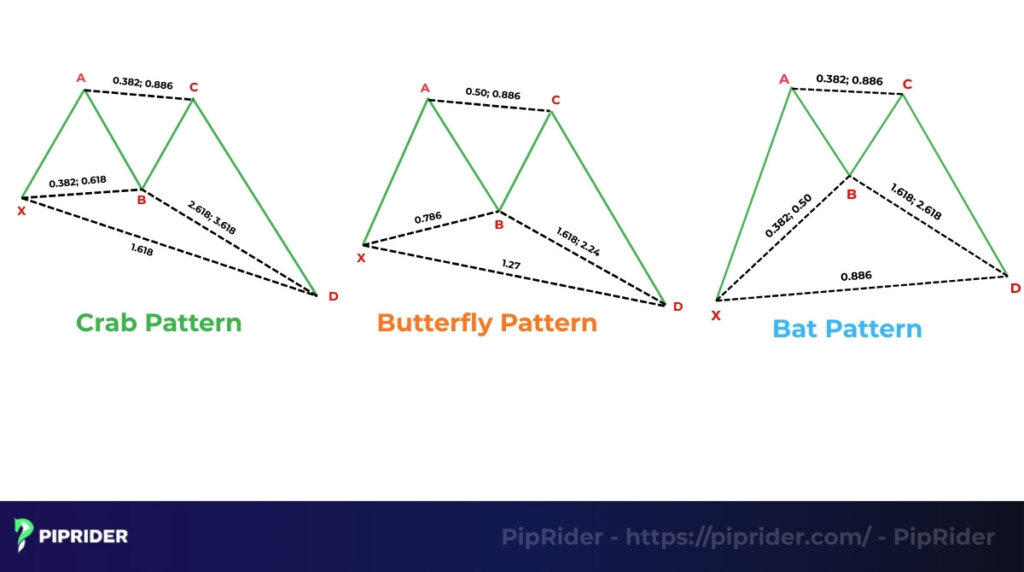
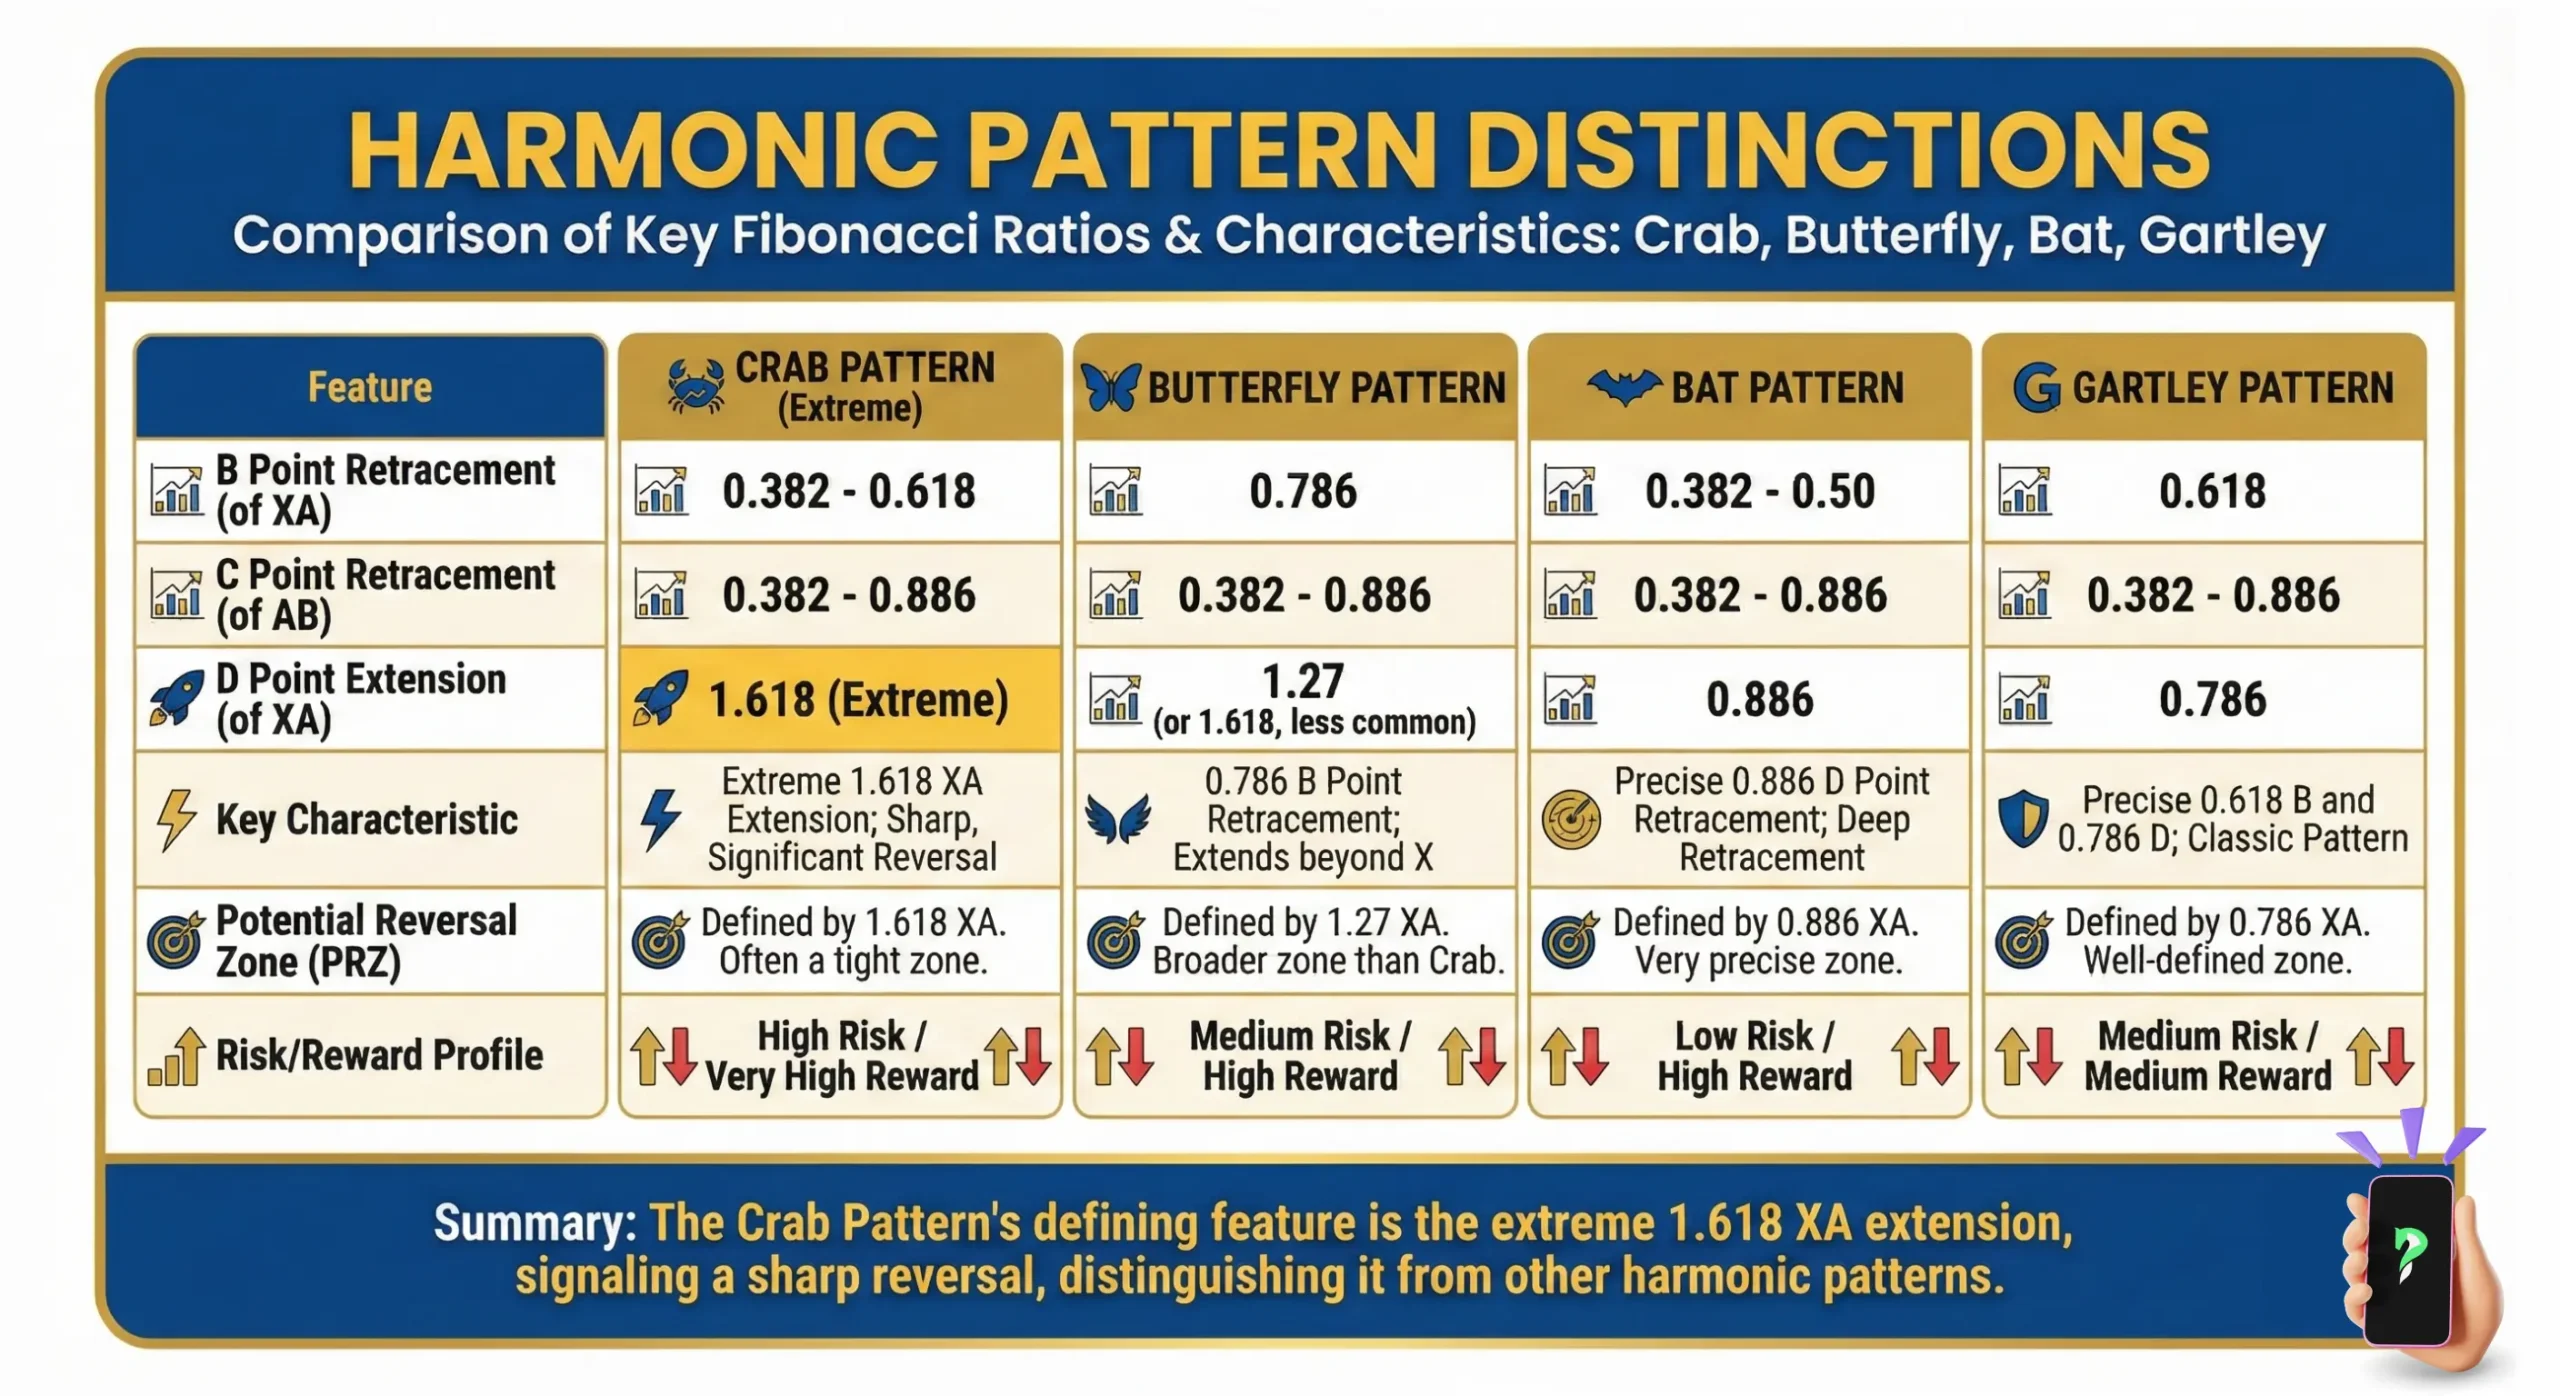
6. Crab vs. Other Harmonic Patterns
To identify patterns accurately, traders must distinguish the core Fibonacci ratios between different harmonic structures. The table below compares the Crab with its closest “look-alikes”: the Butterfly and the Bat.
Comparison Cheat Sheet:
| Feature | Crab Pattern 🦀 | Butterfly Pattern 🦋 | Bat Pattern 🦇 |
| Pattern Type | Extension (D goes far beyond X) | Extension (D goes slightly beyond X) | Retracement (D stays within XA) |
| B Point Retracement | 0.382 – 0.618 (Shallow) | 0.786 (Deep) | 0.382 – 0.50 (Shallow) |
| D Point Completion | 1.618 of XA (Extreme) | 1.272 of XA | 0.886 of XA |
| BC Projection (PRZ) | 2.24 – 3.618 (Violent Move) | 1.618 – 2.618 | 1.618 – 2.618 |
| Market Psychology | Exhaustion: Price is overextended and snaps back. | Discovery: Price breaks new ground but fails to hold. | Consolidation: Price respects the original range (X). |
Key Takeaway for Traders:
- Crab vs. Butterfly: Check the B point. If B retraces deeply to 0.786, it’s likely a Butterfly. If B is shallow (0.618 or less), anticipate a Crab.
- Crab vs. Bat: Check the D point. If price breaks above/below the X point, the Bat is invalid (failed), and the structure may be morphing into a Crab.
7. Critical Tactics: Mistakes & Pro Tips
To trade the Crab pattern successfully, traders must know not only how to execute valid setups but also how to filter out bad ones. Use these tactical rules to protect capital and improve strike rates.
7.1. Common Mistakes (What NOT To Do)
Even with a valid chart structure, human error can ruin the outcome. The following errors are the most frequent causes of losses among novice traders:
- The “Early Bird” Entry: Entering prematurely at the 1.27 or 1.41 extension due to FOMO. Correction: The Crab is an extreme pattern; patience for the 1.618 level is non-negotiable.
- Ignoring Momentum: Placing a Limit Order blindly against a high-impact news candle (e.g., NFP, CPI). Correction: Never stand in front of a spike. Always wait for a candle close inside the PRZ.
- Forcing the Pattern: Trading a setup where Point B is too deep (touching 0.786). Correction: If the ratios do not fit the cheat sheet exactly, discard the setup.
7.2. Invalidation Rules (The Hard Stop)
Knowing when to accept a loss is crucial for long-term survival. The harmonic structure is considered technically “broken” and invalid in the following scenarios:
- Level Violation: Price action closes decisively beyond the 2.0 Fibonacci extension of the XA leg.
- Structure Failure: The price consolidates (moves sideways) above the PRZ instead of reversing immediately. This suggests a breakout continuation rather than an exhaustion.
7.3. Pro Tips for Higher Win Rates
To separate high-probability setups from random market noise, professional analysts apply these specific filtering techniques:
- Use “Tick Volume” (Forex): Since Spot Forex lacks centralized volume, use tick volume as a proxy. A significant volume spike at the 1.618 level confirms smart money participation.
- Multi-Timeframe Sync: A Crab pattern on the H1/H4 chart has a significantly higher success rate if its PRZ aligns with a Key Support or Resistance level on the Daily chart.
- Divergence Confirmation: Never ignore the oscillators. RSI Divergence at the D-point is the strongest technical confirmation for a harmonic reversal.
8. Frequently Asked Questions (FAQs)
9. Conclusion
In conclusion, the Crab Pattern is a powerful but advanced tool that allows traders to identify high-probability reversals at extreme price action levels. With its distinct five-point structure and reliance on the 1.618 Fibonacci extension, it offers a clear, rule-based approach to trading, complete with defined entry, stop-loss, and profit objectives.
However, its main weakness is its rarity and the precision required for identification. We strongly advise that traders always wait for confirmation from other trading indicators and thoroughly practice identifying and trading the pattern on a demo account before risking real capital.
Infographic Section
-
Crab Pattern -
Comparison of Key Fibonacci Ratios and Characteristics -
Crab Pattern Trading Process


