
In the world of technical analysis, traders are constantly searching for clarity amidst the noise of market price fluctuations. The Exponential Moving Averages EMA indicator is a foundational tool designed to provide that clarity. It’s a dynamic and responsive moving average that helps traders identify the underlying trend and momentum with greater speed and precision than its counterparts.
Piprider’s guide will serve as your complete manual, with the EMA explained not as a dry formula, but as a practical tool for real-world trading strategy. We’ll explore its nuances, its strengths, and the battle-tested strategies that professionals use every day.
Key Takeaways
- The EMA prioritizes recent data, allowing it to react faster to market changes than a Simple Moving Average (SMA).
- Its core function is to define the trend: a price above the EMA indicates a bullish trend, while a price below it signals a bearish trend.
- The EMA acts as a dynamic support and resistance line that the price often respects.
- Crossovers between different EMAs signal significant momentum shifts.
- It is a trend-following, lagging indicator that is not reliable in choppy or sideways markets.
1. What is the Exponential Moving Averages EMA indicator?
The Exponential Moving Average (EMA) is a technical indicator that smooths out price data by giving more importance to recent prices (Corporate Finance Institute, 2024). Unlike a Simple Moving Average (SMA), which treats all data equally, the EMA is highly responsive.
This key feature is why it was championed by legendary trend-following trader Ed Seykota. He built his trading system around Exponential Moving Averages to define the trend direction (Wikipedia, n.d.).
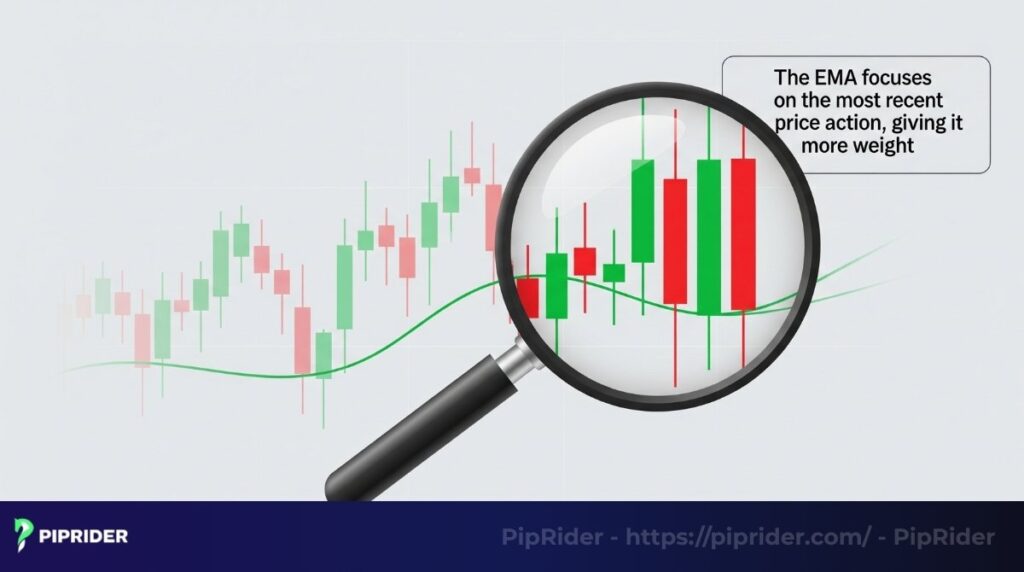
Think of it this way: If you were trying to gauge the mood of a crowd, would you give equal weight to an opinion from an hour ago as you would to one from a minute ago? Probably not. The EMA operates on the same logic. This makes it a preferred tool for traders who need to react quickly to new information and momentum shifts in fast-moving markets like Forex trading, where price dynamics are constantly in flux.
2. The key difference between EMA vs. SMA
The fundamental difference between the Exponential Moving Average (EMA) and the Simple Moving Average (SMA) lies in how they calculate the average price. This calculation directly affects the indicator’s speed and sensitivity.
2.1. Simple Moving Average (SMA)
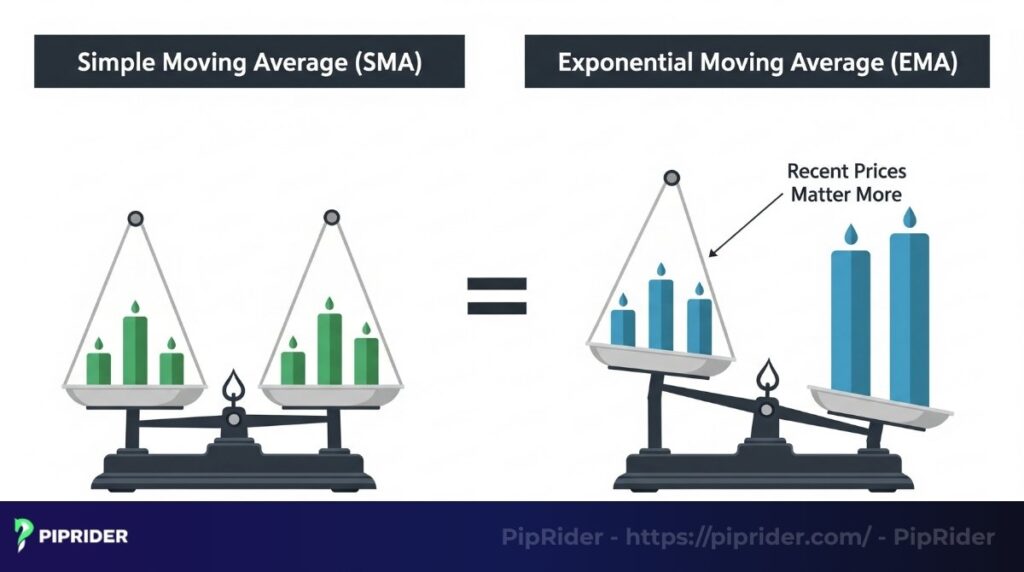
Equal Weighting: The SMA calculates a straightforward average where every single data point in the selected period has equal importance. A price close from 200 days ago has the exact same influence on the line as yesterday’s price close.
- The Result (High Lag): Because it clings to old data, the SMA is slow to react to sudden market changes.
- Best Application: Ideally used for identifying the long-term trend direction and major support/resistance levels on higher timeframes (Daily/Weekly).
2.2. Exponential Moving Average (EMA)
Recent Price Weighting: The EMA applies a complex multiplier to give significantly more weight to the most recent price data. As new candles form, the influence of older data diminishes exponentially.
- Best Application: Ideally used for short-term momentum trading, capturing entry triggers, and trailing stop losses in fast-moving markets.
- The Result (Low Lag): The EMA turns and adapts instantly to current volatility, hugging the price action closer than the SMA.
EMA vs. SMA: A Quick Comparison
| Feature | Simple Moving Average (SMA) | Exponential Moving Average (EMA) |
|---|---|---|
| Calculation Logic | Treats all data points equally (Equal Weight). | Gives more weight to recent prices (Weighted). |
| Responsiveness | Slower to react to price changes (More Lag). | Faster to react to price changes (Less Lag). |
| Best Use Case | Identifying long-term, underlying trends (Support/Resistance). | Tactical decisions: Entries, pullbacks, and catching short-term momentum. |
| Main Weakness | Too slow for fast-moving markets. | Prone to false signals (whipsaws) in choppy markets. |
3. 3-Step Calculating the Exponential Moving Average (The EMA formula)
While modern trading platforms handle the math automatically, understanding the Exponential Moving Average (EMA) formula is crucial for trusting its signals. The secret to the EMA’s speed lies in its unique calculation logic, which applies a specific weighting multiplier to the most recent price data.
The calculation involves three logical steps:
Step 1: Calculate the SMA (The Starting Point)
Since an EMA relies on a “previous EMA” value, the very first calculation in a series must start with a simple average.
- Note: The initial value for the first day is usually seeded using the Simple Moving Average (SMA) of the selected period (n).
Step 2: Calculate the Multiplier (Weighting Factor)
Next, we determine the multiplier (α). This factor dictates the weight given to the most recent price.
Step 3: Calculate the Current EMA
Finally, the current EMA is derived by applying the multiplier to the current price and the remaining weight to the previous EMA.
Real-World Example: 20-Day EMA
Let’s verify a calculation. Assume today’s closing price is 1.1050 (Price) and yesterday’s EMA was 1.1000. The period is 20 days.
1. Find the Multiplier (α):
2. Apply the EMA Formula:
EMA = 0.1052 + 0.9953
4. Interpreting market trends with the EMA Indicator
Mastering how to read the EMA is essential for any technical trader. Beyond just a line, the EMA serves as a dynamic visual filter that smoothes out market noise, allowing you to instantly gauge the market structure and dominant trend without getting distracted by individual erratic candles.
4.1. Defining trend direction
The position and angle of the EMA provide an immediate “health check” of the market. Don’t just look at where the price is; look at what the EMA is doing.
- The Sideways Market (Consolidation): If the EMA line is flat or horizontal, and price is constantly crossing back and forth through it (whipsawing), the market is trendless. In this phase, the EMA loses its effectiveness, and trend-following strategies should be paused.
- The Bullish Trend (Uptrend): A healthy uptrend is confirmed when the price is consistently trading above the EMA, and crucially, the EMA line itself is sloping upwards. The steeper the slope, the stronger the bullish momentum.
- The Bearish Trend (Downtrend): Conversely, sellers are in control when the price stays below the EMA, and the EMA line is angled downwards. This indicates distinct selling pressure.
4.2. Gauging dynamic supports and resistances
In a strong, healthy trend, the EMA line acts like a moving floor (in an uptrend) or ceiling (in a downtrend). However, a common mistake is treating the EMA as a rigid, glass barrier. In reality, it behaves more like a “trampoline” or a “sponge.”
Pro Insight: The “Zone, Not Line” Principle
Price rarely stops exactly to the penny at the EMA line. It often pierces through momentarily before reversing. To avoid getting stopped out prematurely, treat the EMA as a dynamic zone.
Rules for trading the Zone:
- Focus on the Close: Ignore the wicks (shadows). A candle wick piercing the EMA is just testing the zone. A candle closing decisively beyond the EMA is a potential trend change.
- Allow for a Buffer: Never place your Stop Loss exactly on the EMA line. Give the trade room to breathe. (If you are unsure about the exact distance, read our guide on how to calculate stop loss correctly).
- Wait for Reaction: Don’t use blind “limit orders”. Wait for price to enter the zone, slow down, and show a rejection candle (like a Hammer) before entering.
Practical Example: The 50 EMA Strategy
Let’s imagine the 50 EMA is currently at 1.0500.
- The Amateur Approach: They set a rigid “Buy Limit” order exactly at 1.0500. When the price naturally dips to 1.0490 (market noise), their stop loss is hit, and they lose money just before the price rallies back up.
- The Pro Approach: They view the “Support Zone” as 1.0490 – 1.0510. They wait for the price to dip to 1.0490, stabilize, and print a reversal candle. They only enter when the price reclaims the level, keeping their stop loss safely out of reach.
📖 The EMA Trading Playbook (Cheat Sheet)
1. The Trend Filter (Daily Chart)
- Price > 200 EMA → Look for BUY signals.
- Price < 200 EMA → Look for SELL signals.
2. The Entry Trigger
Wait for price to pull back to the 21 or 50 EMA + Print a Confirmation Candle (Hammer/Engulfing).
3. Stop Loss (SL)
Place SL below the recent Swing Low or give the EMA a “buffer zone” (don’t place exactly on line).
⛔ When to AVOID
If EMA lines are FLAT (Horizontal) = Sideways Market. Step away to avoid whipsaws.
5. Core EMA trading strategies
Now let’s translate this knowledge into actionable trading strategies. These three methods are staples in both retail and professional trading.
5.1. The Dual EMA Crossover Strategy
This is the most common strategy for identifying trend reversals. It uses two EMAs: a fast one to trigger the signal and a slow one to define the trend baseline. When the fast line crosses the slow line, it indicates a shift in momentum.
The Setup:
- Fast EMA: 9-period (Red line)
- Slow EMA: 21-period (Blue line)
Strategy Rules: The 9/21 Crossover
- The Trend Filter (Crucial): Before taking any trade, look at the angle of the lines. If both lines are flat/horizontal, the market is ranging. DO NOT TRADE. Only trade when the lines are angled clearly.
- Entry Trigger: Enter at the Open of the next candle immediately after the 9 EMA crosses ABOVE the 21 EMA (for Buy) or BELOW (for Sell).
- Stop Loss (SL): Place SL just below the recent Swing Low or 10-15 pips away from the crossover point to survive minor volatility.
- Take Profit (TP): Ride the trend. Exit only when the 9 EMA crosses back against your trade direction (or use a fixed 1:2 Risk-Reward ratio).
5.2. The golden cross and death cross
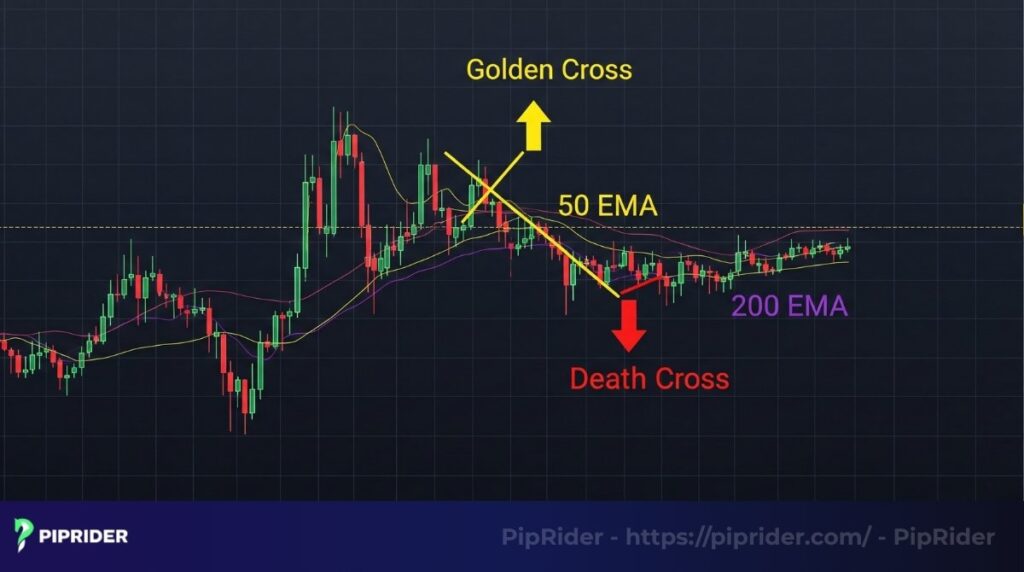
These are two specific, very powerful crossover signals involving the 50-period and 200-period averages. Because these are long-term settings, they are closely watched by institutional funds.
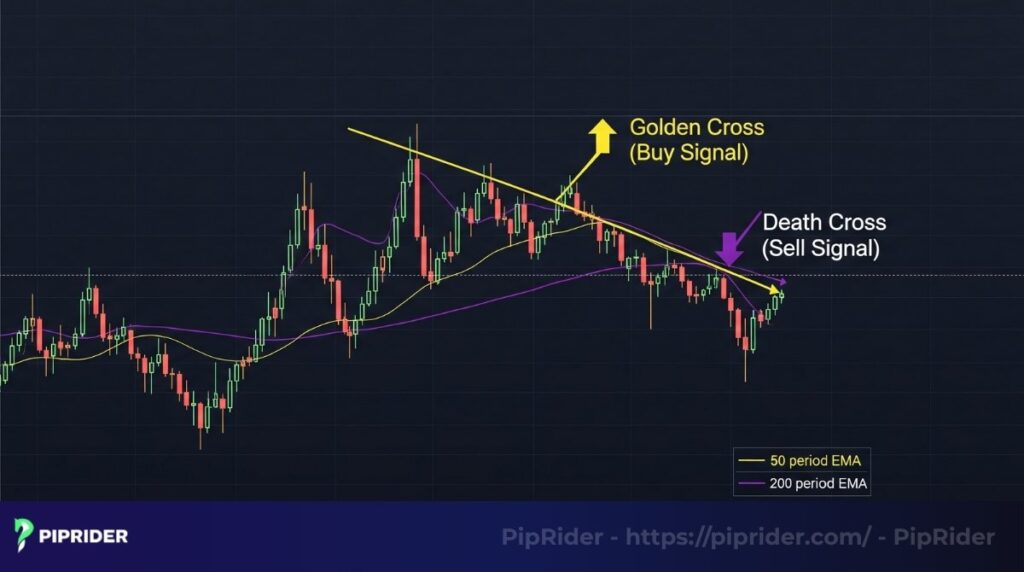
The Golden Cross: On the chart above, the major bullish event happens when the 50-period EMA moves above the 200-period EMA, typically analyzed on a high timeframe like the Daily chart. It is considered a strong, long-term bullish signal, often marking the beginning of a major market uptrend.
The Death Cross: Conversely, this major bearish signal occurs when the 50 EMA moves below the 200 EMA. It is a major warning sign that a long-term downtrend or bear market could be starting.
5.3. The EMA Ribbon Strategy (Trend Following)
Instead of just two lines, an “EMA Ribbon” uses a sequence of moving averages (e.g., 20, 50, 100, and 200) on the same chart. This creates a visual “web” that expands and contracts, offering a 3-dimensional view of the trend strength.
- Expansion (Fanning out): When the lines spread apart evenly, it confirms a healthy, strong momentum.
- Contraction (Pinching): When the lines squeeze together, the trend is pausing or reversing.
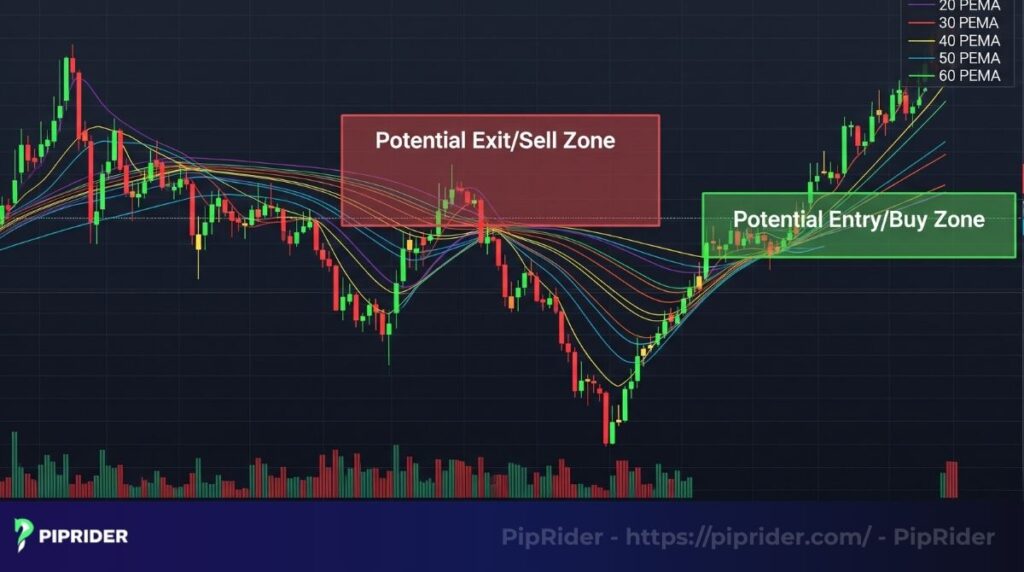
The “Pullback” Strategy: Buying when the ribbon is fully expanded is risky (chasing the price). The professional approach is to trade the Pullback.
Strategy Rules: Ribbon Pullback
- The Setup (Stacking): Ensure the EMAs are stacked in the correct order (e.g., for Uptrend: 20 > 50 > 100 > 200).
- Entry Trigger: Wait for price to retreat into the “Value Zone” (between the 20 and 50 EMA). Do not place a blind limit order. Wait for a rejection candle (like a Hammer or Engulfing pattern) to confirm the bounce.
- Stop Loss (SL): Place your stop safely below the 50 EMA or the 100 EMA. If price breaks the 100 EMA, the trend might be invalid.
- Take Profit (TP): Target the previous Swing High or use a trailing stop along the 20 EMA edge.
6. Pros and cons of the Exponential Moving Average
For effective Exponential Moving Averages EMA indicator application, a trader must have a realistic understanding of its advantages and limitations.
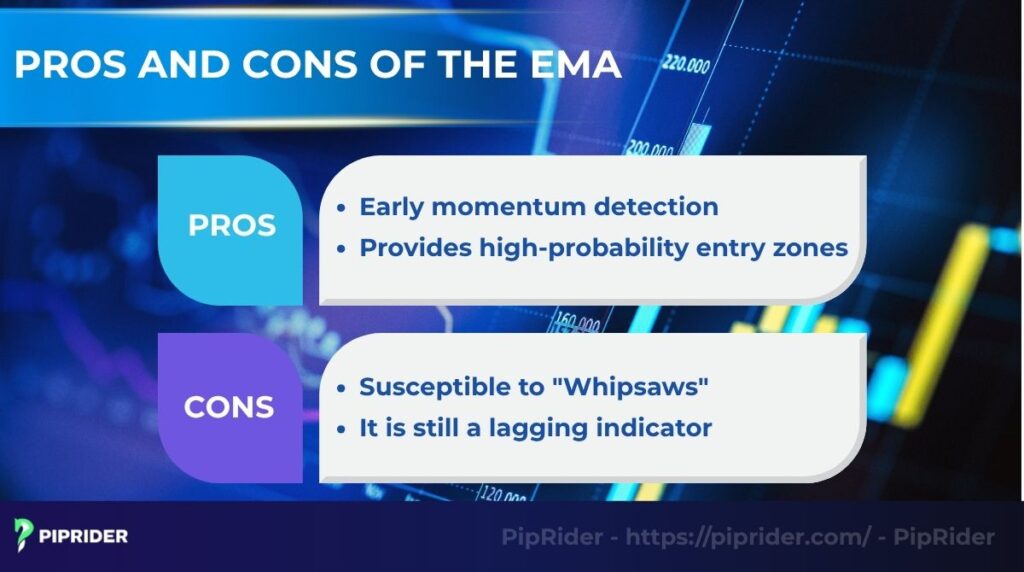
6.1. Pros of the EMA
Despite its limitations, the EMA’s responsiveness offers several key advantages for traders.
- Early momentum detection: Its primary strength is its responsiveness. It can signal a change in momentum faster than a Simple Moving Average (SMA), potentially giving you a head start on a new trend.
- Reliable entry zones: Because it tracks price so closely, its use as a dynamic support or resistance level is extremely reliable for finding pullback entries in a strong trend.
6.2. Cons of the EMA
However, the very sensitivity that makes the EMA so powerful also gives rise to its most significant disadvantages.
- Whipsaw susceptibility: The EMA’s vulnerability to whipsaws is its kryptonite. Because it’s so sensitive, it can be easily faked out by meaningless price fluctuations in a sideways, ranging market, leading to a series of frustrating false signals. This can lead to inaccurate conclusions about asset prices.
- Its lagging nature: This is a crucial point to remember. The EMA cannot predict a new trend; its function is to confirm price movements that are already underway.
6.3. When NOT to use the EMA
Trend-following indicators fail in flat markets. You should pause your EMA strategies when:
- The Market is Ranging (Sideways): If the EMA line is flat and price is constantly criss-crossing it.
- Low ADX (< 20): If the ADX indicator is below 20, the trend is too weak for reliable signals.
7. How to choose the best EMA settings for your strategy
Selecting an Exponential Moving Averages EMA indicator setting is similar to a golfer picking a club; the right tool must be chosen for the specific situation. There is no single “best” setting, only the best setting for your specific trading style.
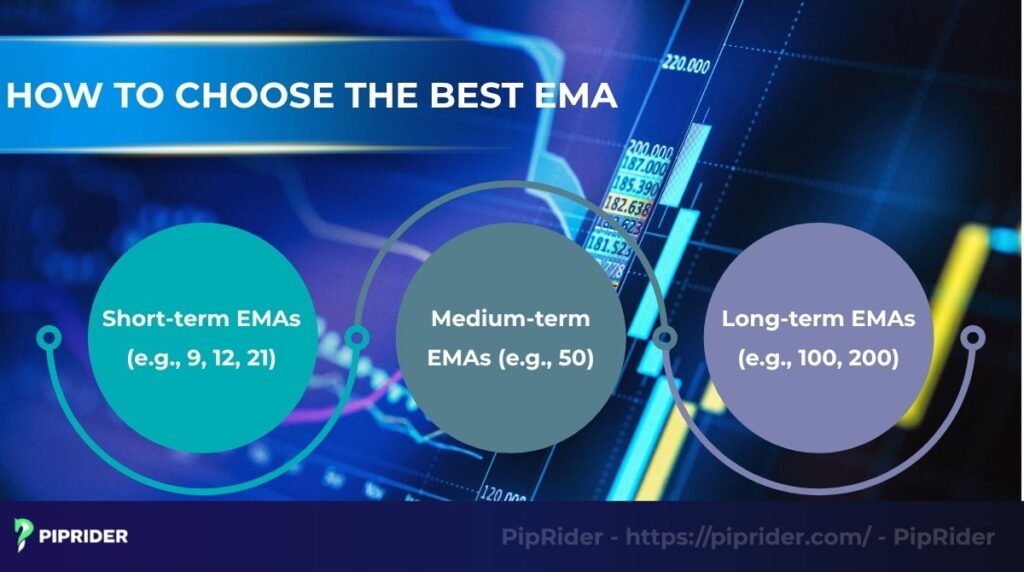
- Short-term EMAs (e.g., 9, 12, 21): These are the tools of day traders and scalpers. They hug the price very tightly and give very early signals. The 21 EMA is a workhorse for many swing traders as it provides a good balance on the H1 and H4 charts.
- Medium-term EMAs (e.g., 50): The 50 EMA is a widely respected line in the sand. Many traders use it as a primary trend filter. Don’t consider a buy trade if the price is below the 50 EMA, or a sell trade if it’s above.
- Long-term EMAs (e.g., 100, 200): These are the tools of position traders and investors. The 200 EMA is widely regarded as a critical benchmark for long-term trend analysis (Investopedia, 2024). Ideally, when the price is above the 200 EMA, large institutions tend to view the asset as being in a long-term bull market, and vice-versa.
8. Tips for using the Exponential Moving Average in Forex
Here are some professional tips that go beyond the basics and can significantly improve your results with the EMA.
8.1. Use multiple timeframe analysis for confirmation
Prior to entering a trade, you must check a higher timeframe. Should you see a beautiful buy setup on an H1 chart as price pulls back toward the 21 EMA, spend 10 seconds looking at the Daily chart. With price on that chart also above the 50 EMA, you now have a much higher-probability trade because short-term and long-term trends are aligned.
8.2. Use the EMA as a dynamic entry point (Pullbacks)
Wait for pullbacks. Instead of buying when the price is extended and far away from the EMA, have the patience to wait for it to pull back and “test” a key EMA. This “area of value” is where you will often find the best risk/reward entries.
8.3. Use the EMA as a dynamic stop loss
In a fast-moving trend, the Exponential Moving Averages EMA indicator can help you manage your trade. A common technique is to trail your stop loss just below a key EMA (like the 21 EMA). The logic is simple: a decisive close below this line would signify that the short-term momentum has broken, giving you a valid, non-emotional reason to exit the trade and protect your profits.
8.4. Pay attention to the angle of the EMA
This is a subtle but critical tip. Don’t just look at the price’s position relative to the EMA; look at the angle of the EMA itself. When you see an EMA rising or falling at a sharp angle (around 45 degrees), it signals a strong and healthy trend. A flat, horizontal EMA is a clear visual sign of a weak, choppy, and unpredictable market, a market you should probably avoid.
9. Common pitfalls to avoid with the EMA
Even with the correct settings, many traders lose money by misinterpreting what the EMA is telling them. Avoiding these common traps is just as important as finding the right entry.
1. The “Curve Fitting” Trap: A common mistake is constantly changing the EMA period (e.g., tweaking it from 50 to 48, then to 52) just to make it fit perfectly with past price history. This is called “curve fitting.”
- Solution: Stick to the industry standards (20, 50, 200). If price ignores the 50 EMA, it’s not because you need to change it to 51; it’s because the market structure has changed.
2. Catching “Falling Knives”: Traders often buy blindly simply because the price touches the EMA during a plummet.
- Solution: Never place a “limit order” directly on the EMA line against strong momentum. Always wait for the price to slow down and print a reversal candlestick first.
3. Trading in a “Choppy” Market (The Whipsaw): The biggest enemy of the EMA is a sideways market. When price moves horizontally, the EMA gives false buy and sell signals repeatedly.
✅ Checklist: How to Avoid Whipsaws (False Signals)
Before taking any EMA trade, run through this quick 3-point check to filter out bad signals:
- Check the Slope: Is the EMA line clearly angled up or down? If it is flat or horizontal, step away.
- Wait for the Close: Don’t act on a candle that is still moving. Only trade if the candle closes decisively on the correct side of the EMA.
- Zoom Out: Switch to a higher timeframe. If the trend on the 4H chart is sideways/messy, a crossover signal on the 15M chart is likely a trap.
10. FAQs about the Exponential Moving Average
11. Conclusion
The Exponential Moving Averages EMA indicator is a cornerstone of modern technical analysis for a reason: it is simple, robust, and incredibly effective at identifying the direction and momentum of market trends.
By understanding the core difference between the EMA and SMA, mastering the key trading strategies like crossovers and pullbacks, and always using it in the context of the broader market, you can make it a powerful ally in your trading journey.
If you have any questions after learning about this indicator, feel free to leave a comment below Piprider’s article. For a broader overview of technical indicators list, be sure to read more of our articles in the Trading Strategies category.


