

Forex Order Blocks are a structural element of institutional trading activity identified through concentrated price action analysis. These zones mark where significant institutional orders were executed, establishing critical supply and demand imbalances.
Accurate utilization of order blocks enables traders to define high-probability entry points and refine risk parameters within a trade setup. This comprehensive guide provides the technical foundation, identification criteria, and practical strategies for trading with order blocks.
Key Takeaways
- Order blocks are specific price zones where institutional players (“smart money”) have accumulated significant orders.
- There are two main types: the bullish order block and the bearish order block.
- They are typically identified by a period of consolidation followed by a strong, decisive breakout.
- High-probability order blocks often form after traditional support or resistance levels are ‘swept’ to hunt for liquidity.
- Traders use order blocks to define precise entry points, stop losses, and take profit targets.
1. What Are Order Blocks in Forex Trading?
An order block is a specific price zone on a chart that highlights a significant concentration of orders. These are often in the form of pending limit orders placed by institutional traders, such as major banks and hedge funds.
Instead of relying on lagging indicators, order block analysis focuses on reading the raw supply and demand story on the chart. To truly understand how to trade them, you must first understand the core logic of Smart Money Concepts (SMC), a methodology pioneered and popularized by Michael J. Huddleston (Huddleston, 2016), which focuses on tracking institutional footprints and algorithmic price delivery.
1.1. The Smart Money Logic: Institutional Accumulation
The concept of order blocks stems from a fundamental problem that institutional players face: Liquidity constraints.
- The Problem with Size: Retail traders can execute small trades instantly. However, when a central bank needs to buy $500 million worth of EUR/USD, executing it all at once would consume all available liquidity, causing massive slippage and forcing them to buy at inflated prices.
- The Solution: To avoid moving the market against themselves, institutions break their massive orders into smaller chunks. They subtly accumulate (buy) or distribute (sell) their positions within a tight, consolidated price range.
- The Breakout: Once their massive position is fully filled, the sudden imbalance between supply and demand triggers the explosive breakout we see on the chart. The consolidation zone left behind is the Order Block—the literal footprint of institutional activity.
1.2. The Core Logic: Liquidity & Institutional Engineering
To trade Order Blocks successfully, you must stop looking at charts as patterns and start seeing them as Liquidity Maps. Mastering how to identify liquidity in trading is the essential first step before you can accurately spot institutional footprints.
In the decentralized Forex market, Smart Money (Central Banks, Tier-1 Banks) operates with such massive volume that they cannot simply “Buy” or “Sell” at any price. They require a massive amount of counterparty orders to fill their positions without significant slippage, a fundamental principle of market liquidity and institutional order execution (Investopedia, 2025).
1.2.1. Liquidity Pools: Where the “Fuel” is Hidden
Institutions hunt for areas where retail orders are most concentrated. These are known as Liquidity Pools:
- Buy-side Liquidity (BSL): Clustered above previous swing highs, equal highs (Double Tops), and trendline resistance. This is where retail “Buy Stops” (for breakouts) and “Stop Losses” (from short sellers) are located.
- Sell-side Liquidity (SSL): Clustered below previous swing lows, equal lows (Double Bottoms), and trendline support. This is where retail “Sell Stops” and “Stop Losses” (from buyers) sit.
1.2.2. The Mechanics of a Liquidity Sweep (The Stop Hunt)
A Liquidity Sweep is a deliberate institutional maneuver designed to “engineer” the necessary volume for a major move.
- The Manipulation: Price is aggressively pushed just beyond a visible BSL or SSL level.
- The Trap: As retail stop-losses are triggered, they become market orders (e.g., a buyer’s stop-loss becomes a “Sell” order). Simultaneously, breakout traders enter in the direction of the sweep.
- The Absorption: Institutions “absorb” all these sell orders to fill their massive “Buy” positions at a Discounted price.
- The Result: This aggressive absorption creates the Order Block. Without a sweep, there is no institutional fuel, and the “Order Block” is likely a trap.
Key Expert Insight: If you don’t see a liquidity sweep before a move, YOU are likely the liquidity.
1.3. The Mitigation Process: Why Do Prices Return to Order Blocks?
A common question beginners ask is: Why does the price almost always return to retest the order block before continuing its trend? In SMC terminology, this is known as Mitigation.
To create the liquidity needed to fill their massive “Buy” orders, institutions often have to initially place smaller “Sell” orders to push the price down and trap retail traders. When the real upward breakout happens, those initial institutional “Sell” orders are left behind in a negative float (drawdown).
Institutions later allow the price to pull back to the origin of the move (the Order Block) to mitigate (close out at break-even) those underwater positions. Once mitigated, the market is free to resume its true institutional trend. As a retail trader, your goal is to identify these mitigation zones and enter the market alongside the Smart Money.
2. Types of Order Blocks in SMC
In Smart Money Concepts (SMC), order blocks are classified not just by the direction of the trend they initiate, but also by how they react when invalidated. Differentiating between these structures is a foundational step for any institutional chart analysis.
2.1. Bullish Order Block (+OB)
A bullish order block is a specific price zone marking where institutions accumulated a massive volume of buy orders, typically occurring after a period of downward price consolidation.
- The Setup: It must precede a strong, aggressive upward move (Displacement) that breaks a previous structural high (Break of Structure/CHoCH) and leaves behind a Fair Value Gap (FVG).
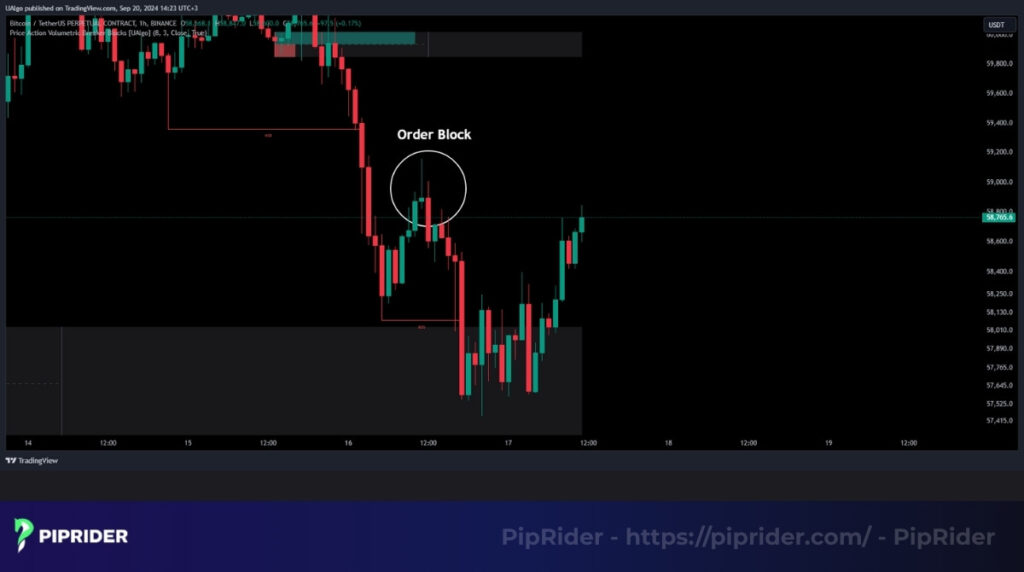
- The Footprint: Visually, the bullish order block is the last down-candle (or a tight cluster of consecutive down-candles) just before this powerful upward explosion begins.
- The Function: When the price eventually pulls back to this origin zone, it acts as a highly reactive support level. It provides a high-probability buying opportunity as institutions inject more capital to defend their original accumulation.
2.2. Bearish Order Block (-OB)
A bearish order block is the exact mirror opposite. It is a price zone representing a significant cluster of institutional sell orders (distribution), forming just before a sharp market crash.
- The Setup: It must precede a strong, impulsive downward move that breaks a previous structural low, leaving a clear FVG in its wake.
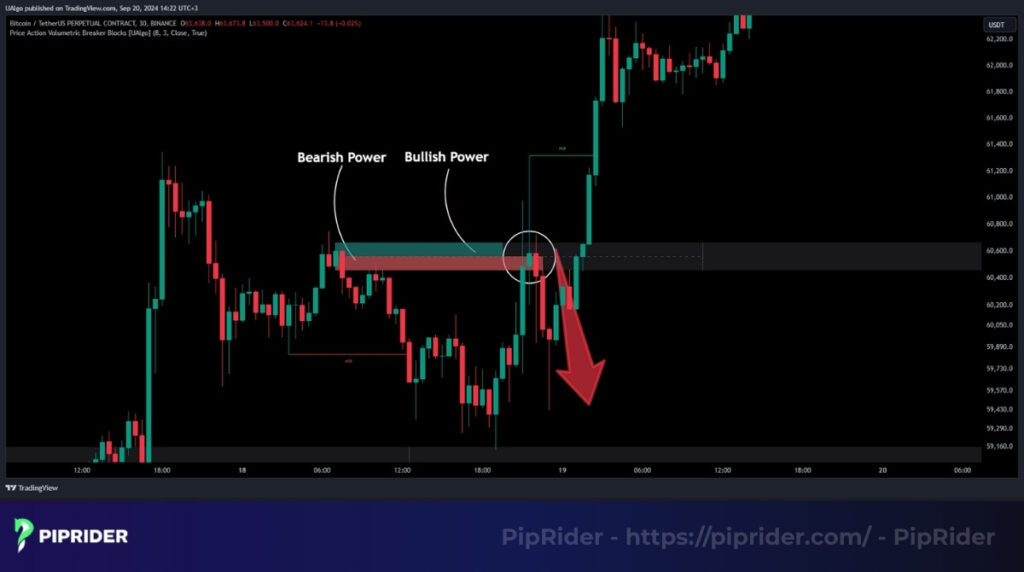
- The Footprint: Visually, the bearish order block is the last up-candle (or a tight cluster of consecutive up-candles) just before the aggressive downward displacement begins.
- The Function: When the price rallies back up to retest this zone, it acts as a massive institutional resistance level, providing a high-probability selling opportunity.
2.3. Breaker Block (The Failed Order Block)
A common question among SMC traders is: “What happens when an Order Block fails to hold the price?” It does not become useless; it transforms into a Breaker Block.
A Breaker Block is simply an order block that has been aggressively broken (invalidated) by a high-momentum price displacement. Once broken, its function flips. It is the institutional equivalent of the classic “Support turns Resistance” concept, but driven by order flow mitigation.
- The Logic: When a major order block is aggressively breached, the institutions that defended that zone are now trapped in drawdown (negative float). When the price pulls back to this broken zone, they will close their losing positions at break-even (mitigating their losses). This sudden removal of opposing orders causes the price to aggressively bounce in the new direction.
- Bullish Breaker: A failed Bearish Order Block. Price violently breaks above it, and when it pulls back down, the broken block now acts as strong support for buy entries.
- Bearish Breaker: A failed Bullish Order Block. Price violently crashes below it, and when it rallies back up, the broken block now acts as strong resistance for sell entries.
3. How to Find a High-Probability Order Block: The 4-Step Institutional Framework
Finding a valid order block is not just about spotting a random opposite candle before a big move. It requires tracking the logical sequence of institutional order flow. A high-probability order block almost exclusively forms after a Liquidity Sweep and must be positioned in a logical pricing zone.
Here is the professional 4-step framework to identify a valid institutional footprint on your chart:
Step 1: Identify the Liquidity Sweep (The Setup)
Markets are inherently drawn to liquidity. Retail traders typically place their stop-losses just above obvious resistance levels (Buy-side Liquidity / BSL) or just below obvious support levels (Sell-side Liquidity / SSL).
Before executing a major directional move, institutions will often manipulate the price to pierce these swing points, intentionally triggering retail stop-losses to absorb the liquidity needed for their massive orders. This is known as a Liquidity Sweep (or Stop Hunt).
Step 2: Confirm the Market Structure Shift (The Displacement)
Immediately after the liquidity has been absorbed, the market will aggressively reverse direction. You must look for a sharp, impulsive price move, often referred to as Displacement, that breaks a significant recent high or low. This creates a Break of Structure (BOS) or a Change of Character (CHoCH), confirming that Smart Money has officially taken control of the trend.
Crucial Rule: The market structure shift must be confirmed by a Body Close above or below the level. A simple wick rejection is often just a secondary liquidity sweep, not a valid shift.
Step 3: Locate the Order Block Candle (The Footprint)
Once the liquidity sweep and the structure shift are confirmed, pinpoint the exact order block:
- For a Bullish Order Block: Locate the last down-candle (or series of consecutive down-candles) that drove the price down to sweep the Sell-side Liquidity, right before the aggressive upward displacement began.
- For a Bearish Order Block: Locate the last up-candle (or series of consecutive up-candles) that drove the price up to sweep the Buy-side Liquidity, right before the aggressive downward crash.
Step 4: The Pricing & Imbalance Filter (The Confirmation)
A genuine institutional order block leaves a clear sign of urgency and follows strict pricing rules.
- The FVG: The impulsive move away from the block must create an Imbalance or Fair Value Gap (FVG), indicating a pure, one-sided institutional injection.
- Premium vs. Discount: Smart Money buys at wholesale prices and sells at retail prices. Use a Fibonacci tool from the swing high to the swing low. A high-probability Bullish Order Block must sit in the Discount Zone (below the 50% equilibrium mark). A high-probability Bearish Order Block must sit in the Premium Zone (above the 50% mark). Blocks forming in the middle (equilibrium) are often low-probability traps.
The High-Probability Order Block Checklist
Before marking an Order Block on your chart and planning an entry, run it through this strict institutional checklist. If it fails even one criterion, the setup is likely an Inducement trap:
1. Liquidity Sweep: Did the move take out a previous significant High or Low before reversing?
2. Displacement & CHoCH: Did the resulting move aggressively break the market structure?
3. Fair Value Gap (FVG): Did the breakout leave a clear imbalance demonstrating institutional urgency?
4. Logical Pricing (Premium/Discount): Is the buy zone in a Discount area (<50%), or the sell zone in a Premium area (>50%)?
5. Unmitigated: Has the price stayed away from this zone since its creation, leaving the institutional orders “fresh”?
4. The Order Block Trading Strategy: A Step-by-Step Guide
A fatal mistake many retail traders make is placing blind limit orders the moment the price touches a Higher Timeframe (HTF) order block. In the Smart Money Concepts (SMC) methodology, a touch is not an execution trigger; it is simply an alert.
To protect your capital from institutional fakeouts, you must transition from a “Risk Entry” to a Confirmation Entry. Here is the exact strategy to execute high-probability trades.
4.1. The 5-Step Entry Execution Guide
Follow this chronological sequence to safely enter the market alongside institutional order flow:
- Step 1: HTF Zone Identification & Patience Identify your Higher Timeframe (e.g., H4 or Daily) narrative using the checklist from Section 3 to mark a valid, unmitigated HTF Order Block. Set a price alert at the edge of this zone and wait. Do not predict when the price will get there.
- Step 2: The HTF “Tap” & Timeframe Drop When the price pulls back and taps into your HTF order block, do not execute. Watch for an initial slowing of momentum or a slight rejection wick. Immediately zoom into your Execution Lower Timeframe (LTF)—typically the M15 or M5 chart.
- Step 3: Wait for the LTF Liquidity Sweep (The Final Trap) Smart Money will often execute one final stop-hunt to shake out early traders. On your LTF chart, watch for the price to sweep a short-term local low (for buys) or a high (for sells) within the broader HTF zone.
- Step 4: Confirm the LTF Structural Shift (CHoCH + FVG) After the final LTF liquidity sweep, look for a sharp, impulsive reversal that breaks the local market structure. This Change of Character (CHoCH) must leave behind a fresh Fair Value Gap (FVG).
- Step 5: The Trigger (Execution) Once the CHoCH and FVG are confirmed, place your Limit Order at the newly formed LTF Order Block or the edge of the LTF FVG. Wait for the price to pull back to fill your order.
4.2. Precision Stop Loss & Take Profit Placement
In the Smart Money Concepts (SMC) methodology, a Stop Loss is not just a “safety net”—it is the Invalidation Point. If the price hits this level, the institutional narrative for that specific trade is officially dead.
4.2.1. Where to Place Your Stop Loss (The Placement Guide)
To achieve the high Reward-to-Risk (R:R) ratios characteristic of SMC, your SL must be as refined as your entry.
- For Confirmation Entries (Recommended): Place your SL 2–3 pips (plus Spread) below the lowest wick of the Lower Timeframe (LTF) Liquidity Sweep. This is the point where institutions “cleared the board” before the move. If price returns and breaks this wick, the institutional sponsorship has failed.
- For Risk Entries (Aggressive): If you are entering blindly at a Higher Timeframe (HTF) Order Block, your SL must be placed behind the entire HTF zone. This requires a wider SL but offers protection against deep mitigations.
- For Breaker Block Entries: Place your SL behind the origin of the displacement move that broke the original Order Block.
Pro Tip (The 50% Rule): For extremely precise entries, many institutional traders use the Mean Threshold (the 50% equilibrium level) of the order block candle. Price often reacts sharply at this midpoint, allowing for an even tighter stop-loss and higher R:R.
4.2.2. Take Profit: Targeting Institutional Liquidity
Smart Money does not target random numbers; they target Liquidity Pools. Use these three levels to scale out of your position:
- Primary Target (Liquidity Pools): Target Equal Highs (EQH) or Equal Lows (EQL). These areas are magnets for price because they contain a massive concentration of retail buy/sell stops.
- Secondary Target (Unmitigated Structures): Look for the nearest unmitigated Swing High/Low on the Higher Timeframe.
- Final Target (FVG Balancing): Major Fair Value Gaps (FVG) on the Daily or H4 charts often act as long-term targets, as the market seeks to balance previous price inefficiencies.
4.3. The Multiple Timeframe Analysis (MTFA) Matrix
To execute the step-by-step strategy effectively, you must pair the correct timeframes. Use this institutional matrix based on your trading style:
- Swing Traders: HTF Bias (Daily D1) ➔ LTF Entry (H1 or M15)
- Intraday / Day Traders: HTF Bias (H4 or H1) ➔ LTF Entry (M15 or M5)
- Scalpers: HTF Bias (M15) ➔ LTF Entry (M1)
4.4. SMC Case Study Examples (EUR/USD & GBP/USD)
Seeing this process in action is the best way to internalize the strategy.
Case Study 1: Bullish Order Block on EUR/USD (Day Trading)
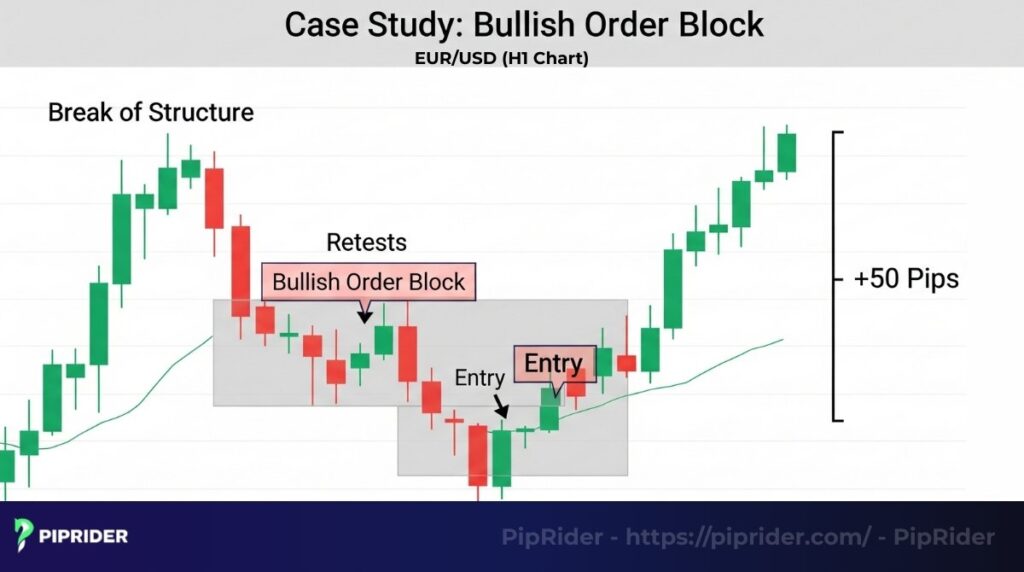
- The Setup: We identified an H1 Bullish Order Block that swept liquidity and left an FVG. We set an alert.
- The Confirmation: Price tapped the zone. Dropping to the M5 chart, price pushed slightly lower, sweeping a micro-low (Liquidity Grab), then exploded upwards, causing an M5 CHoCH and leaving a fresh FVG.
- The Execution: We placed a Buy Limit at the new M5 Order Block. Price pulled back, triggered our entry with a tight 5-pip Stop-Loss, and rallied 50 pips to the nearest H1 Buy-side Liquidity pool.
Case Study 2: Bearish Order Block on GBP/USD (Swing Trading)
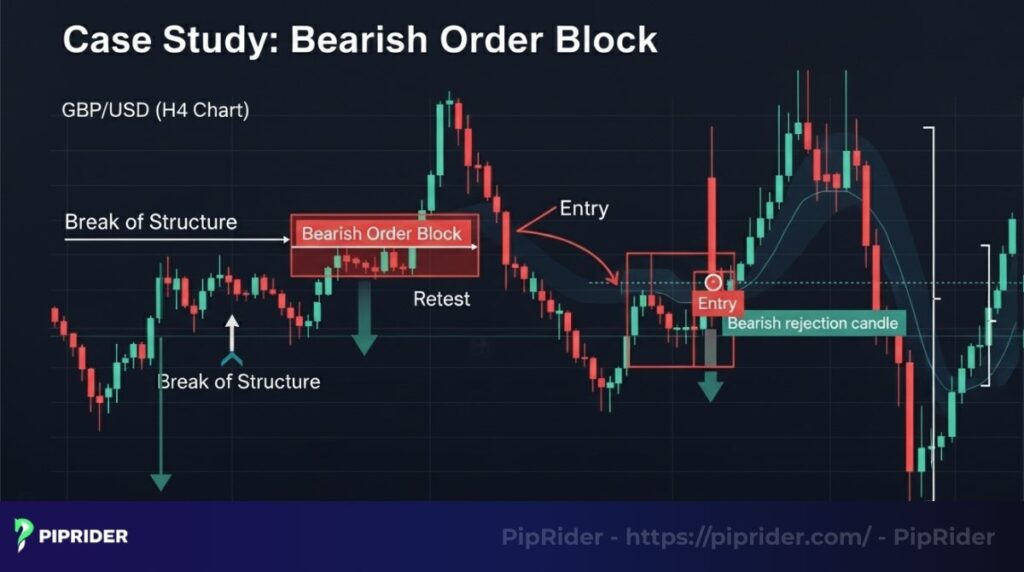
- The Setup: We marked an H4 Bearish Order Block sitting in a Premium pricing zone. Days later, price rallied into it.
- The Confirmation: We dropped to the M15 chart. The M15 chart showed price consolidating inside the H4 block, then violently breaking structure to the downside (CHoCH), leaving a massive FVG.
- The Execution: We placed a Sell Limit on the M15 FVG pullback. The HTF order block held perfectly, and the trade melted down to target unmitigated Daily swing lows.
5. Common Mistakes When Trading Order Blocks (The Smart Money Traps)
While order blocks are an incredibly powerful tool, retail traders often fall into specific institutional traps when learning this methodology. Being aware of these SMC-specific pitfalls is crucial for protecting your capital.
Here are the most frequent, and costly, mistakes:
- Falling for “Inducement” (Smart Money Traps): This is the #1 reason order block traders lose money. Not every opposite candle before a move is a valid order block. If a block forms without sweeping prior liquidity, it is often just Inducement, a fake zone engineered by Smart Money to trap early retail buyers/sellers before the price crashes through it to mitigate the real order block below/above it.
- Ignoring the Higher Timeframe Narrative: Order blocks fail when they fight the macro trend. Trying to buy from a 15-minute bullish order block when the Daily (D1) chart is in a massive bearish displacement is financial suicide. Always align your trades with the Higher Timeframe Order Flow.
- Trading Blocks Without Displacement (FVG): A true institutional order block leaves a footprint of urgency. If the price slowly drifts away from the candle without leaving a Fair Value Gap (FVG) or causing a clear Break of Structure (BOS), it lacks institutional backing. Do not trade it.
- Using Blind “Risk Entries”: As discussed in Section 4, placing a limit order blindly at a major HTF order block exposes you to unnecessary risk. Failing to zoom into a Lower Timeframe to wait for a Change of Character (CHoCH) confirmation is a fast way to get stopped out by a final institutional liquidity sweep.
6. Order Blocks vs. Supply & Demand Zones: What’s the Difference?
Traders familiar with traditional price action often ask: “Aren’t order blocks just a fancy name for supply and demand zones?” While they share the foundational logic of market imbalance, they differ significantly in granularity.
A common perspective within the SMC community is: An Order Block is a highly refined subset of a Supply & Demand zone. While traditional Supply & Demand identifies broad areas of interest, an Order Block pinpoints the specific candlestick footprint of institutional accumulation. Understanding this distinction helps traders transition from identifying general reversal zones to pinpointing specific execution triggers.
Use the objective comparison below to understand how these concepts complement each other:
| Feature | Forex Order Blocks (SMC) | Supply & Demand Zones |
|---|---|---|
| Definition | A specific, single-candle (or micro-cluster) footprint showing exact order execution. | A broader contextual area where price showed a general imbalance between buyers and sellers. |
| Origin / Methodology | Smart Money Concepts (SMC) & Institutional Order Flow. | Traditional Price Action theory (Wyckoff, Sam Seiden). |
| Identification | The last opposing candle before a structural displacement (Typically requires a Liquidity Sweep and FVG). | Identified broadly at significant structural swing highs (peaks) and swing lows (valleys) or consolidation bases. |
| The Signal | A specific Bullish or Bearish OB candle acting as a precise trigger. | Price returning to a general historical zone of support or resistance. |
| Application & Risk | Typically used for pinpoint entries, allowing for extremely tight stop-losses. | Often used to establish the directional bias; requires wider stop-losses to cover the entire zone. |
| Granularity (Focus) | Micro-focus: Targets the exact moment liquidity was injected. | Macro-focus: Targets the general area where supply or demand historically overwhelmed the other. |
7. Combining Order Blocks with Other Tools for Higher Probability
While a high-quality order block is powerful on its own, its probability increases significantly when it aligns with other technical factors. This is what professional traders call Confluence.
Here are the most effective tools to combine with order blocks:
- Order Blocks + Trading Sessions (Killzones): Institutions execute their largest orders during specific times of the day. Order blocks that form or are mitigated during the London Open or New York Open (the “Killzones”) are much more likely to hold. If a setup occurs during the “Asian Range,” it is often a liquidity trap.
- Order Blocks + Fibonacci (Premium/Discount): This is a critical filter. A bullish order block has a much higher success rate if it aligns with the Discount Zone (below the 50% retracement) or the Optimal Trade Entry (OTE) levels (61.8% – 79%). Trading an order block in the “Premium” zone for a buy is often a low-probability mistake.
- Order Blocks + Divergence (RSI/SMT): When the price returns to an order block, look for a momentum divergence. If the price makes a lower low into a bullish OB, but the RSI makes a higher low, it confirms that selling pressure is exhausting and the institutional “buy” orders are likely to trigger a reversal.
- Order Blocks + Higher Timeframe (HTF) S&D Zones: The “nested” setup is the gold standard. An M15 order block that forms inside a 4-Hour Supply or Demand zone creates a “confluence of timeframes,” leading to high-conviction trades with massive Reward-to-Risk ratios.
8. FAQs on Forex Order Blocks
9. Summary
Forex order blocks are a powerful tool that allows traders to read the behavior of large institutions and find precise trade opportunities. When you combine order block analysis with disciplined risk management, multiple timeframe analysis, and other confirming tools, you can significantly increase the reliability of your trading signals and improve your long-term performance.
To continue building on these advanced price action techniques, we encourage you to explore more guides in our Learn Forex category on Piprider.


