
Gartley patterns are the well-known formations in harmonic chart pattern trading, offering a structured, rule-based approach to identifying high-probability market reversals. Its reliance on precise geometric structures makes it a powerful tool for identifying high-probability market reversals.
This guide provides a complete playbook on what the pattern is, how to identify it using Fibonacci ratios, and the trading strategy for trading it effectively.
Key Takeaways
- The Gartley pattern is a five-point (X-A-B-C-D) harmonic structure built on an ABCD pattern plus a preceding X swing.
- It identifies high-probability reversal zones specifically where a price correction is likely to end and the primary trend is set to resume.
- Precise Fibonacci ratios, particularly the 0.618 B-point and 0.786 D-point, are mandatory for pattern validation.
- Risk management centers on placing stop-losses beyond point X, where the geometric structure is invalidated.
1. What Is the Gartley Pattern?
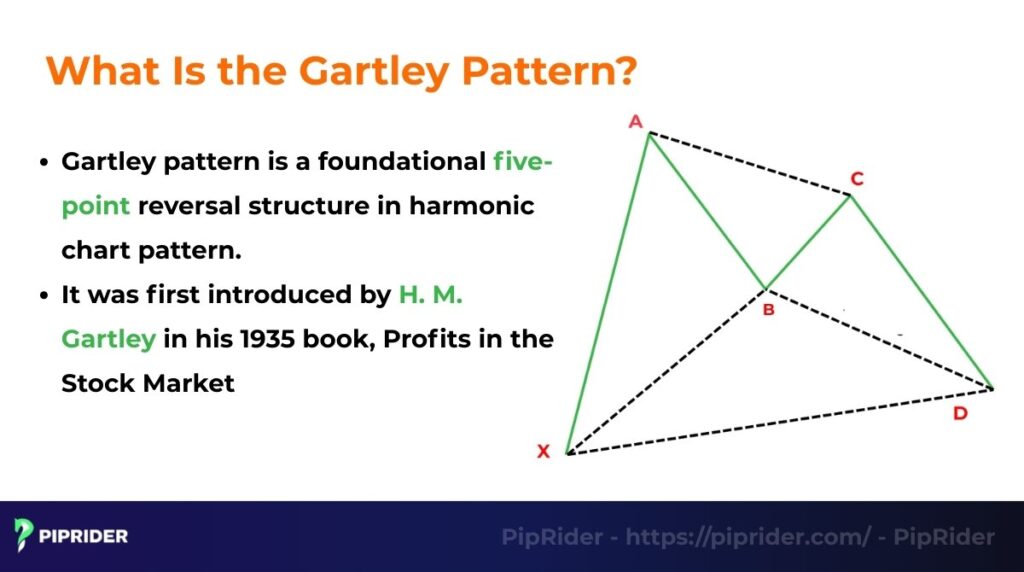
According to Investopedia, the Gartley pattern is a foundational five-point reversal structure in harmonic chart pattern. It was first introduced by H. M. Gartley in his 1935 book, Profits in the Stock Market, often called the “Gartley 222 pattern”.
Gartley pattern’s reliance on Fibonacci numbers provides a more objective, rule-based approach to trading reversals in technical analysis. These measurements are based on statistical methods that have been observed over decades of market data.
Unlike Cup and Handle or Wedge formations, Gartley’s reliance on specific measurements provides a more objective, rule-based approach to trading reversals in price movements.
2. Understanding Gartley Patterns
The Gartley pattern appears in two mirror-image variations: bullish and bearish. It typically functions as a continuation signal by identifying the end of a temporary correction within a larger trend.
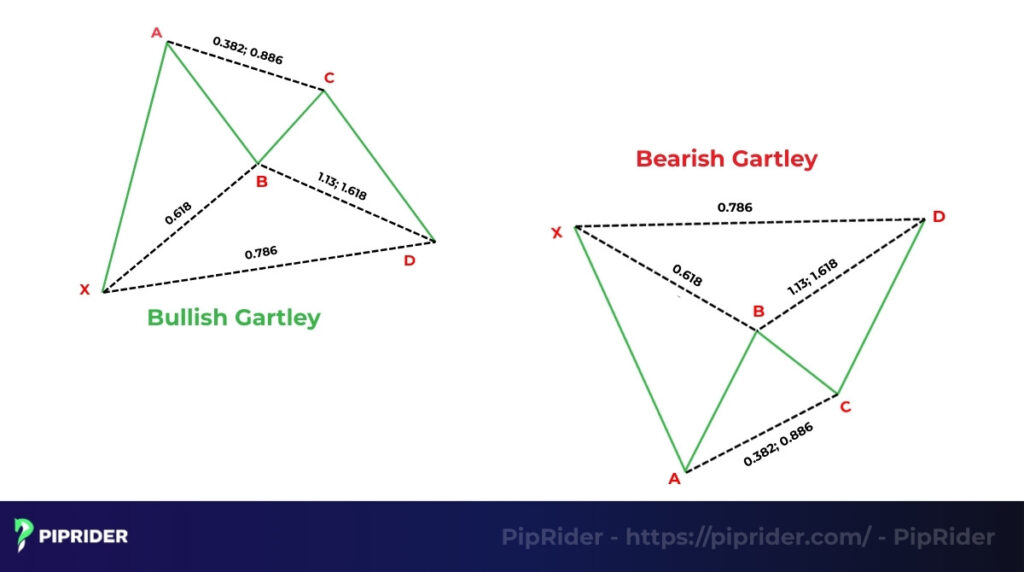
- The Bullish (M-Shape): This pattern often appears as a corrective dip within an overall uptrend. It signals a potential buying opportunity at point D, where the downward correction (the ABCD portion) is expected to reverse so the price can resume its upward trajectory.
- The Bearish (W-Shape): This appears as a corrective rally within an overall downtrend. It signals a potential selling opportunity at point D, marking the exhaustion of the upward correction before the price continues its primary move lower.
The Psychology of Trend Correction
The psychology behind the pattern reflects a healthy market retracement rather than a total trend failure (Carney, 2010). The structure begins with a strong impulsive move (XA). This is followed by a series of corrective waves (AB, BC, and CD) that test the conviction of the prevailing trend. When the final leg (CD) reaches the Potential Reversal Zone (PRZ) at the 0.786 Fibonacci level, it indicates that the counter-trend momentum is exhausted. At this point, the original trend participants usually step back in, driving the price back in the direction of the initial XA impulse.
3. Identifying and Analyzing Gartley Patterns
The power of this pattern lies in its precise geometric structure, defined by specific ratios. Identifying these ratios correctly is paramount to validating the pattern.
3.1. Fibonacci Ratios and Tolerance
The pattern relies on four main Fibonacci retracements and extensions levels to define its key turning points:
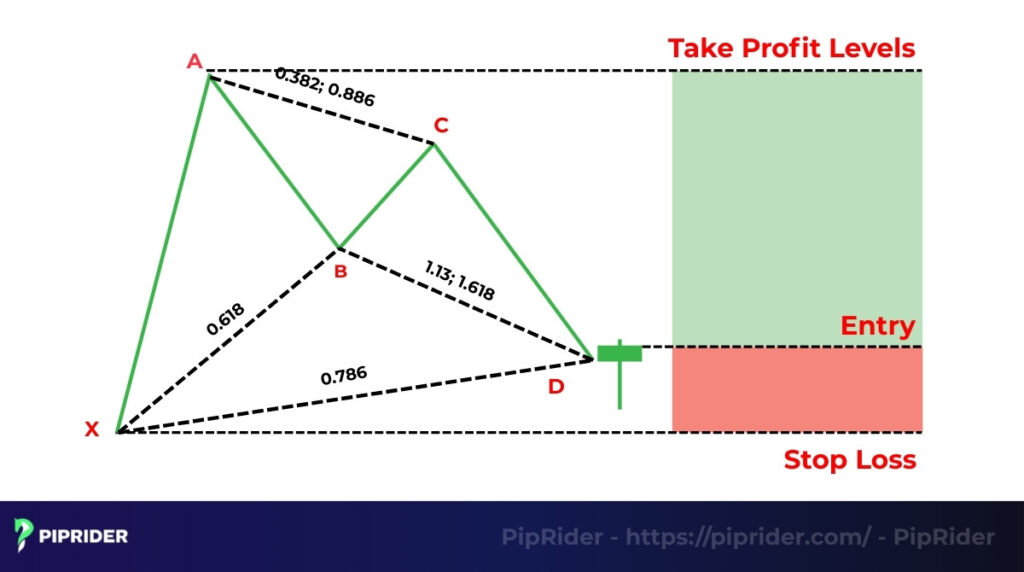
- AB Retracement: The AB leg should retrace exactly 0.618 of the XA leg.
- BC Retracement: The BC leg can retrace either 0.382 or 0.886 of the AB leg.
- CD Retracement: The CD leg can be either a 1.272 or 1.618 extension of the BC leg.
- XD Retracement: Crucially, the final D point (the Potential Reversal Zone or PRZ) must be a 0.786 retracement of the entire XA leg.
These Fibonacci levels don’t have to be perfectly exact. According to Investopedia (2023), the closer your ratios are to the ideal values, the more reliable the setup tends to be. A slight variation of a few pips is often acceptable in live market conditions.
It is the confluence of these precise ratios, especially the 0.618 at B and the 0.786 at D, that makes the Gartley pattern a high probability reversal signal similar in reliability to formations like the triple bottom pattern.
3.2. The Key Points (X, A, B, C, D)
The pattern is defined by five key pivot points on the chart, labeled X, A, B, C, and D. These points connect to form four distinct price movements or “legs” that create the pattern’s structure.
- XA Leg: The initial impulse leg, representing the primary directional move that sets up the pattern. It is the longest leg.
- AB Leg: The first retracement, where the price moves against the XA leg.
- BC Leg: A smaller move in the direction of the initial trend, but it does not exceed the high (in a bearish pattern) or low (in a bullish pattern) of point A.
- CD Leg: The final and most important leg. It moves against the BC leg and completes at a specific Fibonacci level, forming the D point and the PRZ.
3.3. The “Perfect” Gartley Setup
For traders seeking the highest probability setups, the “Perfect Gartley” adheres to the strictest alignment of ratios as defined by BabyPips (n.d.):
- The B point must be at exactly 0.618 of the XA leg.
- The D point must be at exactly 0.786 of the XA leg.
- The ABCD pattern must be clearly visible and symmetrical.
- The PRZ should show clear confluence between the 0.786 XA retracement and the CD extension.
3.4. Gartley Pattern vs. Other Harmonic Patterns
While all harmonic patterns rely on Fibonacci ratios, the key to distinguishing them lies in their specific measurements, particularly the B-point retracement and the D-point completion. Traders can find many ABCD pattern examples as these are foundational harmonic patterns. Understanding the subtle differences on a butterfly pattern chart is key to not confusing it with a Gartley.
The following table highlights the specific Fibonacci measurements that distinguish the Gartley from other common harmonic formations based on the refinements by Carney (2010).
| Pattern | Key B-Point Retracement (of XA) | Key D-Point Completion (of XA) | Structure Type |
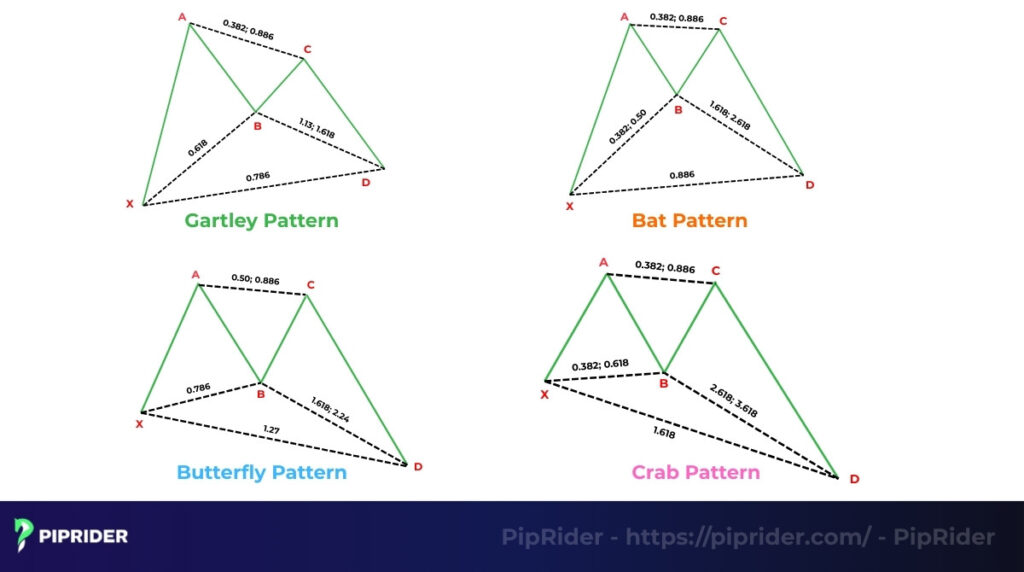
| Gartley | 0.618 | 0.786 Retracement | Retracement |
| Bat | 0.382 – 0.50 (Shallower) | 0.886 Retracement (Deeper) | Retracement |
| Butterfly | 0.786 | 1.272 Extension (D extends beyond X) | Extension |
| Crab | 0.382 – 0.618 | 1.618 Extension (D extends far beyond X) | Extension |
In sum up,
- Gartley and Bat are retracement patterns, with the final D point located within the range of the initial XA move.
- Butterfly and Crab are extension patterns, with the D point forming beyond the initial X starting point.
4. How to Trade the Gartley Pattern
Trading Gartley pattern requires a disciplined, rule-based approach. The strategy centers on identifying the PRZ and then planning the entry, stop-loss, and profit targets.
4.1. Entry Strategy
The entry for a trade is always taken at the completion of the D point within the PRZ. To minimize fakeouts, traders should utilize one of the following two entry modes based on their risk tolerance:
- Aggressive Entry: You enter immediately upon seeing a reversal candlestick signal at the PRZ. For a Bullish setup, look for a bullish engulfing or pin bar at point D. For a Bearish setup, look for a shooting star or bearish engulfing candle.
- Conservative Entry: You wait for the price to reclaim a minor structure level or break a counter-trend line around point D. This “confirmation of the reversal” ensures the market has actually shifted sentiment before you commit capital, effectively filtering out many false breakouts.
Regardless of the mode, never enter “blindly” at a Fibonacci level; always wait for price action to prove that the opposing force is taking control.
4.2. Stop-Loss Placement
A non-negotiable rule is placing the stop-loss just a few pips beyond the pattern’s X point. This level marks the origin of the structure; a price break past X invalidates the entire geometric setup.
As a practical note, if point X is significantly far from your entry at D, resulting in a poor risk-to-reward ratio, it is often better to skip the trade or reduce your position size. Never “force” a pattern to fit if the risk parameters do not meet your trading plan
4.3. Profit Targets
The Gartley pattern offers logical profit targets based on Fibonacci levels of the A-D leg:
- Target 1 (Conservative): The 0.382 Fibonacci retracement of the A-D leg. This is a high-probability target where many traders secure partial profits.
- Target 2 (Standard): The 0.618 Fibonacci retracement of the A-D leg.
- Alternative Target: According to Investopedia (2023), some traders prefer setting a target near point C. This is particularly useful for beginners as it provides a clear structural reference point for the exit.
4.4. Indicators to Combine with the Pattern
While a valid Gartley pattern is a strong signal on its own, its reliability increases significantly when confirmed by other technical indicators. This alignment of signals, known as “confluence,” is what we look for in A+ setups.
- RSI (Relative Strength Index): When a bullish completes at point D, check if the RSI is in “oversold” territory (below 30) or showing bullish divergence. This confirms that selling momentum is exhausted and a reversal is likely.
- MACD (Moving Average Convergence Divergence): A bullish crossover of the MACD line and signal line, or a bullish divergence on the MACD histogram, occurring within the PRZ provides strong confirmation of a potential upward move.
- Volume: In the spot Forex market, volume data is typically derived from tick volume (the frequency of price updates) rather than centralized exchange data. Therefore, volume should be treated as supportive evidence rather than an absolute requirement. Traders should prioritize price confirmation inside the Potential Reversal Zone over volume surges (EarnForex, n.d.).
Advanced traders may even use Elliott Waves to confirm the context of the larger move.
5. Example Walkthrough (Hypothetical)
Theory is important, but seeing the pattern on a chart is the best way to understand its power. Let’s analyze a hypothetical walkthrough in the forex market to see how these rules apply in practice.
Case Study: Bullish Gartley in Forex (EUR/USD)
- The Setup: On the EUR/USD 4-hour chart, a potential bullish pattern formed after a clear downtrend. The key X, A, B, and C points were identified, and Fibonacci tools projected the PRZ at the critical 0.786 retracement of the initial XA leg.
- The Trade: As the price entered the PRZ, a bullish engulfing candle appeared, providing the necessary confirmation signal. An entry was taken with a stop-loss placed just below the X point. Profit targets were set at the 0.382 and 0.618 Fibonacci retracements of the move from A to D.
- The Outcome: The price reverses from the PRZ, hitting the first profit target. The trade demonstrates how the pattern identifies the specific point where a temporary dip ends and the primary trend resumes.
6. Advantages and Limitations
Like any technical tool, the Gartley pattern has distinct strengths and weaknesses. Understanding this balance is key to using it effectively.
6.1. Advantages
When identified correctly, the pattern offers traders several distinct advantages:
- High probability of reversal: The pattern’s strict Fibonacci rules help filter out market noise, often identifying potential reversal points with a high degree of accuracy.
- Clear and objective rules: It provides specific, non-subjective levels for entry (point D), stop-loss (point X), and profit targets, which removes guesswork from the trading process.
6.2. Limitations
However, no pattern is perfect, and traders must be aware of the potential drawbacks:
- Potential for false signals: Like all patterns, the Gartley can fail. A false signal can occur if the price continues to trend past the PRZ, especially in highly volatile markets.
Reliance on confirmation: The pattern is most effective when not used in isolation. It often requires confirmation from other indicators (like RSI or MACD) or price action signals to increase its reliability.
7. Frequently Asked Questions (FAQs)
8. The Bottom Line
Gartley patterns remain a cornerstone of harmonic trading, providing a disciplined framework for entering trades at the end of market corrections (Gartley, 1935). By mastering the 5-point structure and its specific Fibonacci requirements, traders can identify precise entry points where the risk-to-reward ratio is most favorable. Always ensure the pattern is supported by broader market context and volume confirmation before execution.
To continue building your chart analysis expertise, explore our comprehensive Forex Chart Patterns category on Piprider.


