
How can you distinguish between a powerful, sustainable trend on EUR/USD and a fleeting price spike that’s about to collapse? The guppy multiple moving average (GMMA) is a brilliant visual instrument designed to answer that very question, helping traders to see the complete picture of market psychology and trend vitality.
This guide serves as a definitive manual for the GMMA, moving beyond abstract theory to provide actionable, Forex-centric strategies for immediate application.
Key Takeaways
- Guppy Multiple Moving Average (GMMA) visualizes market sentiment using two groups of moving averages.
- Wide separation between the two groups signals a strong, healthy trend.
- The long-term (red) group of MAs defines the primary, underlying trend direction.
- The highest-probability trade is buying a pullback of the short-term group into the long-term group.
- This indicator is a lagging, trend-following indicator designed to follow trends, not predict reversals.
- Best For: Identifying trend strength and entering pullbacks in strongly trending markets (Forex, Crypto, Stocks).
- Avoid When: The market is “choppy” or ranging sideways, as the lines tangle and produce false signals (whipsaws).
1. What is the guppy multiple moving average (GMMA)?
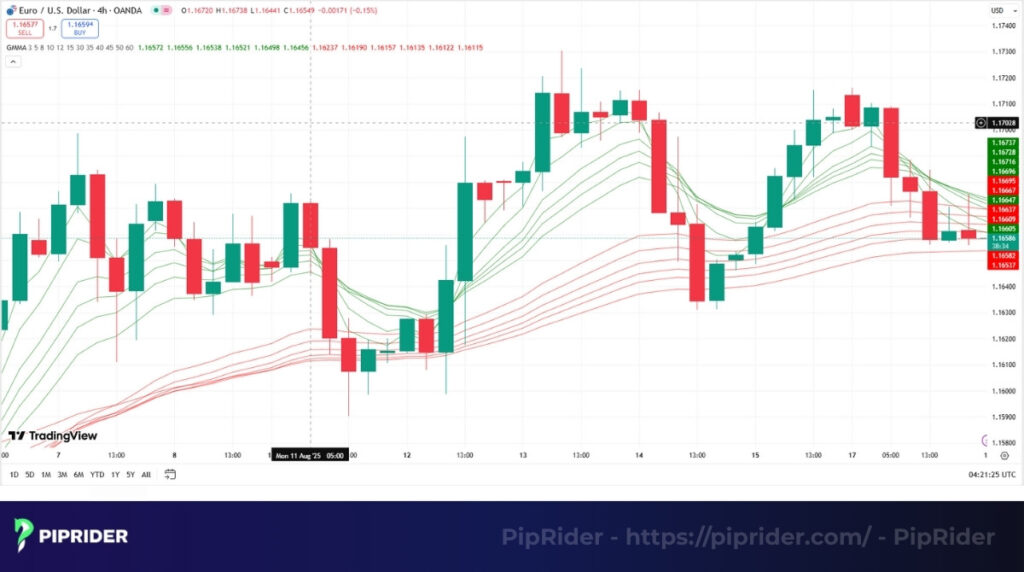
The Guppy Multiple Moving Average (GMMA) is a technical analysis indicator that uses twelve separate exponential moving averages (EMAs) to identify the direction, strength, and health of a market trend. This indicator works by visually separating the behavior of short-term traders from that of long-term investors. These two components are shown on the chart below:
Daryl Guppy, a renowned Australian trader and author, created the powerful Guppy Multiple Moving Average (GMMA) indicator, first detailing its concept in his 1996 book Trend Trading (Guppy, 1996). According to sources such as Investopedia, the GMMA was not merely intended to generate simplistic crossover signals; rather, it was designed to help traders interpret market psychology and understand the consensus between short-term speculators and long-term investors (Investopedia, 2008).
By plotting two distinct groups of moving averages, the GMMA provides a unique window into the market’s structure. A trader can instantly see if a trend is driven by short-term speculation or supported by the conviction of long-term institutional money. This insight is what makes the GMMA an invaluable tool for any serious trend-follower.
Conceptually, it shares some DNA with the alligator indicator, which also uses multiple smoothed averages to identify market phases. However, the GMMA expands on this by distinctly visualizing the battle between short-term speculators and long-term investors.
2. The components of the GMMA indicator
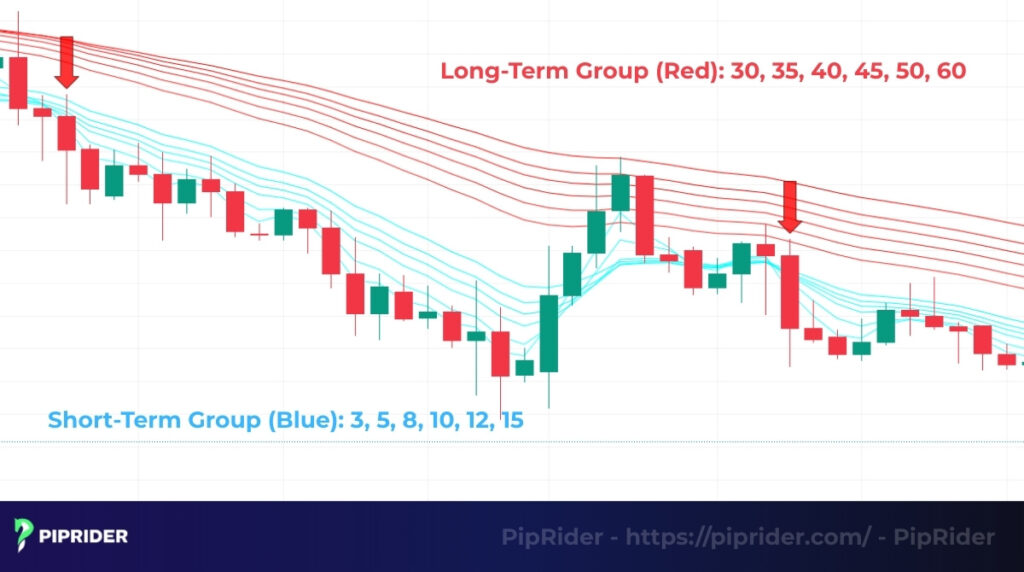
The Guppy Multiple Moving Average is built from 12 Exponential Moving Averages (EMAs) divided into two distinct groups. This separation allows traders to distinguish between speculative noise and the underlying trend.
Below is the breakdown of the standard settings used by professional traders:
| Group (Market Participant) | EMA Periods | Market Role (Psychology) |
| Short-Term (“Traders”) | 3, 5, 8, 10, 12, 15 | Represents speculators. Highly sensitive to news and short-term volatility. Used to gauge the immediate momentum and “fear/greed” of the market. |
| Long-Term (“Investors”) | 30, 35, 40, 45, 50, 60 | Represents institutions (Smart Money). Used to define the primary trend direction. Wide separation indicates strong institutional support/resistance. |
GMMA Default Template
Use these exact settings when configuring your trading platform (MT4, MT5, or TradingView):
- Method: Exponential Moving Average (EMA)
- Apply to: Close Price
- Short-Term Group (Blue):
3,5,8,10,12,15 - Long-Term Group (Red):
30,35,40,45,50,60
3. The GMMA indicator’s formula
Unlike complex oscillators, the GMMA’s power does not originate from a single, convoluted mathematical equation. Instead, the indicator is built from a foundational and widely trusted element of technical analysis. Its true strength lies in the visual interpretation of its components.
- EMA formula: The GMMA is formed by plotting 12 individual Exponential Moving Averages (EMAs), each calculated with the standard formula:
EMA = (Current Price – Previous EMA) * Multiplier + Previous EMA
Multiplier = (2 / (Lookback Period + 1))
- Short-term group: This consists of EMAs with periods 3, 5, 8, 10, 12, 15.
- Long-term group: This consists of EMAs with periods 30, 35, 40, 45, 50, 60.
While manual calculation is unnecessary, understanding that the indicator is built from EMAs is key to appreciating its role as an instrument for analyzing trend and momentum.
4. Forex trading strategies with the GMMA
Now we transition to practical application, where theory becomes trading decisions. Reading the GMMA is the art of observing the interplay between the two colored bands, as their relationship reveals everything you need to know about a trend’s health, direction, and strength.
4.1. Decoding the Trend: Visual Signals
Before entering a trade, you must diagnose the “health” of the trend. The GMMA offers three primary visual states: Expansion, Compression, and Crossover.
- Expansion (Strength): When the Long-Term group (Red) spreads apart widely, it confirms strong institutional support.
- Compression (Indecision): When both groups tighten into a thin line, volatility is low. A breakout is imminent.
- Crossover (Reversal): When the Short-Term group crosses through the Long-Term group, signaling a shift in sentiment.
GMMA Signal Cheat Sheet
Use this quick reference table to distinguish between high-probability setups and risky reversals.
| Signal Quality | Signal Type (Blue vs. Red) | Market Psychology | Action |
| Risky | Bullish Reversal (Blue crosses ABOVE Red) | Sentiment is shifting, but the trend is unproven. | Wait: Do not buy yet. Wait for a retest to confirm support. |
| High Probability | Bullish Pullback (Blue dips into Red & curls up) | Value Buying. Institutions are buying the dip. | BUY: Enter when the Blue group curls back upwards. |
| Risky | Bearish Reversal (Blue crosses BELOW Red) | Sentiment is collapsing, but false breakouts are common. | Wait: Do not sell yet. Wait for a retest to confirm resistance. |
| High Probability | Bearish Pullback (Blue rallies into Red & curls down) | Value Selling. Institutions are selling the rally. | SELL: Enter when the Blue group curls back downwards. |
| No Trade | Sideways Chop (Lines are tangled & flat) | Indecision. No consensus between buyers and sellers. | Stay Out: Wait for the ribbons to separate. |
4.2. Strategy 1: The Trend-Following Pullback (High Probability)
The Trend-Following Pullback is widely considered the “bread and butter” of GMMA trading. The strategy capitalizes on Strong Trends where the Long-Term Group (Red) is widely separated and sloping steeply. The goal is to align the entry with institutional flow after short-term speculators have taken profits, effectively buying at a “discount.”
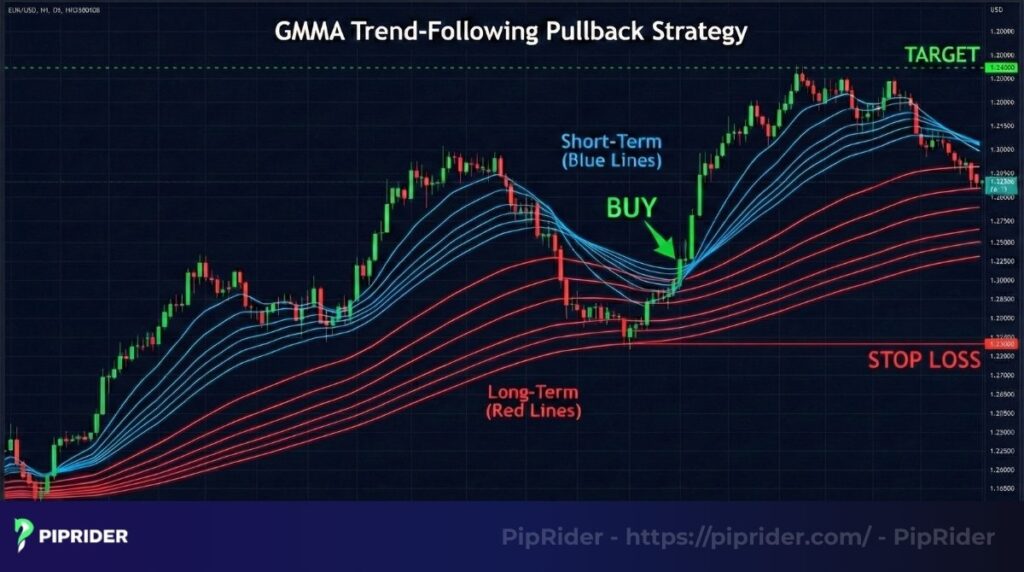
Execution Rules:
- The Setup: Price retraces against the trend, causing the Short-Term Group (Blue) to dip into the Red group. Crucially, the Red group must remain stable and not compress significantly.
- Entry Trigger: Wait for the Blue group to “curl” back out of the Red group. Enter on the break of the first candle high (for buy) or low (for sell) after the curl.
- Stop Loss: Place strict stops just below the 60-period EMA (the outer edge of the Red group). If price breaks this line, institutional support has failed.
- Take Profit: Use a trailing stop (trailing the Red group) or target the previous Swing High.
- Invalidation: The trade is void if the Short-Term group crosses completely through the Long-Term group to the other side.
- Common Mistake: Buying blindly when price touches the Red lines without waiting for the “curl” confirmation.
4.3. Strategy 2: The Trend Reversal (Full-Group Crossover)
The Trend Reversal strategy captures the birth of a new trend. While the setup offers the highest potential reward, the trade carries higher risk because calling a top or bottom is notoriously difficult. Success here depends entirely on waiting for the “Retest.”
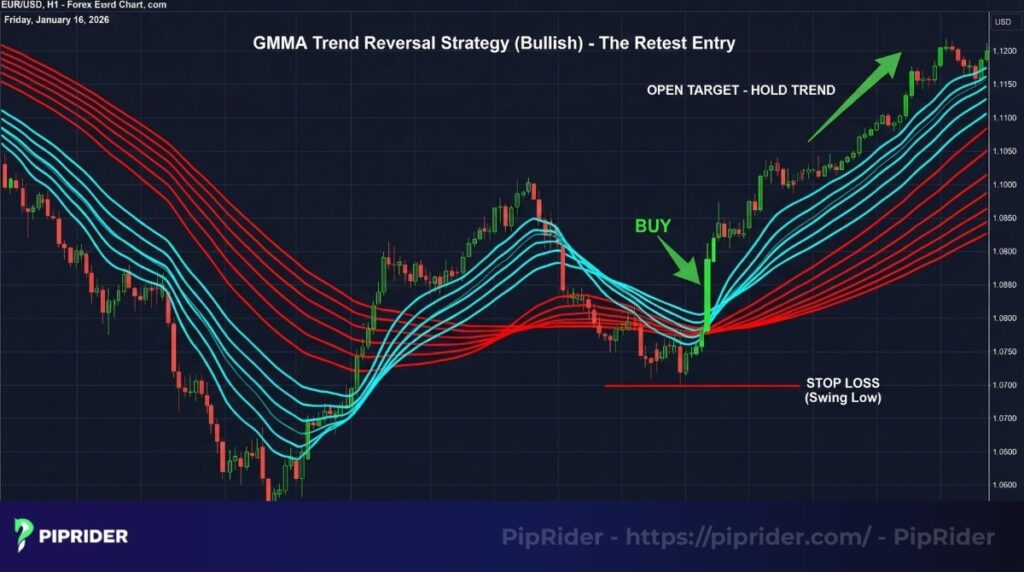
Execution Rules:
- The Setup: A massive shift in momentum occurs where the Short-Term Group (Blue) crosses completely over/under the Long-Term Group (Red). The Red group begins to twist and change direction.
- Entry Trigger: Do not enter on the initial crossover. Wait for price to pull back and touch the Red group (now acting as new support/resistance). Enter when price bounces off the Red group in the new direction.
- Stop Loss: Place the stop below the recent Swing Low formed during the retest.
- Take Profit: Open target. Hold the position as long as the Red group remains expanded to capture the full trend.
- Invalidation: If the retest fails and price sinks back into the Red group, the move is a “Fakeout.” Exit immediately.
4.4. Strategy 3: The Compression Breakout (Volatility Trade)
The Compression Breakout is designed for periods of low volatility, often preceding major news events like Non-Farm Payrolls (NFP). In this phase, the market is like a coiled spring, storing energy for a violent move.
Execution Rules:
- The Setup: Complete Compression. Both the Blue and Red groups are squeezed tightly together into a single, thin, horizontal line.
- Entry Trigger: Place Pending Orders (Buy Stop above the range high, Sell Stop below the range low). The entry triggers when price explodes out of the compression zone.
- Stop Loss: Place the stop at the midpoint of the compression range.
- Take Profit: Target a 1:2 Risk-Reward ratio quickly, as breakouts can be violent but short-lived.
- Common Mistake: Trading during the compression phase. Such attempts usually result in losses due to choppy price action (Whipsaws).
4.5. Strategy 4: The Cross-Confirmation (GMMA + RSI + Fib)
The Cross-Confirmation method adds a “Confluence Filter” to Strategy 1. By requiring agreement from multiple indicators, traders can filter out low-quality signals and focus only on the highest probability setups.
Execution Rules:
- The Setup: A standard Pullback setup (Strategy 1) forms, but the pullback aligns with a Fibonacci Retracement level (38.2% or 50%).
- Entry Trigger: Enter ONLY if the RSI (14) indicates momentum is returning (e.g., hooking up from oversold territory) exactly as the GMMA Blue group curls up.
- Stop Loss: Place the stop below the 61.8% Fibonacci level.
- Take Profit: Target the 0% Fibonacci level (previous high) and the -27% extension level.
- Invalidation: The setup fails if price breaks the 61.8% Fib level or if RSI shows no sign of reversal.
5. Risk Management with GMMA: The Survival Rules
Even the best trend-following system will fail without strict risk controls. Because GMMA is a lagging indicator, traders are vulnerable to sudden reversals. To protect your capital, apply these three non-negotiable rules.
Rule 1: Dynamic Stop Loss Placement
Never place a Stop Loss based on an arbitrary number of pips (e.g., “always 20 pips”). Instead, use the GMMA ribbons as dynamic support/resistance barriers.
- Conservative Stop (Standard): Place the SL just beyond the 60-period EMA (the outer edge of the Long-Term Red group). This allows the price “breathing room” to fluctuate within the trend without stopping you out prematurely.
- Aggressive Stop (Momentum): In extremely strong trends (parabolic moves), trail your SL behind the 15-period EMA (the outer edge of the Short-Term Blue group) to lock in profits quickly.
- Technical Stop: Always compare the EMA level with the most recent Swing High/Low. If the Swing point is safer, prioritize price action over the indicator.
Rule 2: Volatility-Based Position Sizing (ATR)
The width of the GMMA bands visualizes volatility. Use this to adjust your lot size.
- Wide Bands (High Volatility): When the ribbons are widely expanded, your Stop Loss (behind the 60 EMA) will be far from your entry. Action: Reduce your lot size to maintain the same % risk.
- Narrow Bands (Low Volatility): When entering a Compression Breakout, your Stop Loss is tighter. Action: You can slightly increase lot size while risking the same dollar amount.
- The ATR Formula: Use the Average True Range (ATR) indicator to calculate the exact distance. Lot Size = (Account Risk in $) / (ATR Stop Distance × Pip Value)
Rule 3: The “False Signal” Filter Checklist
To avoid “Whipsaws” (getting caught in a fakeout), never take a GMMA signal in isolation. Run it through this 3-step filter:
- The ADX Filter: Check the Average Directional Index (ADX). If ADX is below 20, the market is range-bound. Ignore all GMMA crossover signals.
- The RSI Filter: Check for divergence. If price makes a higher high but RSI (14) makes a lower high, the trend is exhausted. Do not enter a “Buy Pullback” here.
- The S/R Filter: Look left. Are you buying directly into a major weekly Resistance level? If yes, wait for a clear breakout and retest before trusting the GMMA expansion.
6. Best GMMA Settings: Optimizing for Timeframes
While the standard settings (3-15 and 30-60) are mathematically balanced, professional traders often adapt the indicator to suit the specific “noise” levels of different timeframes.
Below is a guide on how to tune the GMMA for Scalping, Day Trading, and Swing Trading without breaking the indicator’s logic.
| Trading Style | Timeframe | Recommended Settings (Long-Term Group) | Why Change It? |
| Scalping | M5 – M15 | Adjust to: 35, 40, 45, 50, 55, 65 | Noise Filtration. Lower timeframes have more random spikes. Slightly widening the Long-Term group helps filter out false breakouts and minor whipsaws. |
| Day Trading | H1 | Default: 30, 35, 40, 45, 50, 60 | Balance. The H1 chart bridges the gap between noise and trend. The default settings capture intraday swings effectively. |
| Swing Trading (Best Performance) | H4 – D1 | Default: 30, 35, 40, 45, 50, 60 | The “Sweet Spot.” GMMA was originally designed for these timeframes. The default settings align perfectly with the weekly and monthly institutional flows. |
| Crypto Volatility | Any | Adjust to: 40, 45, 50, 55, 60, 70 | High Volatility. Crypto assets (like Bitcoin) often have deeper pullbacks. A slower Long-Term group prevents premature stop-outs during “wicks.” |
Warning: The Trap of “Curve Fitting”
Do not fall into the trap of changing the EMA numbers every time you lose a trade.
- When NOT to tweak: If the market is ranging (sideways), no setting will work. Changing the numbers to 35-70 just to make a past chart look “perfect” is called Overfitting. It works on history but fails in live trading.
- Rule of Thumb: Stick to one set of parameters for at least 50 trades before making any adjustments. Consistency is more important than perfection.
7. GMMA vs. Other Indicators: A Technical Comparison
Comparing the Guppy Multiple Moving Average (GMMA) to other technical tools reveals its unique advantage: Psychological Visualization. While indicators like MACD track momentum and single EMAs track price location, GMMA isolates the interaction between traders and institutions to gauge trend health.
7.1. GMMA vs. Single Moving Average (EMA)
The primary difference between a Single EMA and the GMMA is Analytical Depth. A single moving average (e.g., EMA 200) offers a binary trend view (bullish or bearish), whereas the GMMA provides a multi-dimensional map of trend strength, volatility, and conviction.
- The Limitation: A single line tells you where the price is but fails to explain why it is there or if the trend is fragile.
- The GMMA Advantage: By analyzing the spacing between the ribbons, GMMA reveals the specific participation levels of institutions.
7.2. GMMA vs. Generic MA Ribbons
GMMA is distinct from generic Moving Average Ribbons due to its Non-Linear Grouping. Standard “Rainbow” indicators typically use evenly spaced intervals (e.g., 10, 20, 30) purely for visual smoothing. In contrast, GMMA uses two calculated clusters (3-15 and 30-60) with an intentional gap to isolate the battle zone between speculators and investors.
7.3. Comparison Matrix: Choosing the Right Tool
The following comparison matrix breaks down the core functions of GMMA, MACD, and Ichimoku Cloud to help you select the optimal tool for your strategy.
| Feature | GMMA | MACD | Ichimoku Cloud |
| Primary Function | Trend Quality & Psychology | Momentum & Divergence | S/R Zones & Projections |
| Best Used For | Visualizing Sentiment. Identifying trend strength and compression breakouts. | Timing Triggers. Spotting entry points within an existing trend. | Key Levels. Finding dynamic support/resistance levels. |
| Weakness | Whipsaws in ranging markets. | Lags in strong parabolic moves. | Can be visually cluttered/complex. |
| Verdict | Use for Context (Trend Health). | Use for Entry (Timing). | Use for Structure (S/R). |
Pro Tip: Combine GMMA with MACD for a complete system. Use GMMA to determine the “Big Picture” trend direction and MACD to pinpoint the exact entry candle.
8. Pros and Cons of GMMA
Evaluating the Guppy Multiple Moving Average requires a balanced look at its ability to track institutional flow versus its inherent lag. Understanding these strengths and weaknesses is essential for avoiding costly mistakes in live trading.
8.1. The Advantages (Pros)
The main advantage of the GMMA is its unique capacity to translate complex market psychology into a simple visual map. The system excels in trending environments by offering the following benefits:
- Visualizes Market Psychology: Unlike a single moving average, the GMMA reveals the deeper battle between short-term speculators and long-term investors. The “gap” between ribbons shows the true conviction behind the trend.
- Filters Out Market Noise: The Long-Term group (Red) acts as a buffer zone. The indicator prevents traders from panic-selling during minor price pullbacks, allowing them to hold winning positions longer.
- Identifies Explosive Breakouts: The “Compression” signal—where all 12 lines pinch together—is one of the most reliable precursors to a major volatility expansion.
- Dynamic Risk Management: The outer edge of the Long-Term group (60 EMA) provides a clear, objective level for placing trailing stops, removing emotional guesswork.
8.2. The Disadvantages (Cons)
Traders must understand that GMMA is inherently a reactive, lagging tool rather than a predictive instrument. It suffers from specific technical limitations:
- Inherent Lag: As a derivative of past prices, GMMA signals only appear after a move has already started. It will never identify the exact top or bottom of a trend.
- Fails in Ranging Markets: The lines tend to tangle during sideways price action, leading to frequent false signals (whipsaws). To filter this noise, consider using the Aroon Indicator, which helps distinguish between true trends and dangerous consolidations.
- Visual Clutter: Adding 12 separate lines can obscure raw price action. Traders may struggle to spot pure candlestick patterns (like Pin Bars) due to the heavy overlay.
- Requires Patience: The system produces fewer signals than oscillators like RSI. Impatient traders often force trades when the GMMA implies “No Action.”
Optimal Market Environments
Knowing when to deploy the GMMA is just as important as knowing how to use it.
- Best Conditions (The “Sweet Spot”): Strong, trending markets (e.g., Gold runs, Crypto bull markets) and post-news volatility expansions.
- Worst Conditions (The “Kill Zone”): Low-volume trading sessions (e.g., late Asian session) and tight consolidation boxes where price moves sideways.
9. Tips for trading with the GMMA effectively
Successful application requires adhering to a few professional guidelines. These tips will help you leverage the GMMA indicator’s strengths and avoid common pitfalls.
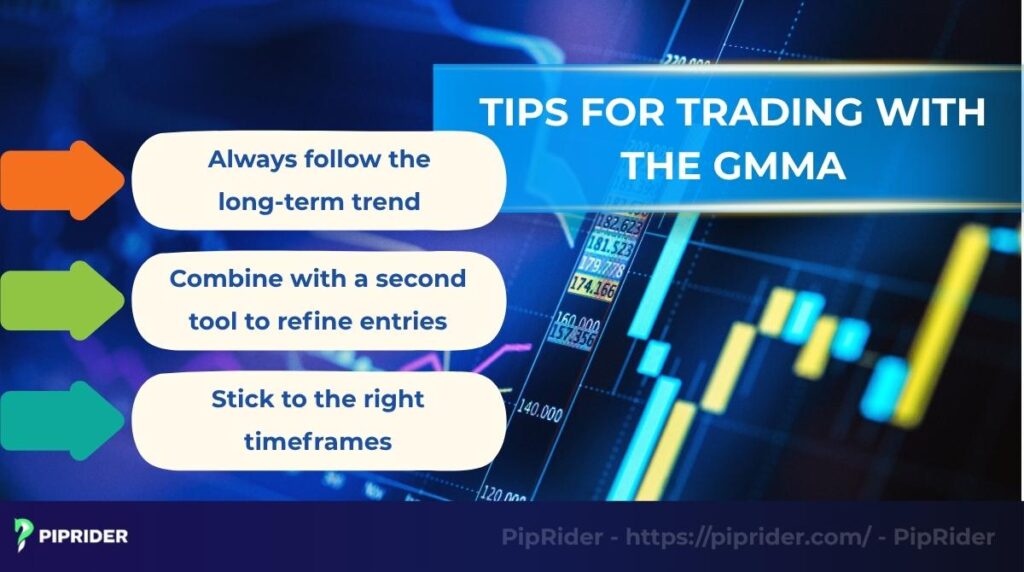
- Always follow the long-term trend: The red band acts as a non-negotiable compass. This group of moving average ribbon establishes the true, underlying trend. The single most important rule I’ve learned is to never place a trade that opposes the red band’s direction. Ignoring this principle can lead to costly mistakes, as doing so means fighting against the institutional flow.
- Combine with a second tool to refine entries: While the GMMA provides excellent market context, combining the indicator with a secondary tool can greatly improve entry timing. For instance, during a pullback into the red band, using an oscillator like the RSI to confirm an oversold condition provides a powerful confluence. Such a combination helps to filter out false signals and allows for a more precise entry.
- Stick to the right timeframes: In my professional experience, the GMMA’s reliability is highest on the H4 and D1 timeframes where it excels at identifying major trends. Attempting to use the indicator on lower charts like the M15 often results in excessive noise and conflicting signals, which can lead to poor decisions. The GMMA is a tool for seeing the big picture, not for scalping.
10. How to Set Up GMMA on Trading Platforms
Setting up 12 separate moving averages can be tedious. Below is the step-by-step guide to doing it correctly on the most popular platforms, along with a trick to save your setup forever.
10.1. On TradingView (Best Method)
Adding 12 individual EMAs manually on TradingView is inefficient and often blocked by the “3-indicator limit” on free accounts. The professional workaround is to use a pre-built Community Script.
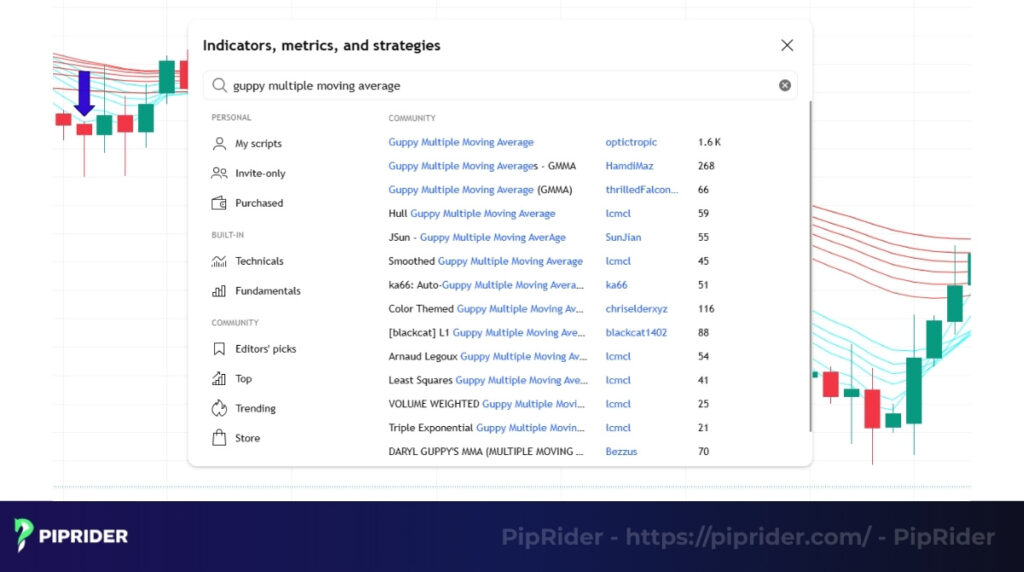
Step-by-Step:
- Open your chart on TradingView.
- Click on Indicators (top toolbar).
- In the search bar, type: “Guppy Multiple Moving Average”.
- Recommended Script: Select the version by ChrisMoody (CM_Guppy_EMA) or KIVANC. These are widely trusted and customizable.
- Click to add it to your chart.
- Customization: Click the “Settings” (gear icon) on the indicator to adjust line thickness or colors (e.g., make the Long-Term group thicker for better visibility).
10.2. On MetaTrader 4/5 (MT4/MT5)
Since MT4 does not have a native GMMA tool, you must build it manually once and save it as a template.
Step 1: Build the Short-Term Group
- Go to Insert > Indicators > Trend > Moving Average.
- Period:
3. Method:Exponential. Style:Blue(Thin line). Click OK. - Repeat this process 5 more times for periods:
5,8,10,12,15.
Step 2: Build the Long-Term Group
- Open the Moving Average tool again.
- Period:
30. Method:Exponential. Style:Red(Medium thickness). Click OK. - Repeat this process 5 more times for periods:
35,40,45,50,60.
Step 3: Save as Template (Crucial) Don’t repeat this work every time. Save it!
- Right-click anywhere on the black space of your chart.
- Select Template > Save Template.
- Name it
00-GMMA-Trend. - Now, you can apply this setup to any currency pair instantly by Right-clicking > Template > Load Template.
11. FAQs
12. Conclusion
The Guppy Multiple Moving Average is a unique and insightful trend analysis tool, perfectly suited for traders who wish to understand the deeper psychology of the Forex market. It moves beyond simple price analysis to visualize the consensus, or lack thereof, between short-term speculators and long-term market participants.
The key to success with the GMMA is concentrating on the relationship between the two groups of moving averages to accurately assess the health, strength, and direction of a trend.
Want to discover more trading indicators? Check out Piprider’s useful articles in Learn Forex categogy for Beginners.


