

Trendlines are the most essential tool for technical analysis. They define a market’s direction, identify dynamic support and resistance, and generate reliable trading signals. Learning how to draw trend lines correctly is critical for disciplined analysis.
This guide will give you the clear, objective steps needed to draw and apply valid trendlines immediately, helping you move from guesswork to informed trading.
Key Takeaways
- Trendlines define market direction and act as dynamic support (uptrend) or resistance (downtrend).
- A valid trend line requires connecting at least three significant swing points to confirm its reliability.
- Always draw on higher time frames (H4, Daily) as these provide more objective and reliable signals.
- The most actionable signals come from a price reversal off the line or a decisive breakout signaling a trend reversal.
- To minimize false signals, confirm trend line activity using volume or other technical indicators.
2. What Are TrendLines?
A trend line is a straight line drawn on a price chart that connects two or more significant pivot highs or pivot lows. It is a fundamental charting tool used in technical analysis to visually represent the prevailing direction and momentum of price action.

The primary function of a trend line is to visually define the market’s current direction, fulfilling the goal of how to find a trend. It is the simplest tool technical analysts use, based on the principle that “the trend is your friend.”
A trend line provides several critical insights:
- Dynamic support and resistance: It creates a moving barrier. When drawn under the price, it acts as a buying zone; when drawn over the price, it acts as a selling zone. This aids in setting entry/exit points.
- Assessing trend health: The line’s slope reveals the trend’s strength: a steep slope indicates strong, but possibly unsustainable, momentum. Trend angles help here.
- Validating patterns: Trendlines are critical for validating patterns during periods of price contraction.
- Timeframe Versatility: While trendlines are usable on any timeframe, their reliability and significance increase on higher timeframes (H4, Daily, Weekly). Higher timeframes represent a broader market consensus and filter out the intraday “noise” that often leads to false signals on smaller charts.
3. Types of TrendLines
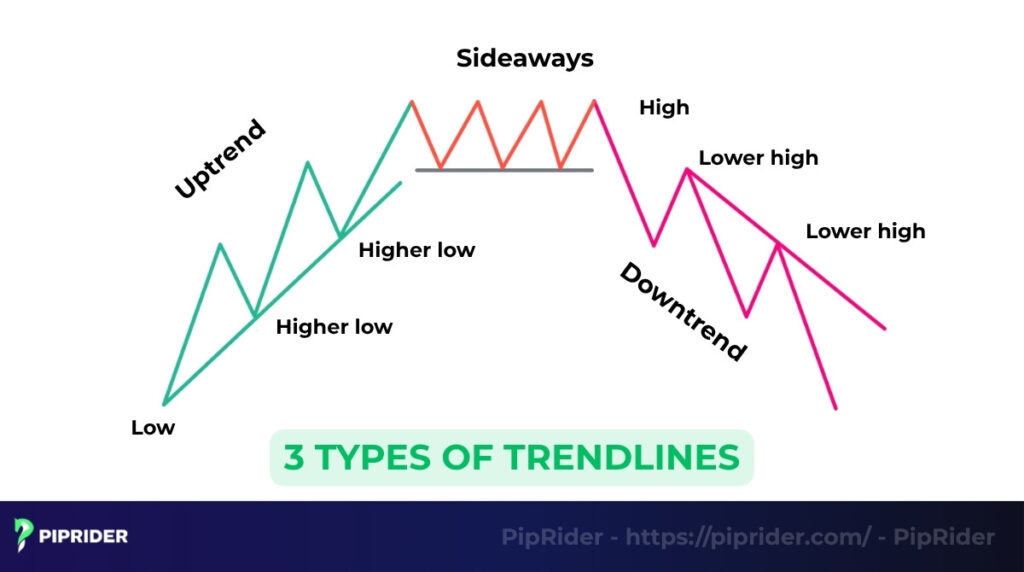
When drawing trendlines, traders will encounter three main types of trendline, each defining a different market condition. Understanding these is essential because each dictates a unique trading approach:
- Uptrend Line (Ascending): Connects the higher lows in a rising market. This line acts as dynamic Support, confirming a healthy bullish trend where demand is strong.
- Downtrend Line (Descending): Connects the lower highs in a falling market. This line acts as dynamic resistance, confirming a bearish trend where supply is strong.
- Horizontal Trend Line (Sideways): Connects equal highs or lows. This line defines a range-bound market, setting static Support and Resistance levels during a period of market indecision.
4. How to Draw Trend Lines: 5 Detailed Steps
Drawing a valid trend line requires discipline, not guesswork. Follow these five objective steps to draw reliable trend lines that provide a clear edge in your day-to-day market analysis.

Step 1 – Choose the Right Timeframe
Start your analysis on higher timeframes (H4, Daily). Lines drawn on these charts filter out intraday “noise” and are respected by far more institutional traders, providing significantly more reliable signals than those on lower timeframes.
Step 2 – Identify “Significant” Swing Points
Locate the major turning points where price direction decisively shifted. A significant pivot is not just any high or low; it must be a point that resulted in a structural change (e.g., a low that led to the creation of a new Higher High).
- Tip: Look for clear V-shape or A-shape formations. If you have to “squint” to see the pivot, it is likely too minor to be reliable for a major trendline.
Step 3 – Connect and Validate (The 3-Touch Rule)
Link the identified pivots to define the trend’s slope. While two points define a potential line, it is not considered confirmed until the price has touched and respected it at least three times.
- The Rule of Consistency: A trendline is a connection of two or more price points. You may connect wicks (extremes) or candle bodies (closing prices) on higher timeframes to filter out volatility, but you must stay consistent throughout the same line.
- Scientific Discipline: Never “force” a trendline to fit your personal bias; if it doesn’t fit the chart naturally, the line is invalid. Avoid “cheating” by slicing through the middle of candle bodies.
Step 4 – Extend the Line into a “Projection Zone”
Project the line far to the right of current price action. As described by Investopedia (n.d.), a trendline functions as a tool to identify price direction and dynamic support or resistance zones.
- Area to Watch: This extended line represents a projection zone, a specific area to monitor for potential price reactions.
- Sustainability: A 45° angle is often considered the most sustainable. Trendlines that are too steep (e.g., > 60°) often represent unsustainable momentum and are prone to sharp reversals.
- Observe Reaction: Instead of assuming a forecast, use this zone to watch how price interacts with the line: whether it shows signs of a rejection (bounce) or a decisive breach (breakout).
Step 5 – Adjust the Line as New Data Comes In
Redraw or adjust the line if the market changes speed. Markets are dynamic; if an asset accelerates (creating a steeper line) or decelerates, you must update your trendlines to reflect the current market reality. An old, ignored trendline is simply “dead” data.
5. Common Mistakes When Drawing Trendlines
Avoid these common pitfalls to ensure your technical analysis remains objective, reliable, and free from personal bias.
Forcing the Line to Fit a Bias
One of the most dangerous traps is attempting to “force” a trendline to support a trade you already want to take. As Babypips (n.d.) emphasizes, if a line does not connect naturally with clear pivot points or requires you to ignore significant price action, the trendline simply does not exist. A scientific approach requires the market to define the line, not the trader’s desire.
Mixing Wicks and Bodies (Inconsistency)
According to StockCharts (n.d.), consistency is the foundation of valid charting. A critical mistake is starting a trendline at a candle wick and ending it on a candle body. While both methods (Wicks vs. Bodies) are acceptable for filtering noise on higher timeframes, you must choose one method and apply it consistently across the entire line. Never slice through the “meat” (the middle) of candle bodies.
Over-complicating with “Chart Noise”
Resist the urge to draw every possible diagonal line you see. Too many lines lead to “analysis paralysis,” where conflicting signals make it impossible to execute a trade. Focus only on the most obvious, significant trends on higher timeframes (H4, Daily) to maintain a clean projection zone.
Ignoring the Slope’s Sustainability
Not all trendlines carry the same weight. A line with an extreme angle (e.g., greater than 60°) often represents a temporary momentum spike rather than a sustainable trend. Relying on these nearly vertical lines often leads to “buying the top” or “selling the bottom” just as the unsustainable move exhausts itself.
Using Trendlines in Isolation
A major mistake is treating a trendline touch as a guaranteed “buy” or “sell” signal. Trendlines are tools for identifying dynamic support and resistance, but they require confirmation. Failing to seek confluence, such as high volume, horizontal levels, or momentum oscillators, drastically increases the risk of falling for a false breakout.
6. Pro Methods and Tools for Drawing Trend Lines
Moving beyond the basics requires leveraging professional tools and confirmation techniques to boost confidence in your trade setups.
6.1. Using Charting Tools
For consistent results, avoid drawing freehand lines. Leverage your platform’s dedicated drawing tools to maintain geometric precision.
- TradingView Tools: Use the Trend Line tool for finite segments between specific pivots. For automated projections, use the Ray tool; it starts at your first pivot, passes through the second, and extends indefinitely in that direction to define your future projection zone.
- MetaTrader (MT4/MT5): Use the standard Trendline tool. To extend the line into the future, open the “Trendline Properties” and toggle the Ray option in the “Parameters” tab.
- Logarithmic Scale: For long-term analysis on Weekly or Monthly charts, always switch your chart to a Logarithmic Scale. This ensures your trendlines reflect percentage-based growth rather than absolute price changes, maintaining their structural validity over long periods of significant price appreciation.
6.2. Confirming with Indicators
A trendline’s signal is far stronger when confirmed by other technical tools rather than being used in isolation. Seeking confluence reduces the likelihood of entering on a “fakeout” and increases the probability of a successful trade.
- Volume Confirmation: Look for a surge in trading activity during a price rejection or a decisive breakout, as this suggests significant institutional participation.
- Scientific Note: Volume confirmation is most reliable on centralized markets (such as stocks or futures) where total transaction data is transparent. In the decentralized spot Forex market, treat “tick volume” as a proxy for market intensity rather than an absolute measure of capital flow.
- Moving Average Confluence: Seek setups where a validated trendline aligns with a major Moving Average (MA), such as the 50-day or 200-day MA. When these two dynamic levels converge, they create a much stronger psychological barrier that is harder for the market to breach.
- Momentum Oscillators: Use tools like the RSI (Relative Strength Index) or Stochastics to confirm market conditions at the trendline. For example, a bullish bounce off an uptrend line is significantly more reliable if the RSI simultaneously shows an oversold condition or a bullish divergence.
6.3. Advanced Techniques
Draw the primary trend line on a Daily or Weekly chart; this Multi-Timeframe Analysis ensures you never trade against the major trend. You can also use internal trend lines on lower time frames for micro-entries. Additionally, draw a parallel line on the opposite side of the price to create a trend channel. This technique defines the likely price boundaries, giving you clear profit targets and structured trading zones.
7. Trend Line Trading Strategies
Trendlines are designed for action. To move from analysis to execution, you must follow a strict set of rules for every trade. The most reliable setups center on two market events: the Bounce and the Breakout.
7.1. The Bounce Strategy (Trend Continuation)
This setup assumes the established trend will persist, allowing you to enter in the direction of the prevailing momentum.
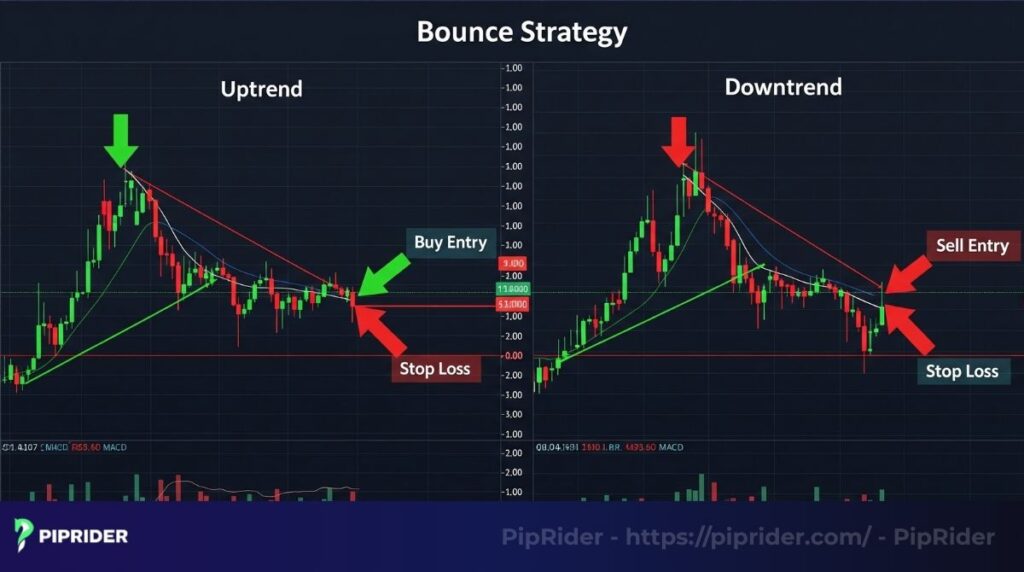
- Trigger: A clear rejection candle at the trendline, such as a Pin Bar or Engulfing candle, or the price “closing back inside” a trend channel.
- Entry: Open the position immediately after the confirmation candle closes.
- Stop-Loss (SL): Place the SL behind the most recent swing point, plus a small “buffer” to account for market volatility.
- Take-Profit (TP): TP1 should be set at the previous major swing high (in an uptrend) or swing low (in a downtrend); TP2 can be the opposite boundary of the trend channel.
7.2. The Breakout Strategy (Trend Reversal)
This strategy signals the potential exhaustion of the current trend and the birth of a new direction.
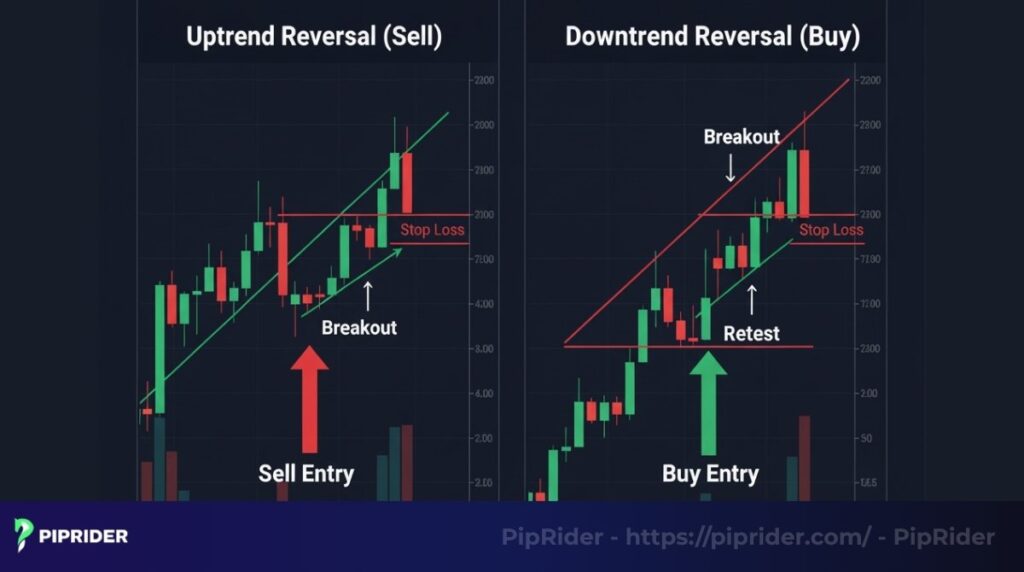
- The “Close” Rule: A valid breakout requires a candle to close decisively beyond the trendline. Never enter a breakout trade based on a “wick” piercing the line, as this often indicates a false breakout (fakeout).
- Conservative Entry: For higher-probability setups, wait for a breakout followed by a failed retest. Wait for the price to return and touch the broken trendline; if the price rejects that line (showing it has flipped from support to resistance, or vice versa), enter the trade.
- Stop-Loss: Place the SL behind the breakout candle or the retest peak to protect against a trend resumption.
7.3. Combining Trendlines with Static Support/Resistance
For a superior setup, combine the dynamic trendline with static horizontal levels marked on your chart.
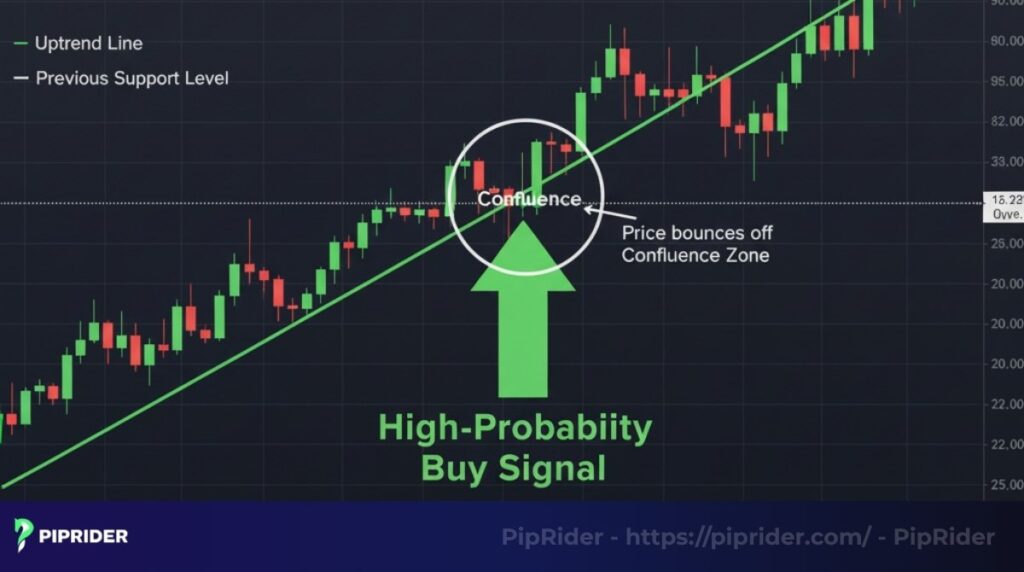
- The Confluence Zone: Seek instances where a horizontal support or resistance level converges with your diagonal trendline.
- Improved Setup Quality: While using multiple tools usually improves the setup quality and provides higher-conviction signals, remember that all trading is still probabilistic. No confluence zone guarantees a win; it simply identifies a high-interest area where institutional players are likely to react.
8. Pros and Cons of Using TrendLines
Trendlines are powerful, but like any tool, they have limitations. A disciplined trader must understand both the advantages and disadvantages.
| Advantages (Pros) | Disadvantages (Cons) |
|---|---|
|
|
9. FAQs (Frequently Asked Questions)
10. Conclusion – Your Checklist for Drawing Success
Mastering how to draw trend lines correctly requires discipline, not talent. Success comes from adhering to objective rules. Use this simple three-step checklist to ensure your lines are always reliable:
- Validate: Connect pivots consistently (using either wicks or bodies) and require a minimum of three touches.
- Filter: Use higher timeframes (H4 and Daily) to filter out market noise and focus only on the main, reliable trend.
- Confirm: Never trade solely on a trend line break or reversal. Always wait for confirmation from volume or other indicators.
Final advice for the beginner: Keep it simple, practice often, and only trade the most obvious trendlines. Your objective lines will directly enhance your confidence and improve your trading decisions.


