If you want to identify liquidity in trading, start by finding the obvious price levels where traders cluster stop-losses and breakout orders. These zones—found above old highs, below old lows, and around key daily or weekly reference levels, act as magnets for price. Understanding how to spot these ‘liquidity pools’ is the difference between trading with the market’s momentum or becoming the fuel for it.
This guide provides a professional framework to map these zones and use them to find high-probability entries.
Key Takeaways
- Liquidity is the fuel of the market, representing clusters of resting orders (SL, TP, Buy/Sell Stops) waiting to be filled.
- Main types include equal highs/lows, swing points, imbalances, and Fair Value Gaps (FVG).
- Smart money often pushes the price into these high-liquidity zones before initiating the true trend direction.
- Understanding liquidity helps define more precise entry points, stop-loss placements, and profit targets.
- Combining liquidity analysis with market structure and FVG is essential to filter signals and significantly increase your trade’s win rate.
1. What Is Liquidity in Trading?
Liquidity in trading is the ability of an asset or security to be bought or sold quickly in the market without causing major price movements. High liquidity means there are many active buyers and sellers, which leads to stable prices and low trading costs.
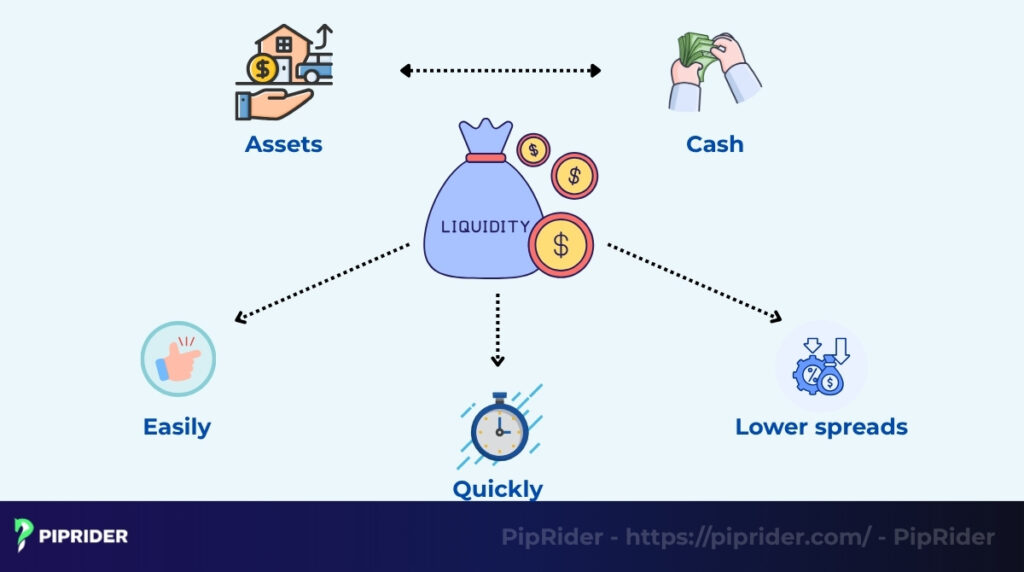
According to Investopedia (2025), this high liquidity helps traders minimize slippage risk (the difference between the expected price and the execution price) and makes it easier to exit a position at the desired time.
Understanding liquidity is crucial in all major financial markets, whether you are trading forex, crypto, stocks, or indices. In trading, the term “liquidity” is used in two very different ways:
- Traditional liquidity (Risk): The concept defined above. It is about market efficiency and safety: high volume, high trading activity, tight spreads, and low slippage. You check this to ensure a market is safe to trade.
- Smart money liquidity (Strategy): The SMC perspective. It refers to the pools of resting orders (like stop-losses) above old highs (Buy-Side) and below old lows (Sell-Side). You identify these zones to find strategic targets.
2. How Liquidity Works in Financial Markets
Liquidity is the engine of the financial markets. In Smart Money Concepts (SMC), traders interpret price as moving toward areas where large clusters of resting orders are likely to exist, rather than moving randomly. This mechanism helps facilitate the large trades required by institutions.
2.1. Order Flow & Why Price Seeks Liquidity
Price is always drawn to liquidity because that is where the most orders are. Institutions and Market Makers (like large banks) need to trade massive positions. To fill a huge “Buy” order, they need to find a large number of sellers.
The easiest place to find a massive number of “Sell” orders is at a price level where thousands of retail traders have placed their sell-stop orders (stop-losses). Therefore, price will often move to these zones specifically to “consume” that liquidity and fill the large orders, a sign of institutional activity.
To understand the scale of this necessity, consider that the global foreign exchange market reaches over $9.6 trillion in daily trading volume, according to the 2025 Triennial Central Bank Survey by the Bank for International Settlements (BIS). Institutions need massive liquidity pools to execute even a fraction of this volume without causing catastrophic slippage.
2.2. Liquidity Pools Explained
A liquidity pool is a price zone on the chart with a dense cluster of resting orders. These are not active trades; they are pending orders waiting to be triggered. Knowing which pool is being targeted tells you the Draw on Liquidity.
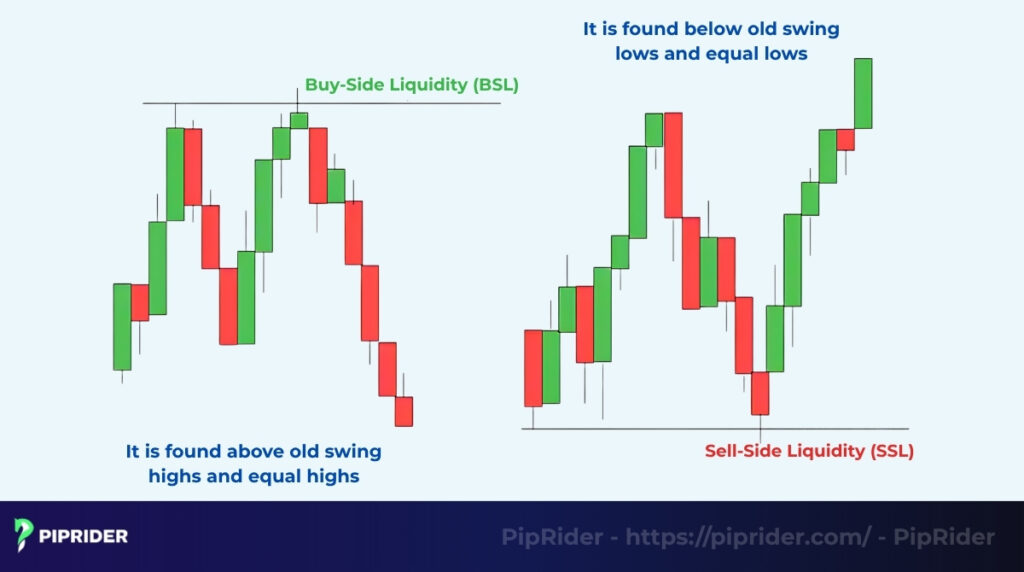
- Buy-Side Liquidity (BSL): A cluster of buy-stop orders resting above the current price (found at old swing highs or resistance).
- Institutional Logic: Smart Money drives price upward to “tap” into BSL. This allows them to fill their large Sell (Short) orders using the retail buy-stops as the counterparty. Once BSL is swept, watch for a Bearish Displacement.
- Sell-Side Liquidity (SSL): A cluster of sell-stop orders resting below the current price (found at old swing lows or support).
- Institutional Logic: Smart Money targets SSL to fuel their large Buy (Long) orders. By driving price into these sell-stops, they can buy in massive volumes. After the SSL sweep, watch for a Bullish Displacement.
3. What Types of Liquidity Zones Must You Know?
Liquidity pools are not random; they form at obvious technical price levels where traders are taught to place their orders. As an ICT trader, your job is to identify these specific zones before they are targeted.
3.1. Equal Highs & Equal Lows (Classic Liquidity)
Equal Highs (EQH) or Equal Lows (EQL) are the most classic liquidity patterns. They appear on a chart as two or more “tops” or “bottoms” at the exact same price level, looking like a clean line of resistance or support.
These historical price levels are magnets for retail traders’ stop-losses. Smart Money knows this and often executes a “sweep” of the equal highs or lows. This action triggers all the stops before the price is reversed in the other direction.
3.2. Swing Highs & Swing Lows
Every Swing High (a peak) and Swing Low (a valley) on the chart has liquidity resting just above or below it. A simple swing high is a pool of BSL (from short-sellers’ stop-losses). A simple swing low is a pool of SSL (from long-traders’ stop-losses).
3.3. Previous Day/Week High/Low
These are major liquidity zones watched by all traders. The Previous Day’s High (PDH), Previous Day’s Low (PDL), and the Previous Week’s High/Low (PWH/PWL) are extremely significant. A sweep of these levels is a very common setup used by institutions to start a new move, often triggered by geopolitical events.
3.4. Order Block Liquidity
An order block is a specific candle (or zone) that represents a large cluster of institutional orders, which can be confirmed using a volume profile. This zone itself contains liquidity, meaning price is often drawn back to it to “mitigate” or fill the remaining orders left behind.
3.5. Fair Value Gaps & Market Inefficiencies (The “Void”)
Unlike liquidity pools, a Fair Value Gap (FVG) or imbalance represents a “liquidity void”—an area where the market moved so fast in one direction that only one side (buyers or sellers) was filled.
While price is drawn to these zones, the mechanism is different:
- Liquidity Pools are “Swept” (price spikes through to trigger stops).
- FVGs are “Filled” or “Rebalanced” (price moves back into the gap to provide fair trading opportunities for both sides).
In SMC, trading fair value gaps (FVGs) is vital because these voids act like magnets, often being filled before the market continues its original trend.
4. External vs. Internal Liquidity: Which Matters More?
To move beyond the basics of SMC, traders must understand the relationship between External and Internal Liquidity. In professional market structure analysis, these two categories define the “Draw on Liquidity”—the roadmap of where the price is coming from and where it is naturally attracted to next.
4.1. External Range Liquidity (ERL)
External liquidity represents the major boundaries of the current trading range. These are the “extremes” that most traders are watching on higher timeframes.
- Key Zones: Major Swing Highs/Lows, Previous Day High/Low (PDH/PDL), and Previous Week High/Low (PWH/PWL).
- The Purpose: External liquidity is typically the primary objective or the ultimate Profit Target (TP). When price reaches these levels, traders look for major reversals or a complete shift in market character.
4.2. Internal Range Liquidity (IRL)
Internal liquidity exists inside the established trading range. It represents the “fuel” found between the major extremes.
- Key Zones: Minor swing points within a range, micro-pullback lows, Fair Value Gaps (FVG), and Order Blocks (OB).
- The Purpose: Internal liquidity often acts as a magnet or a “midway” target. In a healthy trend, price will often sweep internal liquidity (a minor pullback) to gather enough orders to reach the next external target.
4.3. The Liquidity Cycle: How the Market Moves
The market typically moves in a continuous cycle: from External to Internal (to rebalance) and from Internal to External (to sweep).
Actionable Takeaway: If the price has just swept a major External High (ERL), its next likely “Draw on Liquidity” is an Internal FVG or Order Block (IRL) to seek balance. Conversely, if price sweeps a minor Internal Low (IRL) during an uptrend, it is likely gathering the necessary fuel to target the next major External High (ERL).
5. Start With Higher Timeframe Bias Before Marking Liquidity
One of the most dangerous mistakes in Smart Money trading is marking every single swing or gap as a “liquidity zone.” Without a Higher Timeframe (HTF) Bias, your chart becomes a cluttered mess of lines that leads to “analysis paralysis.”
In professional trading, you don’t look for liquidity first; you look for direction first. Liquidity is the fuel, but the HTF Bias is the map that tells you where the market wants to go.
5.1. What Is HTF Bias?
HTF Bias is the “Compass” of your trade. It is the prevailing trend or direction determined on the Daily (D1) or 4-Hour (H4) charts.
- Bullish Bias: Market structure is making Higher Highs and Higher Lows. The market is looking to expand upward.
- Bearish Bias: Market structure is making Lower Highs and Lower Lows. The market is looking to expand downward.
5.2. The “Draw on Liquidity” Principle
Liquidity is only significant if it aligns with the Draw on Liquidity of the higher timeframe. A sweep that aligns with the HTF bias has a significantly higher win rate than one that fights it.
- In a Bullish Trend: The market’s primary objective is to reach Buy-Side Liquidity (BSL) above old highs. Therefore, every sweep of Sell-Side Liquidity (SSL) during a pullback is a high-probability “Buy” signal to gather fuel for the next leg up.
- In a Bearish Trend: The market’s primary objective is to reach Sell-Side Liquidity (SSL) below old lows. Every sweep of Buy-Side Liquidity (BSL) during a rally is a high-probability “Sell” signal to gather fuel for the next leg down.
5.3. Filtering the Noise
By identifying your HTF bias first, you can ignore 80% of the minor liquidity zones on your chart.
- If the H4 trend is Strongly Bullish, don’t waste time looking for reversals at every M15 swing high. Instead, look for that one major sweep of an internal low to join the move.
- The Golden Rule: A sweep against the HTF bias is often a low-probability “trap.” A sweep with the HTF bias is a high-probability “setup.”
Actionable Takeaway: Before you mark a single equal high or FVG, ask yourself: “Where is the Daily/H4 chart trying to go?” If the HTF is targeting a major Daily High, ignore the small sells and focus only on the sweeps that give you fuel to go long.
6. How to Identify Liquidity in Trading (Step-by-Step)
Quick Liquidity Mapping Order
To avoid chart clutter, always map your liquidity zones in this specific order of priority:
- [Tier 1] High Priority: Previous Day/Week Highs and Lows (PDH/PDL & PWH/PWL).
- [Tier 2] Engineered Liquidity: Clean Equal Highs and Equal Lows (EQH/EQL).
- [Tier 3] Market Structure: Major Swing Highs and Lows (HTF Swings).
- [Tier 4] Market Inefficiencies: Recent Imbalances and Fair Value Gaps (FVG). (Note: These are filled to rebalance, not swept for stops).
- [Refinement]: Refine your entry only after a sweep occurs using Order Blocks (OB) or Volume Profile.
Identifying liquidity on a chart is a five-step process. You start by marking the obvious price levels where stop-losses are likely clustered, such as equal highs/lows and swing points. Then, you map out previous day/week levels and spot imbalances (FVGs). This process reveals the Buy-Side and Sell-Side Liquidity zones that Smart Money targets.
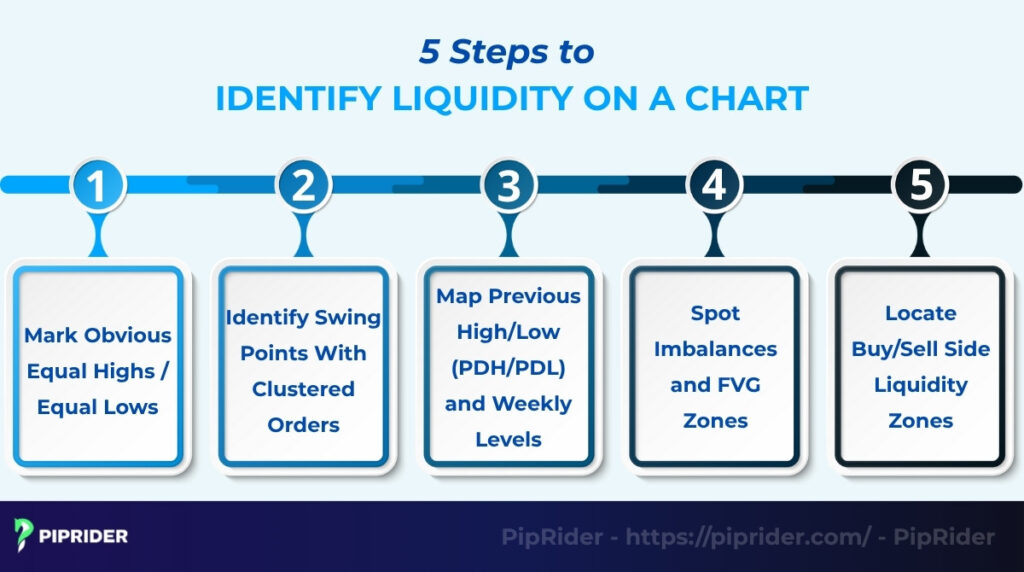
6.1. Step 1: Mark Obvious Equal Highs / Equal Lows
Start by looking for the most “obvious” targets on your chart. Equal Highs (EQH) and Equal Lows (EQL) are clean, horizontal levels that look like perfect resistance or support. Retail traders are taught to place their stop-losses just above or below these levels, which creates a dense pool of liquidity.
6.2. Step 2: Identify Swing Points With Clustered Orders
Look for any significant Swing High (a peak) or Swing Low (a valley). Every time the price creates a new peak, short-sellers place their stop-losses just above it. Every valley has stop-losses from long traders just below it. These individual swing points are also liquidity targets.
6.3. Step 3: Map Previous High/Low (PDH/PDL) and Weekly Levels
On a daily basis, map out the Previous Day’s High (PDH) and Previous Day’s Low (PDL). These are major liquidity levels. You should also mark the Previous Week’s High (PWH) and Previous Week’s Low (PWL). A sweep of these key timeframe levels is a very significant event.
6.4. Step 4: Spot Imbalances and FVG Zones
The absence of trades can also be a signal. Look for imbalances or Fair Value Gaps (FVGs), also known as liquidity voids, which are large, fast candles that left an inefficient “void” in the market. Price is often drawn back to these to “fill” them before moving on.
6.5. Step 5: Locate Buy/Sell Side Liquidity Zones
Finally, label these zones. BSL is the pool of buy-stop orders above resistance (above Swing Highs/Equal Highs). SSL is the pool of sell-stop orders below support (below Swing Lows/Equal Lows). Knowing which side is being targeted tells you the likely direction of the next institutional price movements.
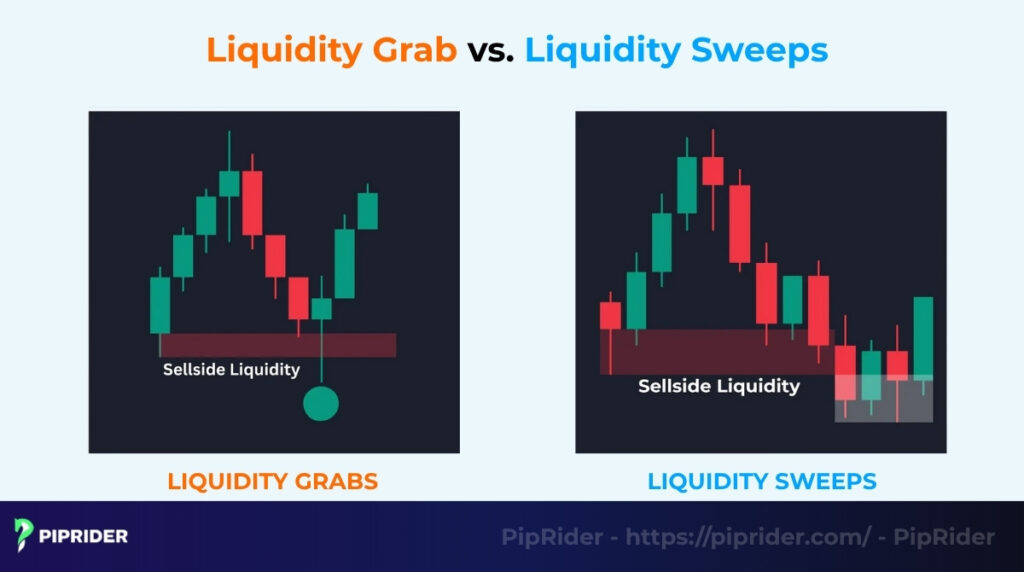
7. What Are Liquidity Grabs, Sweeps & Stop Hunts?
These three terms: liquidity grab, liquidity sweep, and stop hunt all describe the same event. They refer to the specific action of price moving just beyond an obvious swing high or low, triggering all the clustered stop-loss orders waiting there.
7.1. What Is a Liquidity Grab?
A liquidity grab is typically interpreted as a stop-run into a known liquidity pool before price either reverses or continues. Price will move to a level, take out the resting stop orders, and then quickly react. The underlying theory is that institutions use this surge of retail stop-loss orders to efficiently fill their own massive positions.
7.2. Stop Hunt vs. True Reversal
This is the hardest part of price dynamics for a trader: how do you know if the move that looks like a stop hunt isn’t just the beginning of a true new trend?
- A stop hunt (or “Sweep”) is a “fakeout.” Price breaks the high/low, triggers the stops, and then immediately reverses back into the previous trading range.
- A true reversal (or Breakout) is a “real” move. Price breaks the high/low and then continues moving in that new direction.
7.3. How to Confirm a Liquidity Sweep
You can never be 100% sure, but you can wait for confirmation signals after the sweep happens. Never trade during the sweep; wait for the market to show its hand.
The three main confirmations are:
- Market Structure Shift (MSS / CHoCH): This is your #1 signal. After a price sweeps a low (SSL), you wait for it to rally back up and break the last minor swing high. This “Change of Character” (CHoCH) is the first sign that the downtrend is over and a reversal is in play.
- Displacement Candle: Look for a single, long, powerful candle that moves away from the swept zone. This “displacement” price action shows strong, aggressive buying or selling and confirms the reversal has real momentum.
- FVG / OB Confirmation: After the sweep and the Market Structure Shift, the price will often create a new Fair Value Gap (FVG) or Order Block (OB). This new zone becomes your high-probability entry point to join the new trend.
8. Does a Liquidity Sweep Mean Reversal or Continuation?
A common mistake among beginner SMC traders is assuming every liquidity sweep signals an immediate reversal. In reality, a sweep is simply a “fueling event.” Whether the market reverses or continues depends entirely on the context of the move and the Higher Timeframe (HTF) trend.
8.1. The Reversal Scenario (External Sweep)
When price sweeps a major, long-standing liquidity pool at the boundaries of a range, it often signals a Reversal.
- Targeting ERL: This usually involves Previous Day High/Low (PDH/PDL), Previous Week High/Low (PWH/PWL), or major Equal Highs/Lows at the extremes.
- The Logic: Once these major resting orders are cleared, the “Draw on Liquidity” in that direction is exhausted. The market then seeks to rebalance by moving toward the opposite end of the range.
- Key Confirmation: You must wait for a Market Structure Shift (MSS) on a lower timeframe. If the price sweeps a high and then aggressively breaks a recent swing low, the reversal is confirmed.
8.2. The Continuation Scenario (Internal Sweep)
In a strong trending market, price often performs a “minor sweep” to shake out early traders before accelerating. This is a Continuation setup.
- Targeting IRL: These occur at minor swing points inside a trend, micro-pullback lows, or quick dips into an internal Fair Value Gap.
- The Logic: These are often called “washouts.” Institutions target the stop-losses of late-joining retail traders to gather enough momentum for the next “leg” of the trend.
- Key Confirmation: Price sweeps the internal low/high but fails to shift structure. Instead, it quickly closes back in the direction of the main trend (often leaving a long wick).
8.3. The Golden Rule: HTF Context is King
To identify the difference, always look at the higher timeframe:
- A sweep against the H4 trend is often a Reversal signal for a deep pullback.
- A sweep that aligns with the H4 trend (e.g., sweeping a minor low in an uptrend) is a high-probability Continuation signal.
Comparison: Reversal vs. Continuation Bias
9. What Is Liquidity Confluence? (For High-Probability Setups)
A liquidity signal becomes much stronger when it is combined with other confirmation signals. This combination is called “confluence,” and it is the key to filtering out bad trades and finding high-probability setups.
Here are the most powerful confluence combinations to look for:
10. Trading Application: Step-by-Step Execution Workflow
To trade liquidity successfully, you must move from the “Big Picture” down to the “Execution Detail.” Instead of guessing, we use a systematic approach to ensure we are following the Smart Money, not fighting it.
10.1. The Multi-Timeframe Workflow
Successful liquidity trading is never about staring at a single chart. It is a “top-down” process of zooming in from the higher timeframe (HTF) to find the direction, then using the lower timeframe (LTF) to find the precise entry trigger.
10.2. The Core Setup: Sweep → Break of Structure → Entry
No matter the market condition, the most classic Smart Money Concept (SMC) setup always follows these three mechanical steps:
- Wait for the sweep: Price moves beyond an old high/low to trigger the resting stop-losses (the fuel).
- Wait for the Market Structure Shift (MSS): Price aggressively reverses and breaks the last minor swing point. This confirms the sweep was a “fakeout” (manipulation).
- Find your entry: The aggressive reversal will almost always leave behind a Fair Value Gap (FVG) or an Order Block. Your entry is a limit order inside this new zone.
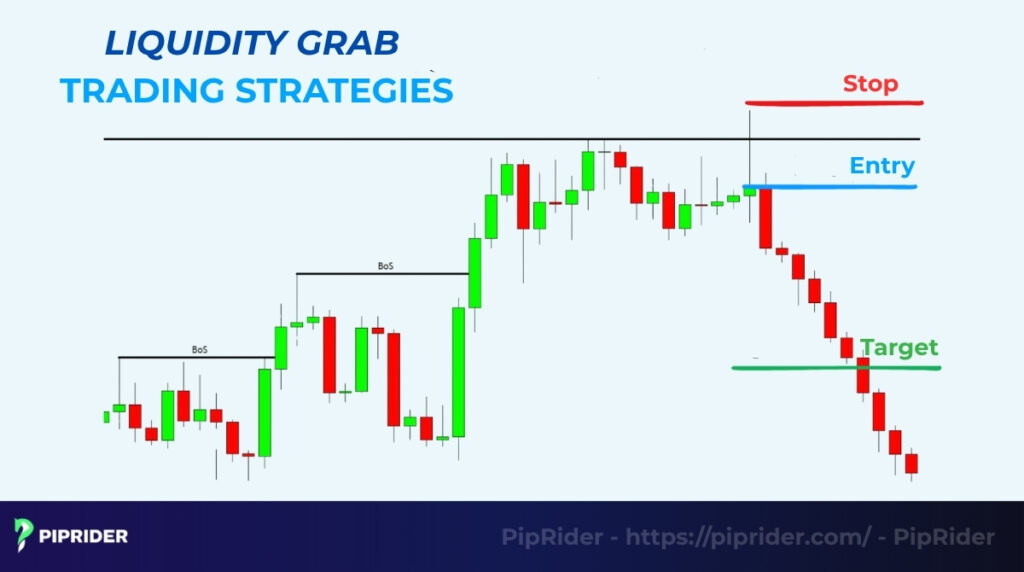
10.3. Scenario A: The Reversal Trade (External Sweep)
This setup occurs when the market “traps” early breakout traders at a major Higher Timeframe level before aggressively turning the other way.
The Numerical Trade Plan (EUR/USD Example):
- HTF Analysis (H4): Price is approaching the Previous Day High (PDH) at 1.1000. We expect a sweep-and-reverse.
- The Sweep (M15): Price spikes to 1.1005, clearing the buy-stops, but fails to sustain the move and closes below 1.1000.
- The Entry (M1): Price breaks below 1.0995 with a strong Bearish Displacement, leaving an FVG at 1.0997.
- Execution: Entry at 1.0997 | SL at 1.1007 | TP at 1.0950 (next major SSL) | RR: ~1:4.7.
Real Chart Example: The Sweep of Equal Highs
Here is what this reversal setup looks like on a real ICT-style chart:
- The Setup: The chart shows clear Equal Highs (EQH), where price has failed to break a resistance level twice. Retail traders place their sell orders and stop-losses just above it.
- The Sweep: Price makes a sudden, aggressive move up, breaking just above the Equal Highs. This move is a liquidity sweep that “grabs” all the BSL.
- The Reversal: Immediately after sweeping the highs, the price aggressively reverses, confirmed by a Market Structure Shift (MSS).
10.4. Scenario B: The Continuation Trade (Internal Sweep)
In a strong trend, you don’t wait for a major reversal. Instead, you look for “minor shakeouts” (sweeping internal liquidity) to join the existing momentum at a better price.
The Numerical Trade Plan (Gold – XAU/USD Example):
- HTF Bias (H4): Strongly Bullish. The target is the $2150 high.
- The Pullback (M15): Price dips to sweep a minor internal low (IRL) at $2130, washing out early buyers.
- The Entry (M5): After the sweep, price leaves a long wick, closes back inside, and forms a Bullish FVG.
- Execution: Entry at $2132 (FVG retest) | SL at $2128 (below manipulation wick) | TP at $2148 | RR: 1:4.
Real Chart Example: Sweeping Retail Stops for Continuation
Here is how institutions use liquidity to identify trend continuations:
- The Setup: The market is in a clear, strong uptrend. It creates a small, minor pullback, forming a Swing Low. Retail traders place their stop-losses just below this swing low.
- The Sweep: Price dips down just enough to sweep the SSL below that minor low, stopping out the “weak hands.”
- The Continuation: Once those orders are taken, the price immediately resumes its original uptrend, now fueled for the next leg up.
10.5. Professional SL/TP Management
A trade is only as good as its exit strategy. In the SMC framework, we don’t use arbitrary pip targets; we base our exits on the very thing that drives the market: the pools of orders.
- Stop-Loss Logic: Never place your SL exactly on a liquidity level. Place it behind the sweep wick (the “Manipulation Point”). If price returns there, your liquidity thesis is invalidated.
- Take-Profit Logic: Your TP should always be the next opposing liquidity pool. If you buy at an SSL sweep, your primary target is the next major BSL. This “Liquidity-to-Liquidity” approach ensures you trade the path of least resistance.
11. Common Mistakes When Trading Liquidity
Even with the right framework, traders often fall into technical and psychological traps when applying Smart Money Concepts. Here are the top mistakes to avoid:
Mistake 1: Treating Liquidity like Support & Resistance
Traditional S/R traders expect price to bounce off a level. SMC traders expect price to push through the level to trigger stops. If you place a blind limit order exactly at a liquidity pool, you are volunteering to become the liquidity. As trading psychologist Mark Douglas emphasizes in his foundational work Trading in the Zone, retail traders often fall victim to their own predictable patterns. Placing stop-losses exactly at obvious support or resistance levels creates the exact liquidity pools that institutional algorithms are programmed to hunt.
Mistake 2: The “Chart Graveyard” (Over-Marking Levels)
Marking every single 1-minute swing high, minor pullback, and micro-FVG will turn your chart into a cluttered mess. When you have too many lines, you will suffer from “analysis paralysis” and find a fake reason to enter anywhere.
- The Fix: Only mark major liquidity zones (Tier 1 & Tier 2) that align with your Higher Timeframe (HTF) bias.
Mistake 3: Entering Blindly on a “Touch”
Just because price reaches a Previous Day High (PDH) or an Equal High (EQH) doesn’t mean it will automatically reverse. A level being tagged is not a signal; it is an alert to start paying attention. You must wait for the “sweep” to finish and confirm it with a lower timeframe Market Structure Shift (MSS).
12. What Tools & Indicators Help Spot Liquidity?
While you can identify liquidity zones manually, many traders use specialized indicators to speed up their workflow and visualize institutional activity. However, there is a golden rule to remember: Tools can highlight probable zones, but they do not replace context, market structure, or session timing. Think of these as “visual assistants” rather than signal generators:
- TradingView Liquidity Heatmaps: These advanced (often paid) indicators visualize where large clusters of stop-loss and limit orders are sitting. They are excellent for seeing where the “masses” are positioned, often aligning perfectly with swing highs and lows.
- Bookmap (Order Flow Visualization): This platform provides a live view of the Depth of Market (DOM). It allows you to see the actual “pulling” and “stacking” of large limit orders in real-time, which is invaluable during high volatility.
- ICT/SMC Community Indicators: The TradingView library has many free scripts (like those from the ICT community) that automatically mark key levels like Previous Day High/Low (PDH/PDL) or Equal Highs/Lows (EQH/EQL).
- Smart Money Concepts (e.g., LuxAlgo): All-in-one indicators can draw SMC zones automatically, including liquidity sweeps, order blocks, and Fair Value Gaps (FVG). These are great for keeping your chart organized, but they should always be cross-checked with your own analysis.
Critical Warning: An indicator may show a “Liquidity Sweep” or an “Order Block,” but if that signal occurs without context, it is likely a trap. As you will see in the next section, even the best tools fail when the market conditions aren’t right. Never click “Buy” or “Sell” based solely on an indicator’s label.
13. When Liquidity Concepts Fail: The Limitations of the Strategy
No trading framework is a “holy grail,” and Smart Money Concepts are no exception. Liquidity is a probabilistic model, not a guaranteed prediction. To avoid falling into “liquidity traps,” you must recognize the specific market conditions where these concepts often break down:
- The “Dead Zone” (Session Timing): Liquidity sweeps require Institutional Volume. A “sweep” during the late Asian session or the mid-day New York lull is often just retail noise. Without big banks active, price lacks the momentum to “reclaim” a level, leading to a slow drift rather than a sharp, tradable reaction.
- High-Impact News Chaos: During major announcements (CPI, FOMC, NFP), technical levels often become irrelevant. Volatility is so extreme that price may sweep multiple liquidity pools in seconds. In these moments, liquidity isn’t a target, it’s a victim of market chaos.
- The “Runaway Trend” (Extreme Momentum): When the Higher Timeframe (HTF) trend is exceptionally powerful, the market may refuse to look back. It won’t return to fill that “perfect” FVG or sweep that “obvious” internal low. Waiting for a sweep in a runaway trend often leads to missed opportunities and “Analysis Paralysis.”
- Front-Running & Shallow Sweeps: The market doesn’t always play by the “pip”. Often, price will reverse just a few pips before hitting your marked liquidity pool (EQH/EQL). This happens when institutions enter early, leaving impatient traders waiting for a tap that never comes.
- Range Compression & Random Chop: In a tight, sideways consolidation, the market often sweeps both sides repeatedly without a clear exit. This is “death by a thousand cuts.” Liquidity mapping in a choppy range, without a clear HTF bias, is a recipe for overtrading and frustration.
Actionable Takeaway: If the market feels “messy” or you are trading outside of the London/NY Killzones, step back. A failed liquidity setup is usually a sign that the higher timeframe context has shifted or the necessary institutional volume is missing.
14. Frequently asked questions about Identifying Liquidity in Trading
15. Conclusion
Liquidity is one of the most important factors in understanding the market. In the SMC framework, price is viewed not as random, but as naturally drawn to liquidity pools before making a strong, decisive move.
When you learn how to identify liquidity in trading and combine that knowledge with market structure and confluence, you stop being the “fuel” and start trading alongside the Smart Money.
As trading psychologist Mark Douglas emphasizes in his foundational work Trading in the Zone, retail traders often fall victim to their own predictable patterns. Placing stop-losses exactly at obvious support or resistance levels creates the exact liquidity pools that institutional algorithms are programmed to hunt.
What’s the most common liquidity zone you see on your charts? Share your experience with Piprider or ask a question in the comments below!