

Ever watched a market go quiet and felt the tension building, knowing a big move was imminent? That quiet period is often visualized on the chart as inside bars. In trading, this pattern is a powerful signal of indecision and a potential precursor to an explosive break. This guide will teach you how to identify this pattern, understand its variations, and use it to build an effective trading technique.
Key Takeaways
- What this pattern is and why it’s a crucial signal in trading.
- Common variations, including the bullish, bearish, and the false break (Fakey).
- How to correctly identify a valid setup, including the “mother bar” and key structural rules.
- Effective entry and exit strategies for both day trading and swing trading.
- Common mistakes to avoid and practical tips for improving your trading with this pattern.
1. What Is an Inside Bar in Trading?
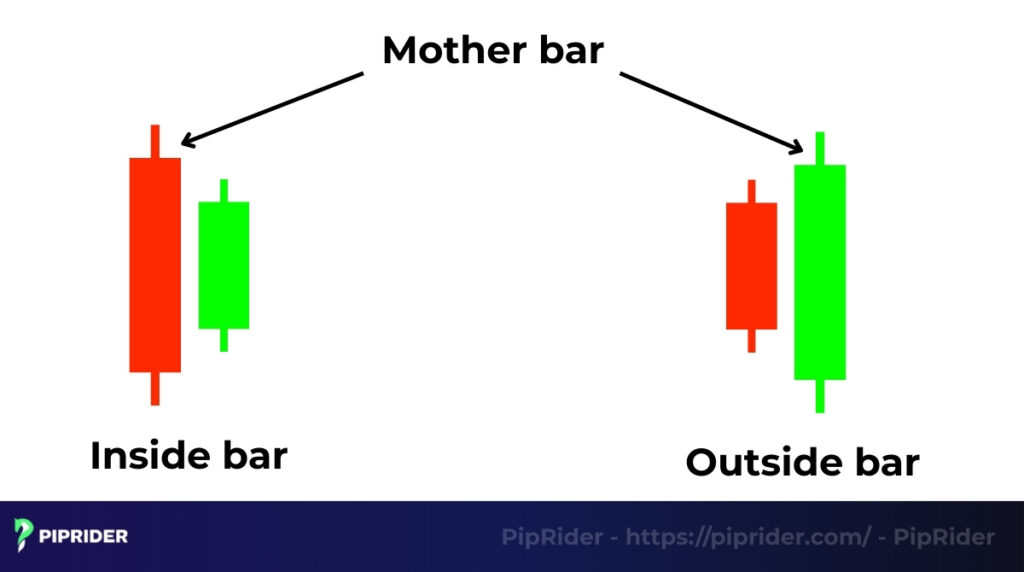
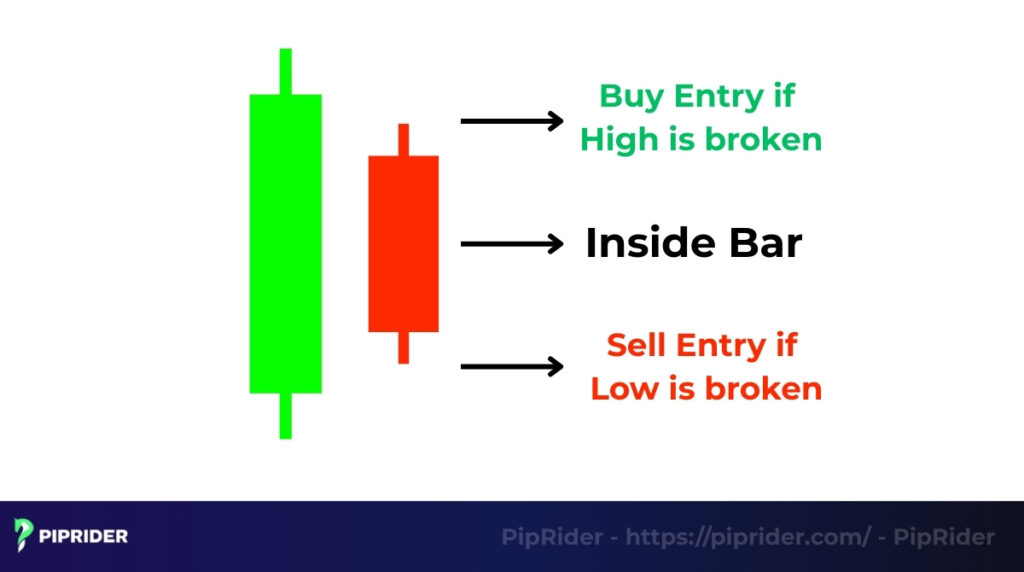
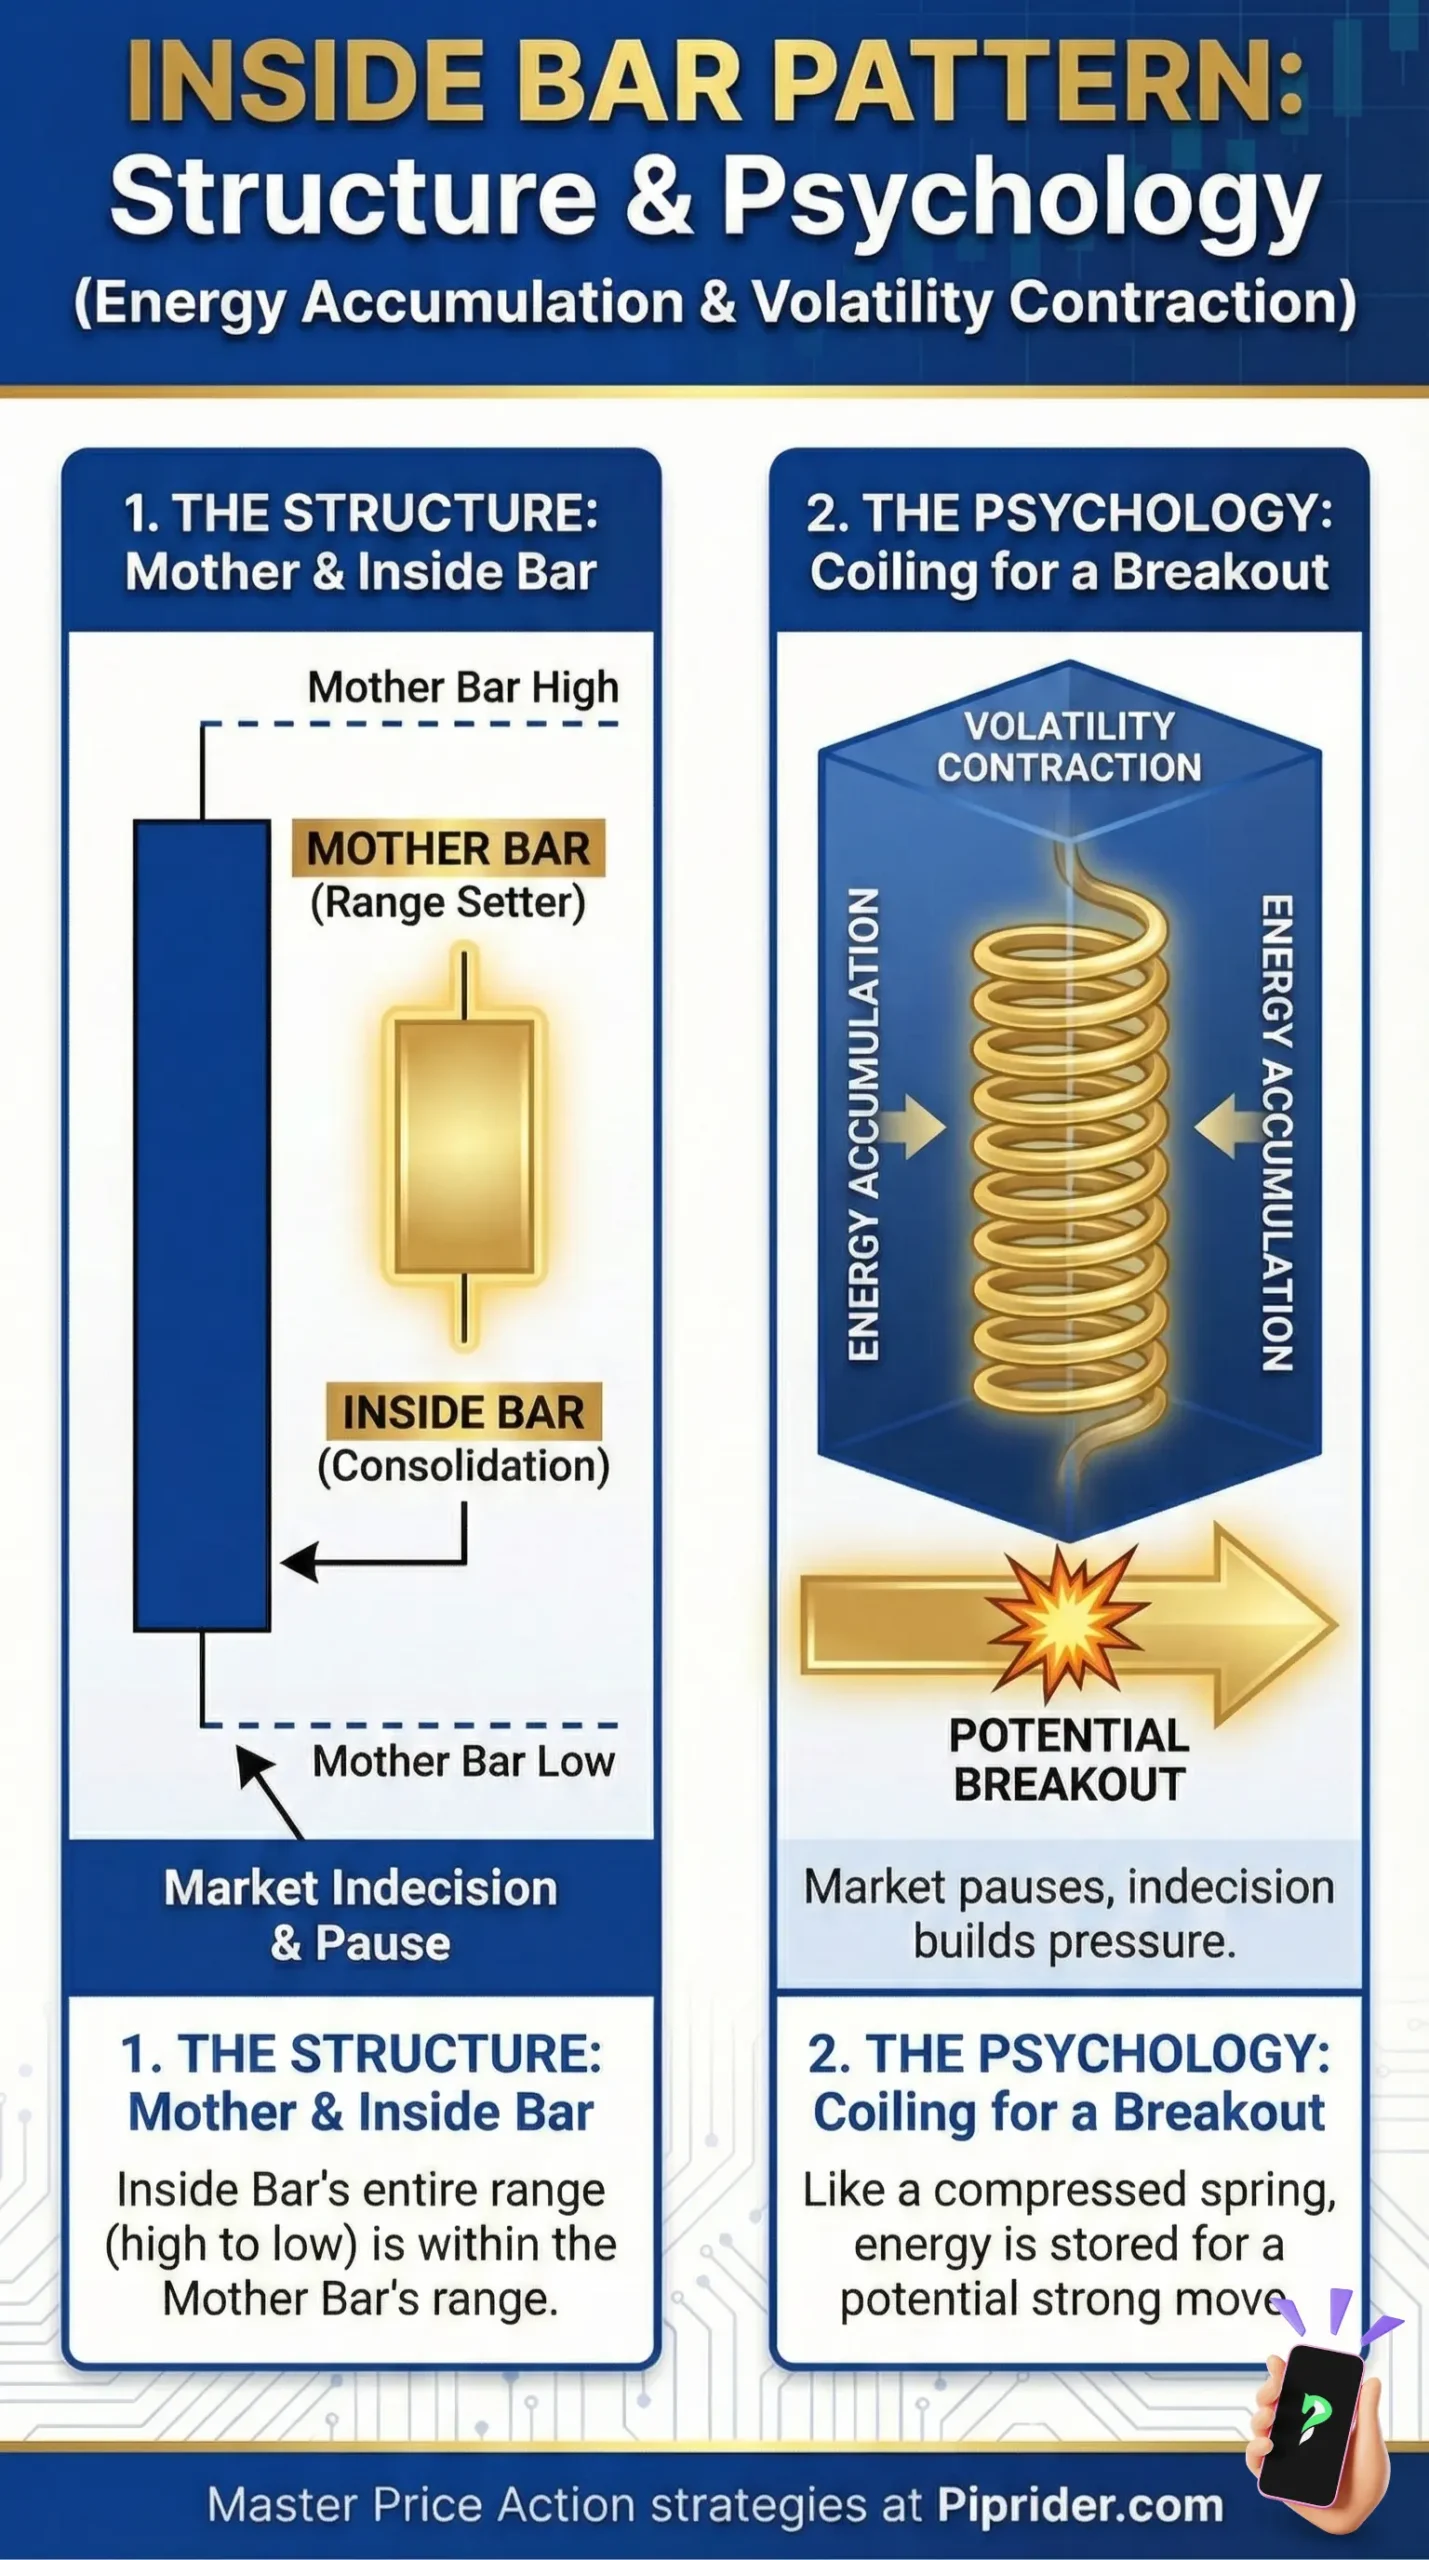
An inside bar is a two-candle price action pattern where a smaller candle, the “Inside Bar”, forms entirely within the high-to-low range of the preceding, larger candle, known as the “Mother Bar.”
This inside bar candlestick pattern signals a period of consolidation and contracting volatility. It visually represents a pause or indecision in the market, often indicating that energy is building for a potential breakout.
The meaning of this pattern becomes clearer when compared to its opposite:
- Inside Bar: Represents a contraction in volatility. The market is in a tight range and signals a potential break is coming.
- Outside Bar (or Engulfing Bar): Represents an expansion in volatility. The second candle completely “engulfs” the previous one, signaling a strong, decisive move has already begun.
1.1. Market Psychology: The “Coiling Spring” Effect
The psychology behind an inside bar is a story of temporary equilibrium. While many see it as just “indecision,” professional traders view it as a high-pressure transition from high volatility to low volatility.
- The Mother Bar (Momentum): Represents a period of strong directional conviction. Ideally, this should be a wide-range, decisive candle, such as a marubozu candlestick pattern, showing that one side (bulls or bears) was in total control.
- The Inside Bar (The Pause): This smaller, contained candle shows that the initial momentum has hit a “brick wall.” It is a quiet agreement between buyers and sellers to pause within a known range.
Volatility Cycle: This pause signifies a temporary equilibrium where neither buyers nor sellers are strong enough to push the price beyond the previous period’s extremes. It represents a volatility contraction, indicating that energy is coiling for the next significant directional expansion.
Inside Bar vs. Long-Legged Doji
It’s important to distinguish this from the wild indecision of a long-legged doji.
- The Doji represents a violent, high-volatility struggle that ends in a draw (messy).
- The Inside Bar represents a quiet, low-volatility consolidation (clean).
This structural “quietness” is what makes the inside bar a much more reliable precursor to a trend continuation than a chaotic Doji.
1.2. Why Inside Bars Are Popular Among Price Action Traders
These patterns are a favorite among traders for several key reasons:
- They provide a clear and defined risk level. The high and low of the Mother Bar create an obvious and logical area to place a stop-loss.
- They offer a favorable risk-to-reward ratio. Because the pattern represents a period of low volatility, it often allows for a tight stop-loss relative to the potential profit from the subsequent break.
- They are versatile. A pattern can signal both a trend continuation (when formed during a pullback) and a potential trend reversal (when formed at a key support or resistance level).
- They provide an objective entry trigger. The break above or below the Mother Bar is an unambiguous signal to enter a trade, removing much of the guesswork.
2. Key Components of the Setup
A valid setup is more than just one small candle inside a larger one. It requires a specific structure and context to be considered a reliable signal. Let’s break down the key components.
2.1. Bullish vs. Bearish
An inside bar itself is a neutral pattern representing indecision. It depends entirely on the direction of the subsequent breakout from the Mother Bar’s range.
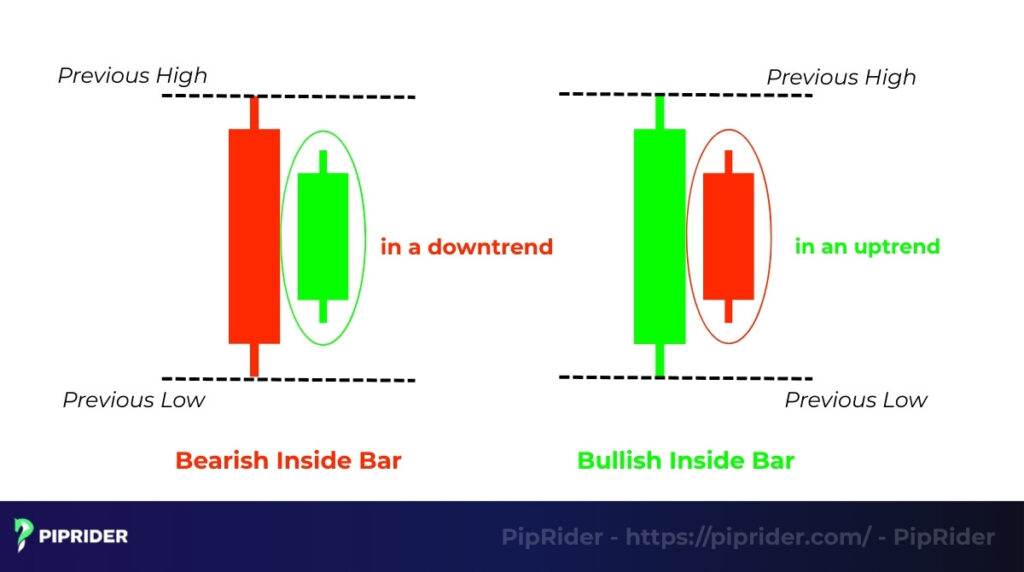
- A Bullish inside bar setup is confirmed when the price breaks and closes above the high of the preceding candle. This signals that the period of indecision has resolved to the upside, and buyers have taken control.
- A Bearish setup is confirmed when the price breaks and closes below the low of the preceding candle. This signals that the indecision has resolved to the downside, and sellers are in control.
2.2. Valid Conditions (Range, Volume, Context)
Not all patterns are created equal. To identify a high-probability inside bar, it must meet these three structural and environmental conditions:
- Tight Range: A high-quality inside bar should be significantly smaller than its preceding Mother Bar. A “tight” pattern represents a deeper coiling of energy, often leading to a more explosive breakout.
- Decreasing Volume (The Forex Caveat): Ideally, volume should decrease during the inside bar’s formation, supporting the “market pause” narrative. Note for Spot FX Traders: Since Forex is decentralized, treat the volume on your chart as a tick volume proxy. Decreasing tick volume is a helpful confirmation, but it is a secondary signal, not a hard requirement.
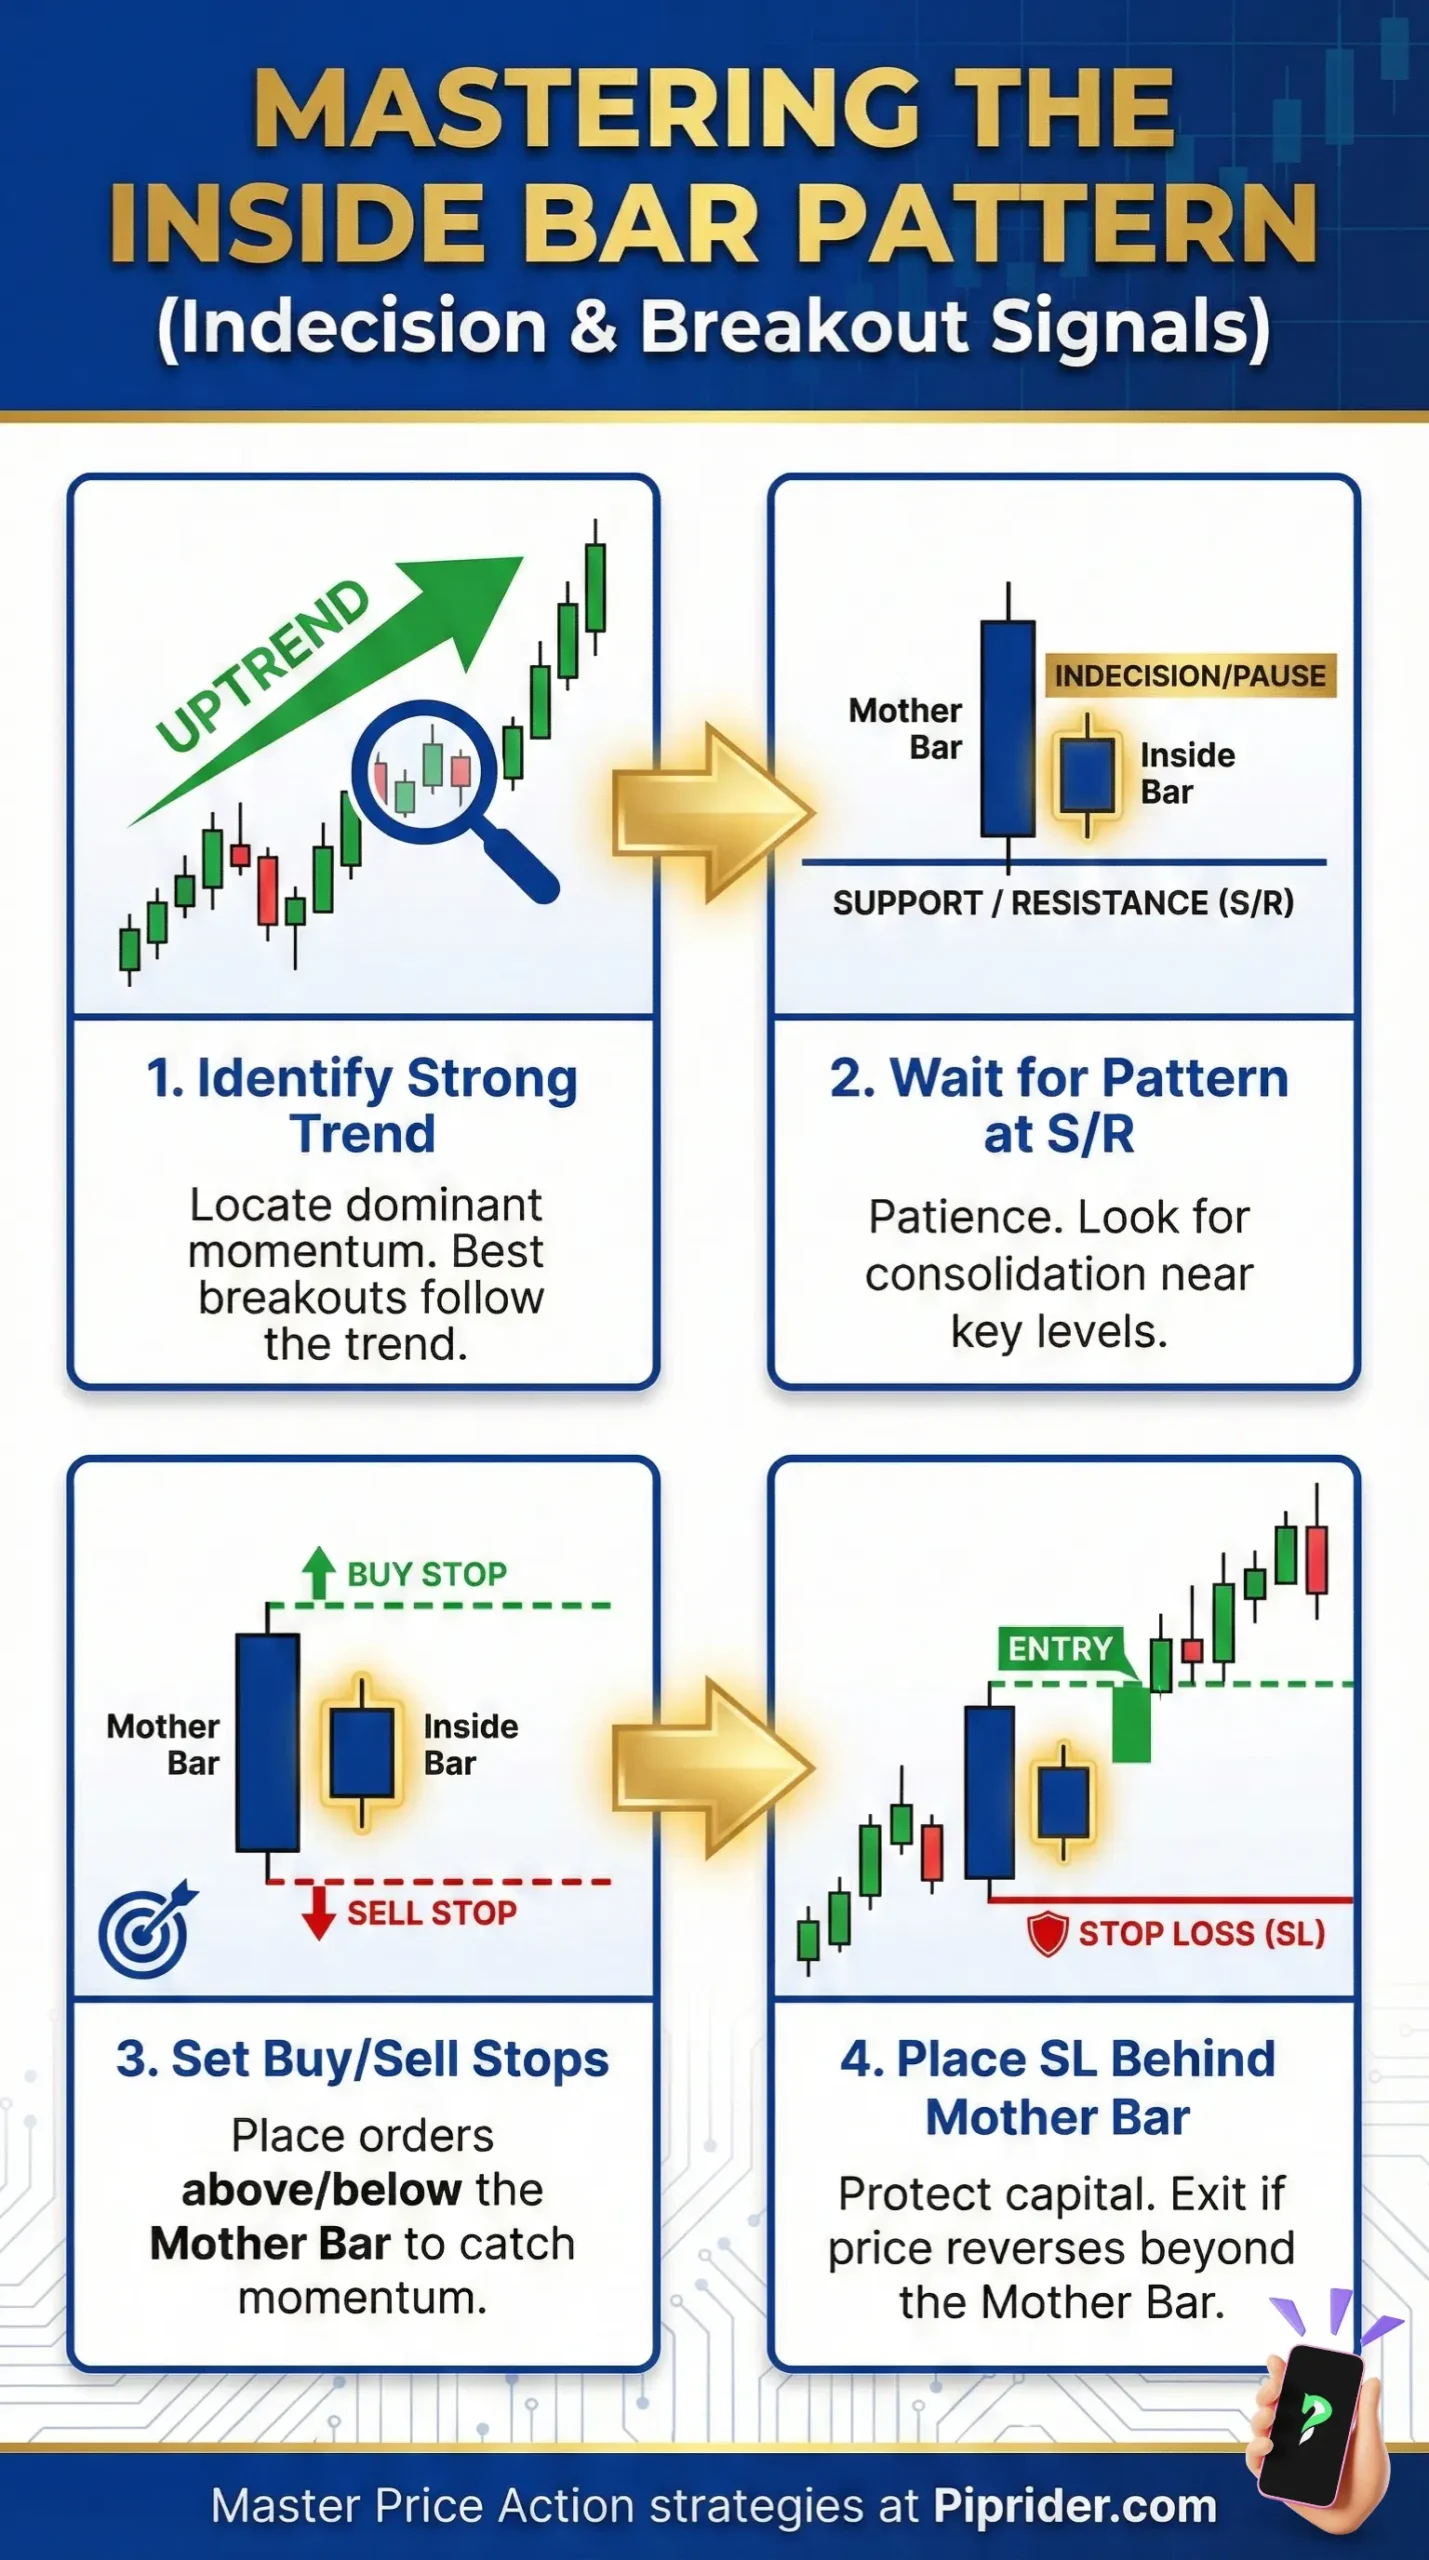
- Key Context (Location): This is the most critical factor. An inside bar is most powerful when it forms at a major chart level, such as a pullback to a moving average in a trend, or at a significant weekly support/resistance zone.
2.3. Best Time Frames for Spotting Inside Bars
This pattern is most reliable on higher timeframes. From our experience, the daily and 4-hour charts provide the most trustworthy signals because they filter out insignificant market “noise.”
A break from a daily inside bar is more significant and likely to lead to a sustained move, especially when it aligns with major reversal formations such as a triple top. We advise caution on charts below 1-hour, as they are prone to false moves.
3. Common Inside Bar Variations
Once you can identify a basic inside bar, you will notice that the market often creates more complex structures. These advanced variations provide deeper insight into market psychology and the intensity of the impending breakout.
3.1. Double Inside Bars (The Extreme Coil)
A Double Inside Bar occurs when two consecutive inside bars form within the range of the same original Mother Bar.
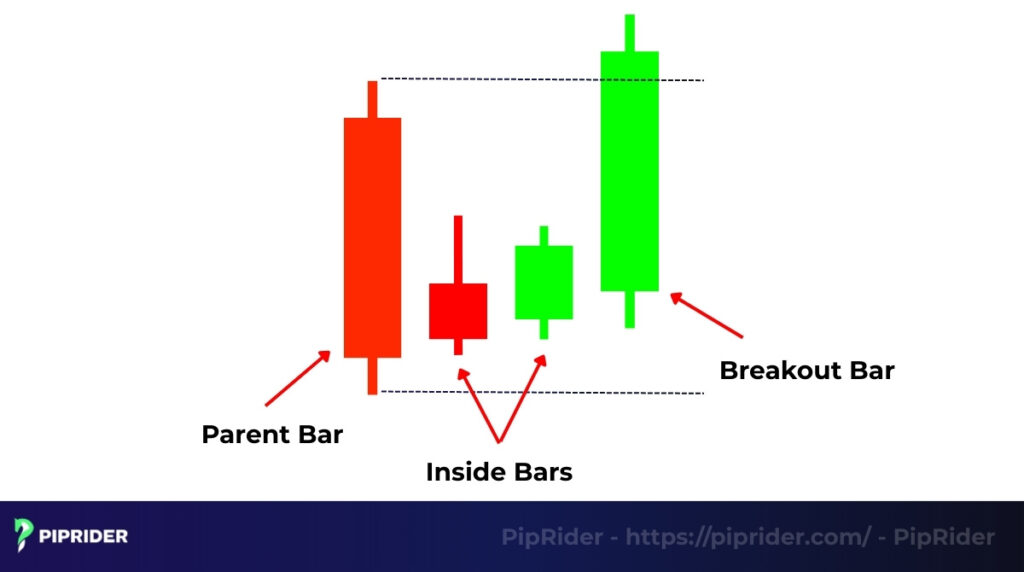
- The Mechanism: This signals an extreme contraction in volatility. Think of it as a “spring” being compressed twice; the market is in a state of high suspense where neither buyers nor sellers are willing to commit.
- The Psychology: The market is “storing” energy. The longer the price stays within the Mother Bar’s range, the more stop-entry orders accumulate on both sides.
- The Signal: Breakouts from a double inside bar setup are often significantly more explosive than standard ones. Professional traders look for these on Daily charts for high-momentum swing trades.
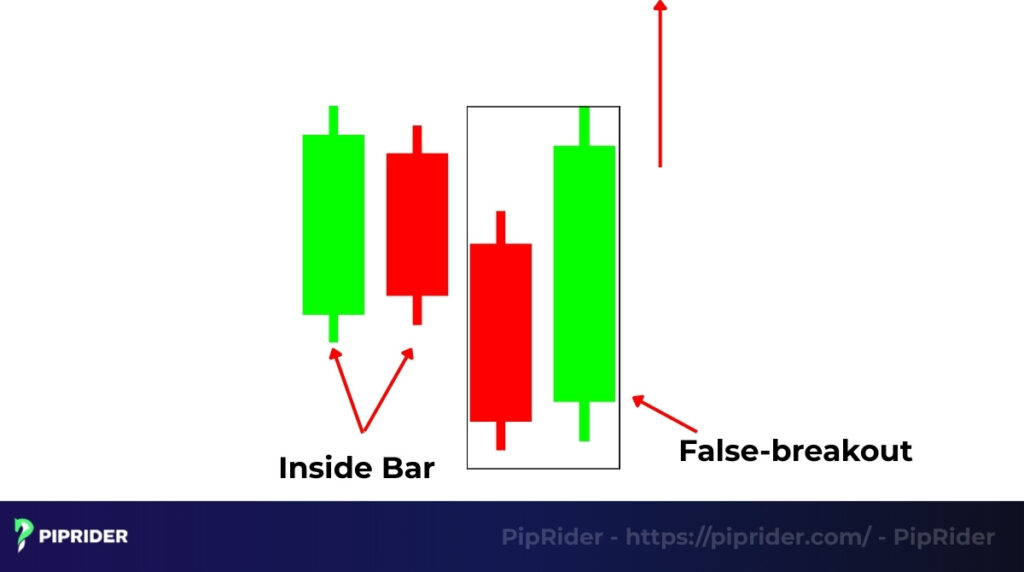
3.2. The Fakeout (The “Fakey” or Hikkake Pattern)
The “Fakey” is the ultimate liquidity trap in price action trading. It occurs when the price initially breaks out of an inside bar, only to quickly reverse and trap “weak hand” traders on the wrong side of the move.
The Fakey Logic (Hikkake Sequence):
1. The False Break: Price breaks the Mother Bar’s extreme, triggering breakout orders.
2. The Trap: Smart Money absorbs the orders, and price reverses sharply.
3. The Surge: Price breaks the opposite side of the Mother Bar, triggering a massive move.
Key Identification Factors
- The Hikkake Origin: In professional technical analysis, this setup is formally documented as the Hikkake pattern, a term coined by CMT Dan Chesler to describe the specific logic of a failed inside bar breakout (Chesler, 2004).
- The Pin Bar Confirmation: The most reliable Fakey setups feature a pin bar as the false breakout candle. The long wick visually confirms that liquidity has been grabbed and the level has been rejected.
Bullish vs. Bearish Variants
- Bullish Fakey: A false break to the downside that traps sellers, followed by a surge to the upside.
- Bearish Fakey: A false break to the upside that traps buyers, followed by a sharp drop to the downside.
4. How to Trade Inside Bars: A Step-by-Step Guide
The inside bar trading strategy is not about predicting the direction but about reacting to the subsequent breakout. Proper risk management is the core of any strategy, and it begins with using the Mother Bar’s range as the decision point. This guide breaks down the process into a clear, systematic approach.
4.1. Entry Strategy: Conservative vs. Aggressive
Choosing your entry method is a balance between confirmation and profit potential. Always align your choice with your experience level:
Conservative Entry (The Breakout Close):
- How it works: You wait for a decisive candlestick close outside the Mother Bar’s high or low.
- The Trigger: Buy only when the candle closes above the high (for longs) or below the low (for shorts).
- Pros & Cons: This confirms momentum and filters out many “Fakey” patterns, but may result in a slightly worse entry price if the breakout candle is large.
Aggressive Entry (The Anticipated Move):
- How it works: Entering a trade within the Mother Bar’s range before a breakout occurs.
- The “Safety” Rules: Only use this if the setup has a clear confluence (e.g., a pullback to the 50 EMA) and matches the higher-timeframe (HTF) trend.
- The Invalidation Rule: If the price closes on the opposite side of your bias while still inside the Mother Bar, the setup is dead. Exit immediately to preserve capital.
4.2. Precision Stop-Loss Placement
Avoid the “rookie mistake” of placing your stop-loss exactly at the Mother Bar’s extremes. Professional traders use a quantitative buffer to survive market noise. To ensure the stop-loss is proportional to current market volatility, we utilize the Average True Range (ATR), a concept developed by J. Welles Wilder Jr. to quantify price movement (Wilder, 1978).
The Buffer Formula:
Stop-Loss Buffer = Max(Spread × 2, 0.1 × ATR)
- For Long Trades: Stop-Loss = Mother Bar Low – Buffer
- For Short Trades: Stop-Loss = Mother Bar High + Buffer
Pro Tip: Understanding how to calculate your stop-loss with a technical buffer is the only way to avoid “stop-hunting” spikes and premature exits caused by the bid/ask spread gap.
4.3. Take-Profit Targets & Risk/Reward Ratio
The inside bar is a favorite among price action traders because it offers a superior Risk/Reward (R:R) ratio. Since the risk is tightly confined to the Mother Bar’s range, the potential for a large trend expansion is significant.
- The 1:2 Minimum Rule: As a baseline, always aim for a minimum reward that is twice your risk (1:2 R:R). This ensures that even with a 50% win rate, your account remains mathematically profitable.
- Structural Targets: Rather than picking a random number of pips, set your “Fixed Target” at the next major Support or Resistance level, or at a recent swing high/low where price is likely to stall.
- Trailing for Maximum Gains: For strong trending markets, close 50% of your position at the $1:2$ target and leave the rest as a “Running Position.” Trail your stop-loss behind the most recent swing points to capture “explosive” moves.
4.4. High-Probability Scenarios: Where to Trade?
An inside bar is only as powerful as its location on the chart. Professional traders focus on two primary scenarios:
- Scenario 1: Trend Continuation (The Bread & Butter): This is the most reliable setup. During a strong trend, the inside bar acts as a “flag” or a brief pause. Look for these during shallow pullbacks to dynamic levels like the 21 EMA or 50 EMA.
- Scenario 2: The Reversal (High Reward, High Risk): Look for inside bars that form after an extended price move exactly at a major, long-term support or resistance zone. A breakout against the previous trend from these levels often signals a significant market top or bottom.
4.5. Real-World Trade Example: EUR/USD Continuation
Let’s apply our “Playbook Rules” to a classic 4-hour setup on the EUR/USD pair:
| Parameter | Execution Detail | Logic |
|---|---|---|
| Entry Strategy | Sell Stop / Market Sell | Decisive close below the Mother Bar’s low. |
| Stop Loss (SL) | Above Mother Bar High | Calculated with a 2x Spread buffer. |
| Take Profit (TP) | Previous Swing Low | Targets a 1:2 R:R ratio at structural support. |
5. Common Mistakes to Avoid
While the inside bar is a powerful pattern, traders often make a few recurring mistakes that can lead to losses. Being aware of these common pitfalls is essential for consistent trading.
A critical error is ignoring the overall market context. An inside bar that forms as a continuation signal in a strong, established trend is a much higher-probability setup than one that forms in the middle of a choppy, directionless market. Similarly, in low-liquidity markets, a pattern can simply mean a lack of market interest, not a buildup of energy, often leading to failed moves.
Other common mistakes include:
- Confusing with general consolidation: It is a specific, two-candle pattern signaling a brief pause, not a prolonged sideways range.
- Falling for the false breakout: The most common trap is the Fakey. Always wait for a strong candle close as confirmation to reduce this risk.
- Overtrading: Because they can appear frequently, it’s easy to overtrade them. Only focus on inside bars that form at key, reliable locations.
6. Example Scanners and Tools for Inside Bar Strategy
Manually searching for inside bar patterns across hundreds of markets can be time-consuming. Fortunately, traders can use scanners to automate the process and other indicators to confirm the setups, creating a more efficient strategy.
6.1. Scanners and Automation Tools
Stop wasting hours searching for patterns manually. To trade this strategy like a professional, you need to use the right tools for your specific platform:
- TradingView and Thinkorswim: These platforms feature powerful built-in scanners (Screeners). You can easily set filters to scan thousands of assets for “Inside Bar” patterns across any timeframe in seconds.
- MetaTrader 4 (MT4): This platform lacks a native screening function. Instead, MT4 requires custom tools such as specialized indicators, scripts, or Expert Advisors (EAs) to automate the search across multiple currency pairs.
- The “Alert” Strategy: Regardless of your platform, we recommend setting price alerts on the Mother Bar’s high and low. This allows the market to “come to you,” ensuring you only engage when a valid breakout trigger occurs.
6.2. Combining with Moving Averages or RSI
As a confirmation tool, indicators are invaluable. Combining the inside bar with other signals creates a much higher-probability setup.
- Moving Averages: An inside bar that forms during a pullback to a key moving average (like the 50 EMA) in a strong trend is a classic and highly reliable continuation signal.
- RSI (Relative Strength Index): If a bullish inside bar forms at a major support level while the RSI is simultaneously in “oversold” territory (below 30) or showing bullish divergence, it adds significant weight to the potential for a reversal.
7. Inside Bar vs. Other Price Action Patterns: Key Differences
Understanding how an Inside Bar compares to other candlestick formations is crucial for identifying whether the market is merely pausing or preparing for a total trend reversal. Here is how it stacks up against the most popular price action signals.
7.1. Inside Bar vs. Harami: Spotting the Subtle Differences
At first glance, an Inside Bar and a Harami pattern look identical. However, they serve different analytical purposes. While the modern ‘inside bar’ is often traded for its breakout potential, its roots lie in the traditional Japanese Harami pattern, first popularized in the West by Steve Nison (Nison, 1991). Understanding these nuances is key to avoiding “misread” signals:
- Inside Bar (The Range Focus): Focuses on the High and Low (entire range). It represents a “coiling” of volatility and is primarily a continuation signal.
- Harami (The Body Focus): Based on the Real Body (Open/Close). The second candle’s body must be inside the first. It is almost exclusively a reversal signal.
| Feature | Inside Bar | Harami |
|---|---|---|
| Primary Focus | High/Low Range (Volatility) | Real Body (Momentum) |
| Typical Signal | Trend Continuation | Trend Reversal |
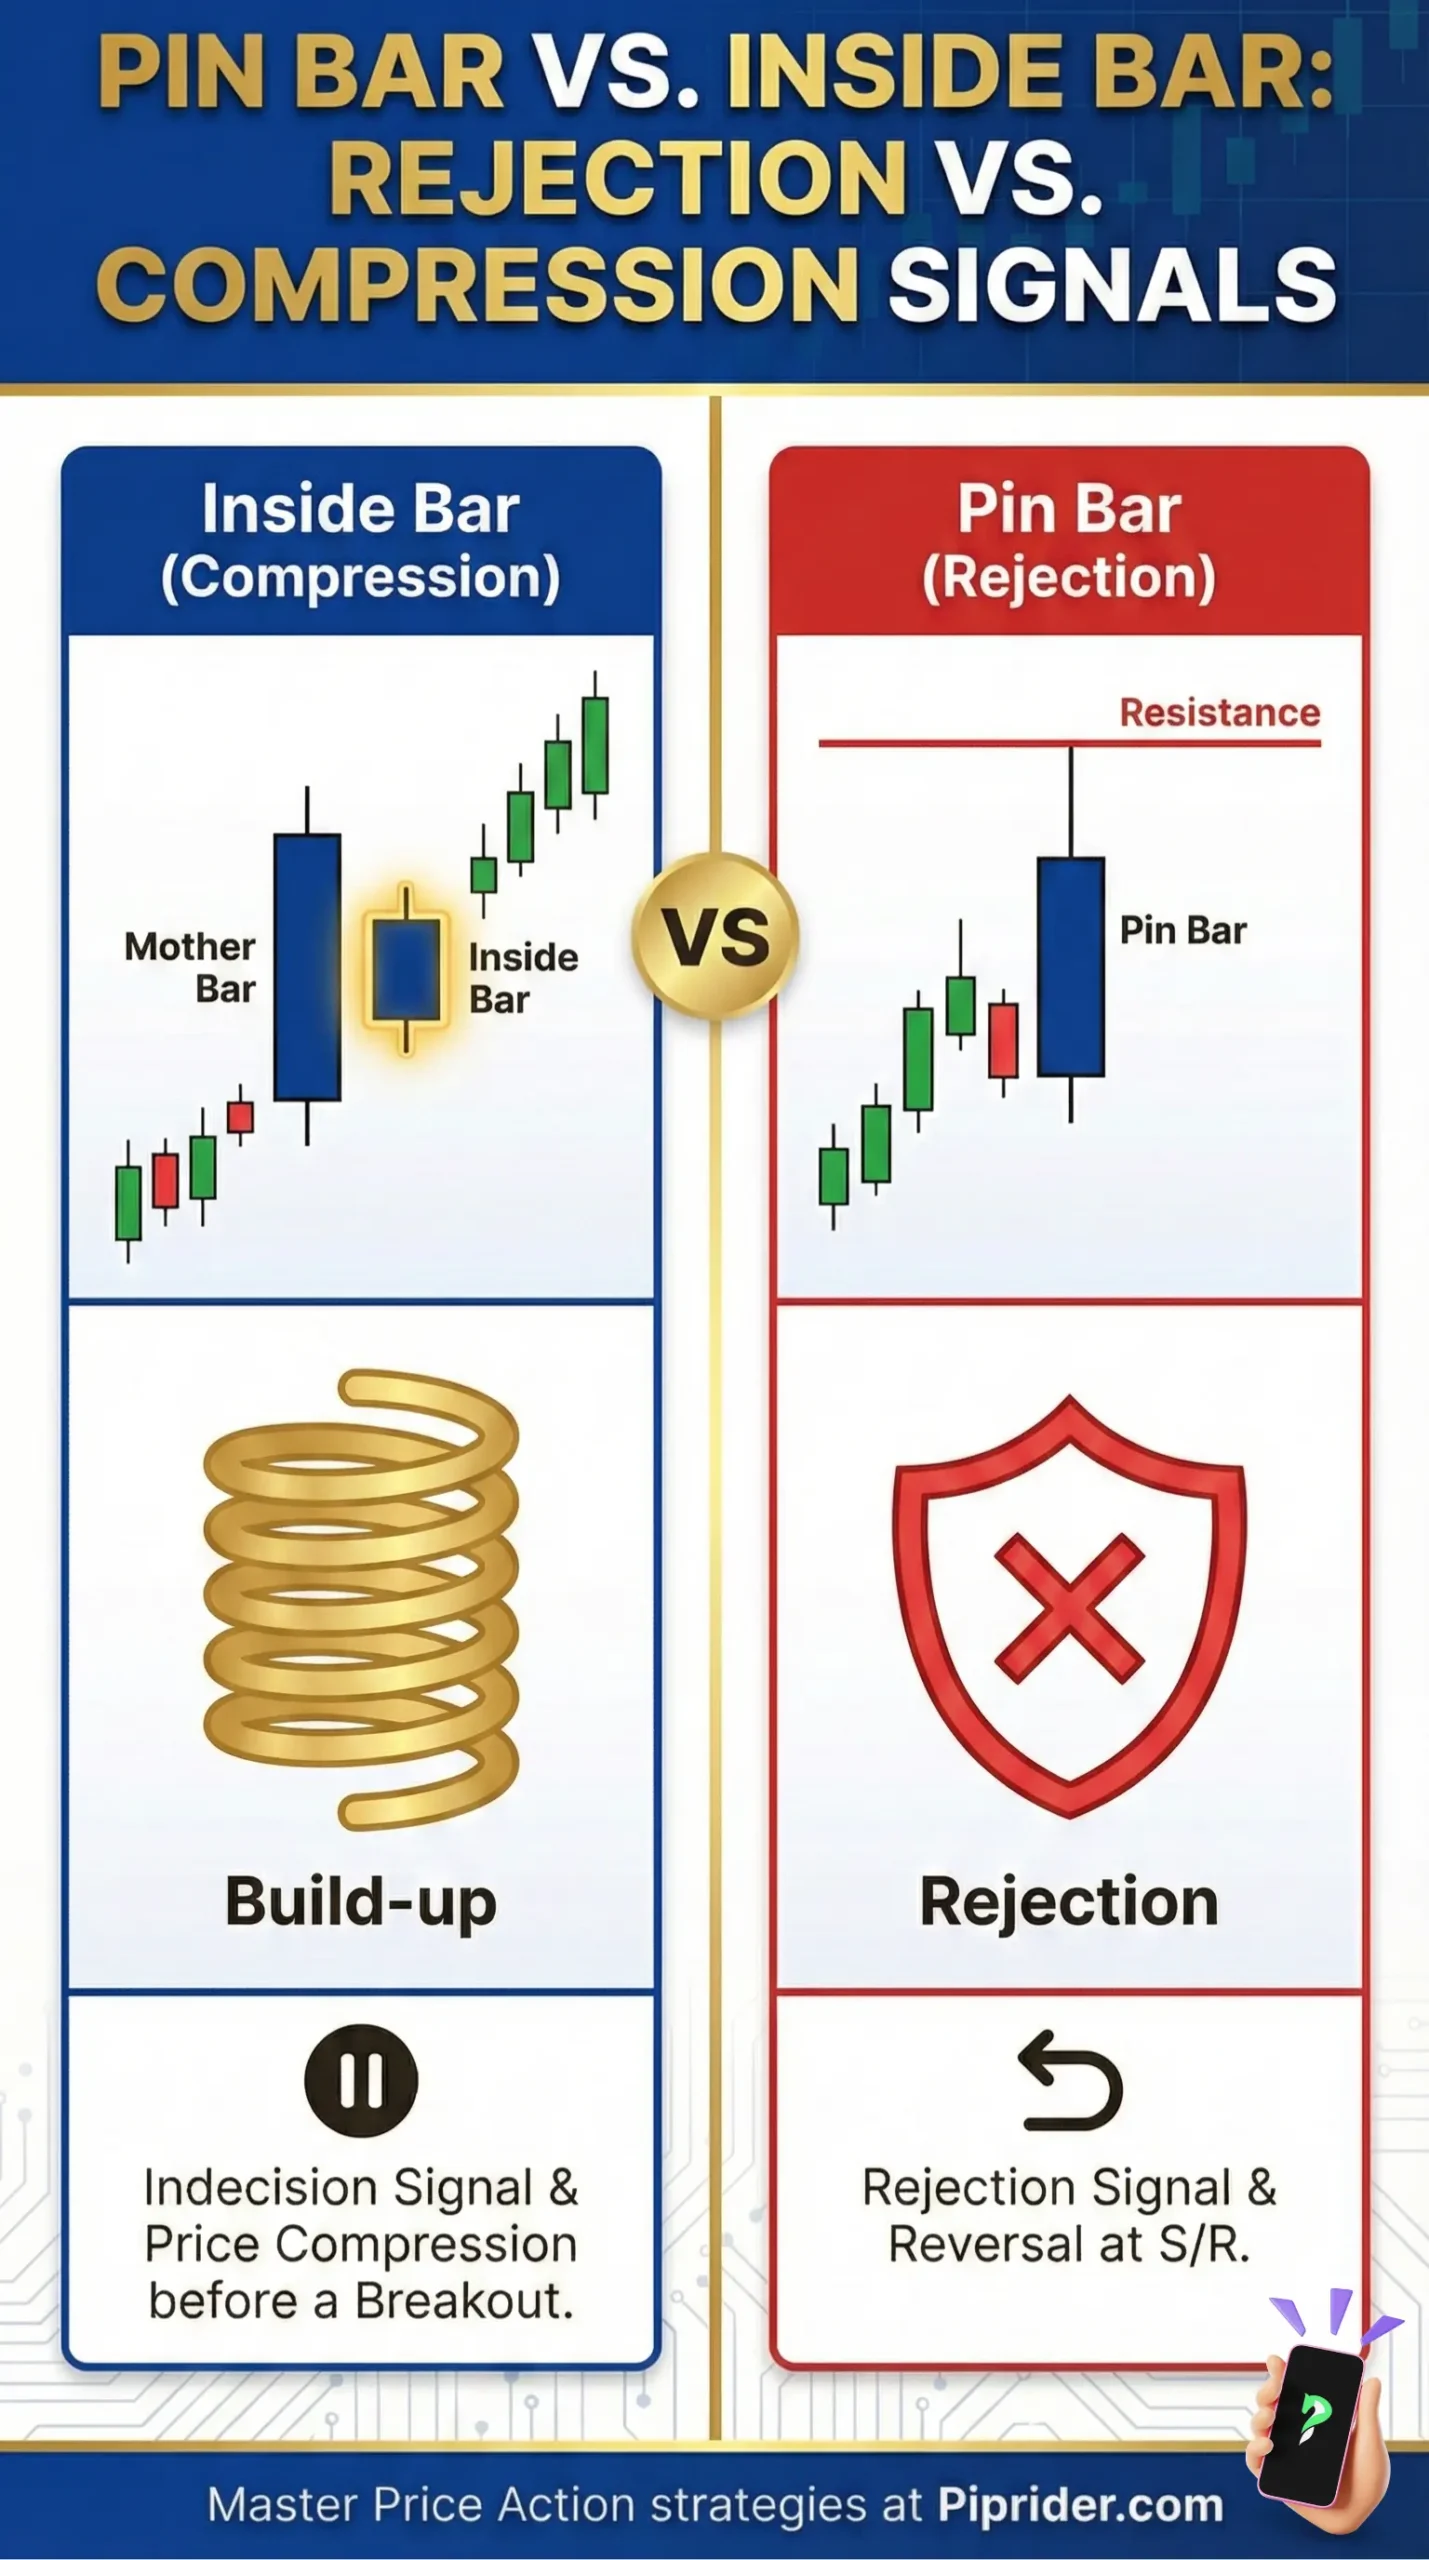
7.2. Comparing with Pin Bar and Engulfing Bar
To master chart reading, you must distinguish between the “quiet” consolidation of an Inside Bar and the “loud” momentum shifts of rejection and expansion patterns:
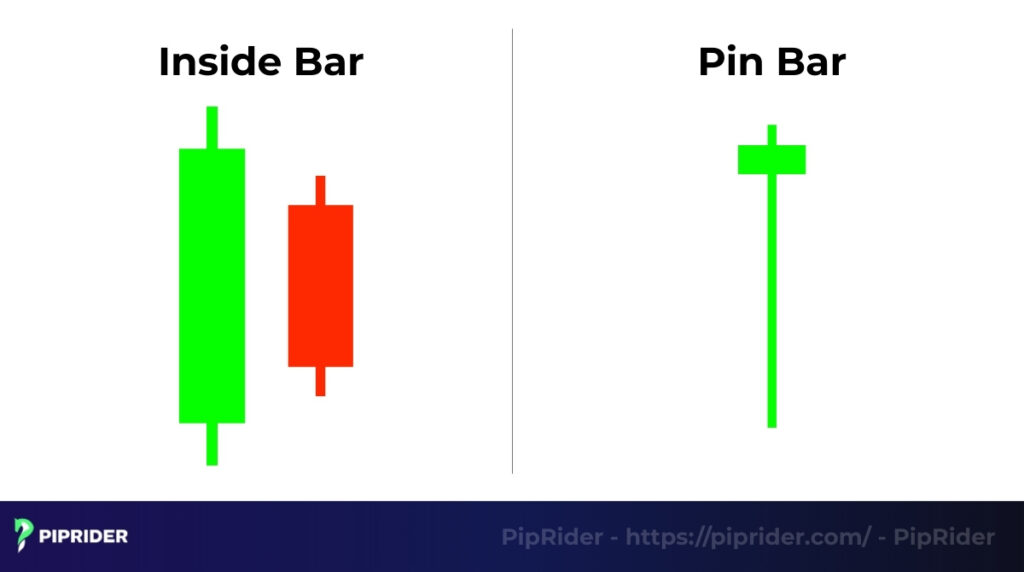
- Vs. Pin Bar: These are psychological opposites. An inside bar signals indecision and a pause in current momentum. A pin bar signals a decisive rejection of a specific price level, often leading to an immediate move in the opposite direction.
- Vs. Engulfing Bar: These represent opposite stages of the volatility cycle. An inside bar is a volatility contraction (the calm before the storm), while an engulfing bar is a volatility expansion (the storm has already begun).
7.3. The “Cheat Code”: Inside Bar + Pin Bar Combo
The most powerful advanced setup occurs when an inside bar is also a pin bar. This Combo Strategy indicates that the market is not only pausing (Inside Bar) but also actively rejecting a level (Pin Bar) within that pause. When this happens at a major support or resistance zone, it is one of the highest-probability signals in price action trading.
7.4. Which Pattern Is More Reliable?
No single pattern is universally “more reliable.” Reliability is a product of Context:
- An inside bar is superior when trading with a strong, established trend on daily charts.
- A pin bar is superior when looking for a “v-bottom” reversal at a major historical demand zone.
8. Frequently Asked Questions (FAQs)
9. Conclusion
In conclusion, the inside bars pattern is a powerful and versatile tool in a price action trader’s arsenal. It provides a clear signal of market indecision, often preceding a significant break.
While a simple pattern, its reliability increases dramatically when combined with other confirming factors, such as key support/resistance levels, indicators, or multi-timeframe analysis.
The key to success is practice. We strongly advise traders to thoroughly test any strategy on a demo account and maintain a detailed trade journal to track performance before risking real capital. To continue developing your chart reading skills, we encourage you to explore more in-depth guides in our Forex Chart Patterns category on Piprider.
Infographic Section
-
Mastering the Inside Bar Pattern -
Inside Bar Pattern Structure & Psychology -
Pin Bar vs. Inside Bar


