
The Long-Legged Doji (LLD) is a significant single-candlestick formation that identifies high volatility and a temporary balance between buyers and sellers. It is not a guaranteed directional signal, but rather a warning that the current trend’s momentum may be reaching a state of exhaustion. For experienced traders, recognizing this state of market neutrality helps improve the structure for risk definition and identifying potential reversal zones at key technical levels.
This article provides a comprehensive guide, detailing market psychology, identification rules, and probabilistic trading strategies based on this pivotal pattern.
Key Takeaways
- The LLD marks a point of high volatility and supply/demand equilibrium where neither bulls nor bears can sustain control.
- The pattern is most effective for identifying potential reversals at major S/R levels or trend extremes; in sideways ranges, it is often viewed as market noise.
- If reliable volume data is available, higher activity can strengthen the signal. In spot FX, treat volume as a tick-volume proxy, not a hard confirmation.
- Risk management is a primary advantage, as the long shadows provide objective levels for stop-loss placement.
- High-probability setups often involve confirmation from technical indicators (RSI/MACD Divergence) and price action confirmation.
1. What Is a Long Legged Doji?
A Long Legged Doji is a single candlestick pattern that signals market indecision and high volatility within a specific trading session. It is characterized by two defining structural elements: a near-zero real body and elongated, prominent shadows.
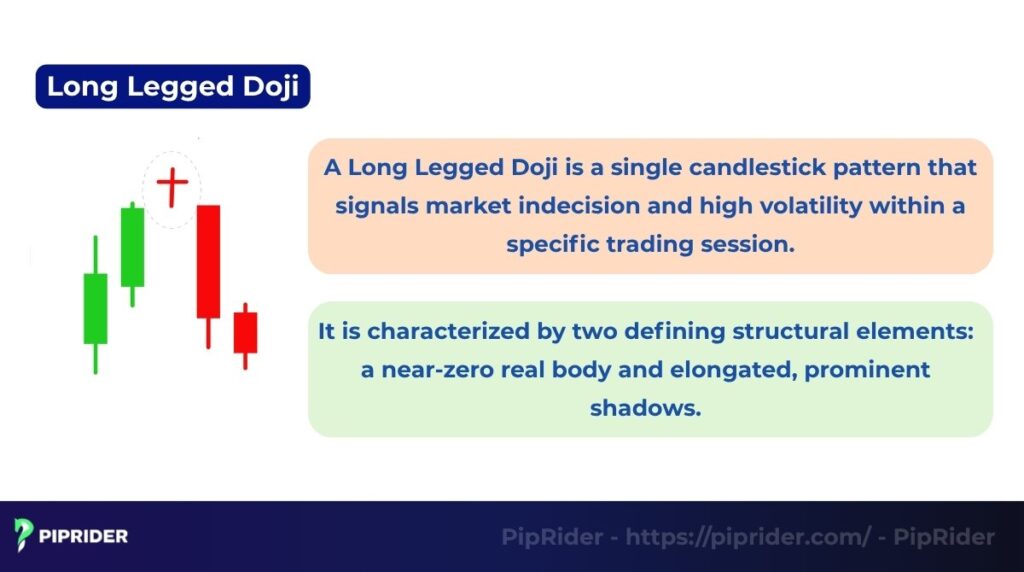
The Long Legged Doji visually resembles a plus sign or a cross with exceptionally long vertical arms. The horizontal arm (the real body) is situated near the middle, signifying that the opening price and the closing price are virtually identical, regardless of the intense price action during the session.
1.1. Difference from a Standard Doji
The distinction is based on volatility and range. A Standard Doji has short shadows, suggesting limited price movement and mild indecision. The Long Legged Doji, by contrast, has shadows that are significantly longer, indicating an enormous range of motion (Axiory, 2022).
This confirms an intense, protracted battle between supply and demand, marking a definitive climax in volatility for that specific period.
1.2. Why It Signals Strong Market Indecision
The Long Legged Doji pattern confirms a state known as Volatility Equilibrium (Mitchell, 2023). The long shadows are the visual record of failed attempts by both bulls and bears to secure a decisive close at extreme levels.
This failure to hold the high or low confirms that a significant price movement occurred but failed to materialize into a trend, resulting in maximum market indecision.
2. How a Long Legged Doji Candlestick Forms
Understanding the formation of an LLD is crucial for reading sentiment shifts. Its structure reflects a four-stage psychological battle:
- Price opens and closes at nearly the same level: This forms the tiny central body, providing visual evidence of the session’s ultimate neutrality.
- Long upper and lower shadows: These represent the extreme intraday tug-of-war. The symmetry of these shadows reinforces the idea that neither side could overwhelm the other.
- Market psychology: After a sustained move, an LLD suggests the dominant force has exhausted its capital. For example, in an uptrend, the long upper shadow represents the last failed surge of buying power before sellers stepped in aggressively.
Read more:
Top 21 Trading Patterns Every Trader Should Master in 2025
How To Trade Bearish Shooting Star Candlestick Pattern?
Gartley Patterns: A Trader’s Guide to Harmonic Chart Signals
3. Characteristics of a Long Legged Doji Candlestick
A valid Long Legged Doji Candlestick must possess specific, non-negotiable visual attributes. Failure to meet these criteria diminishes its reliability as a major reversal pattern, turning the potential signal into market noise.
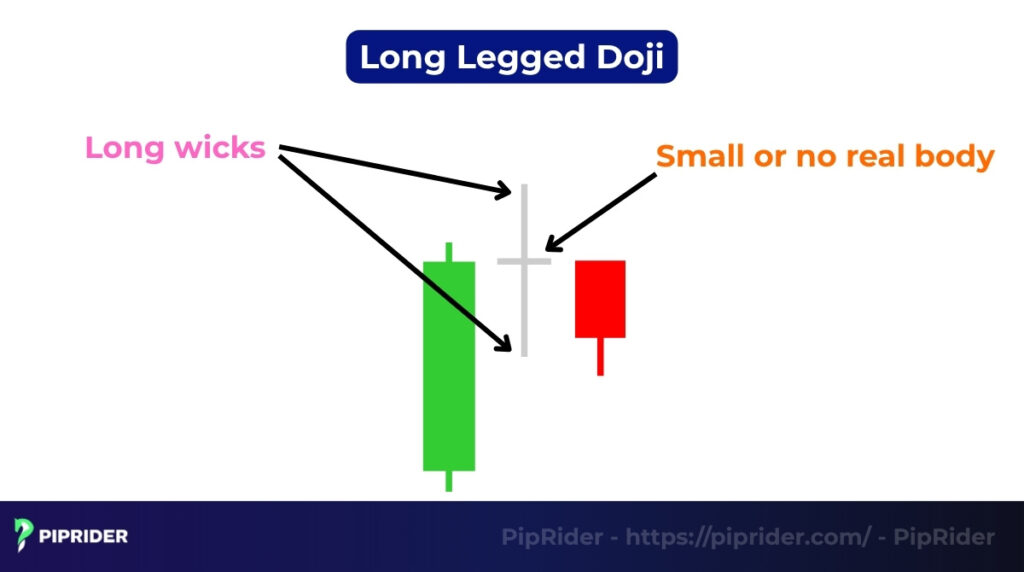
- Very small or no real body: The opening and closing prices should be within a tiny fraction (typically less than 5%) of the session’s total range.
- Long wicks both up and down: The shadows must be substantially larger than those of surrounding candlesticks and relatively balanced.
- Contextual Appearance: Its significance is greatly amplified when it materializes following parabolic moves or directly at tested support or resistance levels (Axiory, 2022). In sideways markets, it signals high volatility without direction, unlike the low-volatility tight range of an inside bar.
4. What the Long Legged Doji Pattern Means in Trading
The LLD’s meaning is purely contextual and should never be traded in isolation (Alchemy Markets, 2023).
| Context of Appearance | Signal Interpretation | Trading Implication |
| At Trend Extremes (Peak/Trough) | Exhaustion indicator: Signals that the dominant force has met an equally strong counter-force | Potential Setup: Prepare for entry based on a confirmed breakout of the LLD range |
| Near Support/Resistance (S/R) | S/R confirmation: Confirms price is actively testing the level but failing to break it decisively | Boundary confirmation: Use the LLD’s extremes as a “Line in the Sand” for invalidation |
| In a Ranging or Choppy Market | Continuation of noise: Reaffirms range boundaries; signals volatility without direction | Avoidance: Stand aside until a definitive breakout occurs on increased volume |
5. Long Legged Doji Colors and Variations
Technical analysts primarily focus on the volatility and position of the shadows rather than the marginal color of the body.
5.1. Red vs Green Long Legged Doji: Does it Matter?
No. Whether the real body is green (close slightly above open) or red (close slightly below open) is statistically insignificant for the LLD, unlike the decisive nature of a marubozu candlestick pattern. Any difference between open and close is considered noise relative to the total volatile range of the candlestick.
5.2. Accuracy and Interpretation Differences
The primary factor influencing the quality of the signal is the length of the shadows relative to the average candle size. A “Perfect LLD” (where the body is exactly at the center) signals a higher state of equilibrium.
6. When and Where the Long Legged Doji Candlestick Appears
LLDs are universal but their predictive reliability depends on market structure:
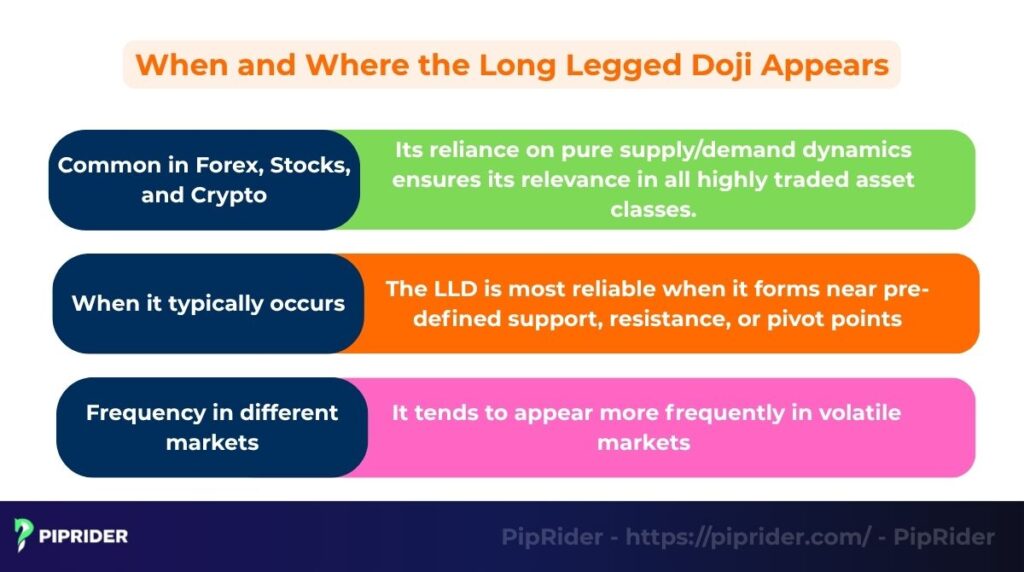
- Common in Forex, Stocks, and Crypto:
Its reliance on pure supply/demand dynamics ensures its relevance in all highly traded asset classes. It is particularly valuable in the 24-hour Forex and Crypto markets where liquidity fluctuations are constant.
- When it typically occurs:
The LLD is most reliable when it forms near pre-defined support, resistance, or pivot points, especially following a sharp, sustained significant price movement. Look for this pattern immediately following a candlestick with a Marubozu-like (full-bodied) appearance, as this transition from maximum momentum to maximum indecision is highly indicative of reversal.
- Frequency in different markets:
It tends to appear more frequently in volatile markets (e.g., highly leveraged Forex pairs or Cryptocurrency) due to rapid shifts in sentiment and execution of large stop orders, which create the long wicks. Higher timeframes (Daily/Weekly) make the LLD significantly more reliable due to the commitment of capital required to form such large ranges.
7. Illustrative Case Study: Long Legged Doji in Action
The setup below explains the logic of entry/stop/target. Replace the scenario with a real chart screenshot for verification.
- Scenario (EUR/USD, 4-Hour Chart): The pair has been in a sustained downtrend for several days, approaching a major weekly support level at 1.0800.
- The LLD Formation: An LLD forms, with the lower shadow piercing 1.0790 (testing for liquidity) and the upper shadow reaching 1.0820. The close returns to 1.0805.
- Technical Confirmation: The next candle is a high-momentum bullish candle (e.g., Bullish Engulfing) that closes decisively above 1.0820.
- Note on Volume: In Spot FX, volume is usually tick volume (BabyPips, n.d.). A spike in tick volume during the LLD suggests intense participation, acting as a supportive proxy for activity.
- Result: The LLD defines the risk level, and the confirmation signals a trend shift toward the 1.0950 resistance.
8. How to Trade the Long Legged Doji Candlestick
Trading the LLD requires patience and adherence to strict confirmation protocols to transform a neutral signal into a directional entry.
8.1. Wait for Confirmation from the Next Candle
This is the most critical step. The LLD pattern sets the boundary; the confirmation candlestick dictates the direction and the force of the potential reversal.
- Bearish Confirmation: The candlestick immediately following the LLD must close below the low of the LLD. Required Quality: The confirmation candlestick should ideally be a large-bodied bearish candlestick, showing strong selling pressure.
- Bullish Confirmation: The candlestick immediately following the LLD must close above the high of the LLD. Required Quality: The confirmation candlestick should ideally be a large-bodied bullish candlestick, showing strong buying pressure.
8.2. Entry Strategies Using Support and Resistance
The LLD’s neutral status requires traders to rely on the confirmation candlestick to determine direction. Once confirmed, the structure of the LLD provides two primary methods for entering the market, each balancing speed against risk-reward ratio (RRR).
- Breakout Entry: Enter the market immediately upon the close of the confirmation candlestick.
- Limit Entry (Midline Rule): Place a limit order at the LLD’s midline (Open/Close price) for a tighter RRR.
- Retest Entry (Safer): Wait for price to break the LLD range, then return to retest the broken high/low or the midline. Only enter if the level holds.
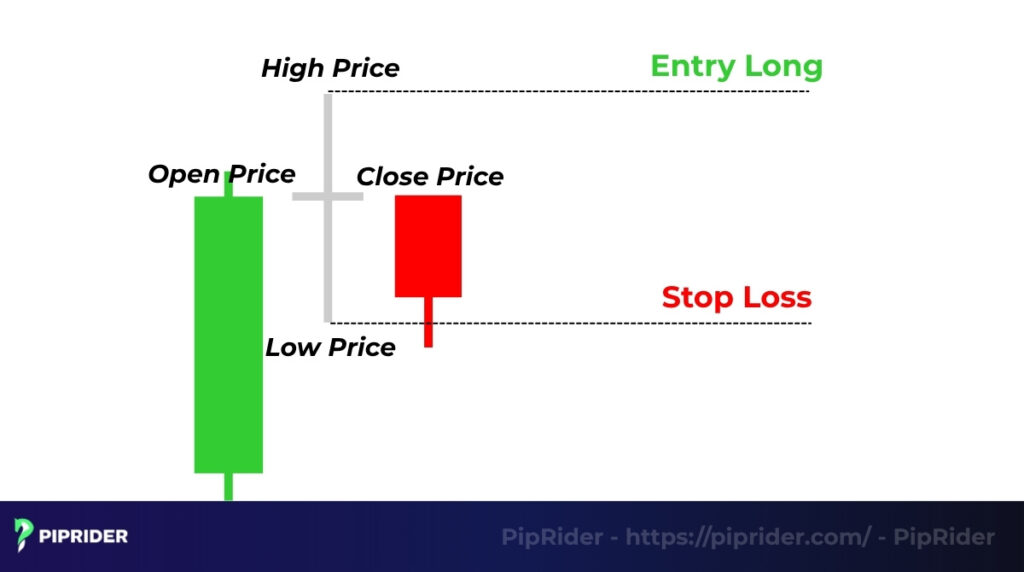
8.3. Stop-Loss and Take-Profit Placement
The LLD pattern is exceptional for defining risk because its extreme shadow provides a clear invalidation level, the “Line in the Sand.”
- Stop-Loss Placement: Place the stop-loss order precisely 1-2 ticks/pips beyond the LLD’s longest shadow (the extreme end). If the price breaches this extreme, the initial reversal thesis is invalidated.
- Take-Profit Placement: Use traditional S/R levels or a fixed Risk-Reward Ratio (RRR). For volatile patterns like the LLD, aiming for a minimum of 1:2 or 1:3 from the entry point is standard practice.ting the next major structure that held price previously.
- TP1: Nearest structural level (prior swing high/low or next S/R).
- TP2: Use a trailing stop or target a fixed 1:2 / 1:3 Risk-Reward Ratio based on the next major structure.
8.4. Risk-Reward Example
If the LLD’s shadow defines a risk (distance between entry and SL) of 20 pips, and the trader uses the advanced Midline Entry (reducing risk exposure to, say, 10 pips), the trader should target a Take Profit of at least 30 to 50 pips to achieve an optimized RRR of 1:3 to 1:5. This requires careful technical analysis by traders.
9. Advantages and Disadvantages of the Pattern
Like any analytical tool, the LLD presents both significant benefits and inherent limitations that experienced traders must acknowledge for effective use, especially when managing risk in volatile conditions.
| Strengths (Advantages) | Weaknesses (Disadvantages) |
| Identifies exhaustion: Uniquely identifies market turning points after aggressive moves | Low predictive value alone: Dangerous to trade in isolation without a confirmation candle |
| Precise Risk Definition: Provides clear, objective levels for surgical stop-loss placement | Frequent Noise: Often appears in choppy, low-liquidity markets where it has no directional meaning |
| High RRR Potential: Tight stops at the wick extremes allow for superior risk-to-reward ratios | Context Dependent: Must be verified against the dominant trend on higher timeframes |
10. Long Legged Doji vs Other Candlestick Patterns
Distinguishing the LLD from similar patterns is crucial for correct market interpretation, especially differentiating between neutral exhaustion (LLD) and directional rejection (Dragonfly/Gravestone). This is an essential part of technical analysis.
| Pattern | Key Differentiator | Market Sentiment |
| Long Legged Doji | Balanced, very long shadows | Neutral / Maximum Indecision |
| Dragonfly Doji | Long lower shadow, no/tiny upper shadow | Bullish Rejection of Lows |
| Gravestone Doji | Long upper shadow, no/tiny lower shadow | Bearish Rejection of Highs |
| Standard Doji | Short shadows, small range | Low Volatility Indecision |
| Spinning Top | Small real body, medium shadows | Weak Indecision (Less volatile) |
11. Tips to Improve Accuracy
Relying solely on the visual pattern is insufficient. High-conviction trades involving the LLD demand convergence with key technical indicators and volume analysis to filter out false signals.
11.1. Combine with Indicators (RSI, MACD, Moving Averages)
The LLD is most potent when it completes a Divergence (RSI/MACD) at a key Fibonacci level or moving average (Axiory, 2022). Look for the price to make a new high (or low) while the RSI or MACD fails to follow suit. If the LLD formation occurs at this point, the reversal signal is significantly validated, as it confirms the momentum is already failing internally.
Also, ensure the LLD formation is occurring either at a Moving Average (MA) confluence or a major psychological level (e.g., round number). This approach is key to effective technical analysis.
11.2. Confirm with Volume
High (tick) volume during the LLD’s formation confirms massive order exchange. In Spot Forex, tick volume is the primary proxy for measuring trading activity and interest (EarnForex, n.d.). Low volume LLDs are noise. This reflects the intense sentiment battle.
11.3. Avoid Relying on it in Sideways/Choppy Markets
Do not use the LLD pattern as a primary entry signal unless the market is clearly trending. Its power is derived from its ability to stop an established significant price movement.
12. Common Mistakes to Avoid
Even experienced traders can misinterpret this pattern due to focusing on the shape rather than the context. Avoiding these common pitfalls maximizes the LLD’s predictive value and protects capital.
- Trading the pattern without confirmation: This is the most common error. The LLD only shows potential; the next candlestick shows commitment. Always wait for the close of the confirmation candlestick.
- Confusing it with similar candle types: Misinterpreting a Gravestone Doji (bearish) as a simple LLD (neutral) can lead to premature, high-risk short entries, especially if the upper shadow is clearly dominant.
- Ignoring the broader trend context: Entering a short trade based on an LLD on the 1-hour chart when the overall trend (Daily/Weekly chart) is massively bullish is trading against the macro flow, which often results in stop-out. Always check the next higher timeframe.
13. FAQs
Below are quick, direct answers to the most frequent and critical questions surrounding the use and reliability of the Long-Legged Doji (LLD).
14. Conclusion
The Long Legged Doji pattern is a crucial diagnostic tool, identifying the exact moment supply and demand forces hit maximum equilibrium. Remember these key principles: Context, Divergence, and Confirmation are essential. Never trade the LLD in isolation. Instead, use its long shadows for precise stop-loss placement, patiently wait for directional commitment, and integrate it with volume/momentum indicators for high-probability execution. Mastering the LLD helps you move from simply observing price to anticipating pivotal market turns.
To further master identifying market reversals and momentum shifts, explore our comprehensive collection of detailed guides. See more strategies and in-depth analysis on other key formations in the Analysis section of Piprider.


