The Money Flow Index (MFI) is a momentum indicator that measures the flow of capital into and out of an asset. Often described as the “volume-weighted RSI,” the MFI distinguishes itself by integrating both price action and trading volume into a single oscillator. While standard indicators like the Relative Strength Index (RSI) only track the speed of price changes, the MFI uses volume to confirm whether a price movement is backed by genuine market conviction or is merely an empty, low-volume fluctuation.
This guide details the MFI indicator’s calculation, explains how to interpret its structural signals, and shows you how to integrate it into a disciplined trading strategy.
Key Takeaways
- MFI is the volume-weighted RSI; it measures momentum using both price changes and trading volume.
- MFI is derived from comparing Positive Money Flow (buying) to Negative Money Flow (selling) over a 14-period default setting.
- MFI is most reliable in high-volume trending markets; avoid using it in sideways or ranging markets where it frequently generates false signals (whipsaws).
- Prioritize divergence (MFI and price moving against each other) and the overbought/oversold levels (above 80 and below 20) for trade signals.
- MFI is generally more reliable than RSI in high-volume markets because the volume component filters out weaker, less-supported price movements.
- Use MFI to confirm trend strength and identify high-probability reversals at market extremes.
1. What Is the Money Flow Index (MFI)?
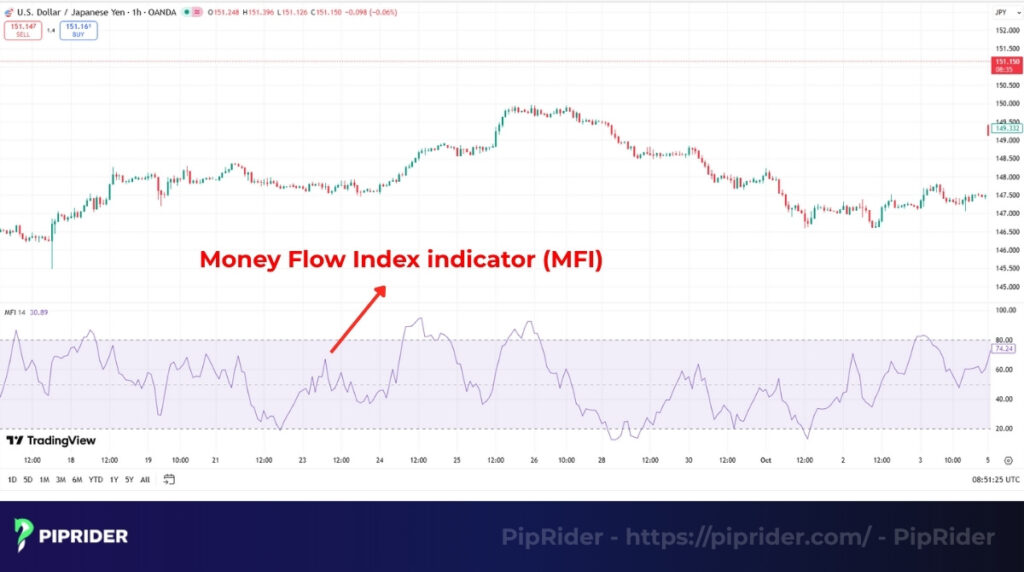
The Money Flow Index (MFI) is a technical oscillator used to measure the intensity of capital flowing into and out of a security over a set period (Investopedia, 2024). By incorporating volume data, it provides a more multidimensional view of market sentiment than pure price oscillators.
The MFI typically oscillates between 0 and 100, with the 80 and 20 thresholds commonly marking the overbought and oversold regions. Its primary function is to highlight the structural strength of a trend. For example, an MFI reading above 80 suggests that capital inflow has been intense, warning traders of an overbought condition and a potential price correction.
Developed by Quong and Soudack (n.d.), the MFI improves upon price-only oscillators by assigning weight to trading volume to filter out market noise. Because its mathematical structure mirrors the RSI but assigns weight based on trading volume, the MFI effectively filters out weak price spikes. This allows traders to focus solely on moves driven by actual institutional or retail capital flow, offering a distinct analytical advantage.
2. MFI vs RSI: What’s the Difference?
While the Relative Strength Index (RSI), originally developed by Wilder (1978), focuses exclusively on price momentum, the MFI integrates volume to provide a more comprehensive view of market conviction. Both are momentum oscillators that measure the speed and change of price movements. However, they rely on fundamentally different inputs, making them serve different analytical purposes.
The MFI gains a significant advantage by integrating volume, which acts as a crucial confirmation filter. This allows traders to gauge whether a price movement is supported by actual capital flow or just thin, algorithmic trading.
| Feature | Money Flow Index (MFI) | Relative Strength Index (RSI) |
|---|---|---|
| Input Data | Price + Volume | Price only |
| Indicator Type | Volume-Weighted Oscillator | Pure Price Momentum Oscillator |
| Signal Reliability | Stronger in liquid markets; volume filters out weak price spikes. | Better for markets where reliable volume data is unavailable. |
| Primary Focus | Capital Conviction (Buying/Selling pressure) | Speed and Magnitude of price change |
Which Is Better: MFI or RSI?
Neither indicator is universally “better”; their effectiveness depends on the market context.
- MFI excels when trading highly liquid assets (like major stocks or ETFs) because it uses volume to expose “fakeouts.” If the price rises but MFI drops, it signals that the volume doesn’t support the move.
- RSI is more practical when trading assets with fragmented or unreliable volume data (like certain Crypto CFDs or minor Forex crosses), where a volume-weighted calculation might produce skewed signals.
Pro Tip: Professional traders often plot them together. If both the MFI and RSI show divergence simultaneously against the price, it creates a highly robust structural confirmation known as Dual Momentum.
3. Understanding the MFI Formula
The MFI calculation is a multi-step process that actively weights price momentum using volume data. This mathematical approach provides a quantifiable measure of buying and selling pressure, typically measured over a 14-period lookback.
3.1. The 5-Step Calculation Process
The indicator is calculated through a structured algorithm:
Step 1: Calculate the Typical Price (TP)
This establishes the average price movement for each period.
Step 2: Calculate Raw Money Flow (RMF)
Raw Money Flow quantifies the volume-weighted capital traded in that specific period.
Step 3: Classify the Money Flow
Compare the current period’s TP to the previous period’s TP to categorize the flow:
- Positive Money Flow: The RMF is positive if Current TP > Previous TP.
- Negative Money Flow: The RMF is negative if Current TP < Previous TP.
- Unchanged Flow: If Current TP = Previous TP, the period is ignored.
Step 4: Determine the Money Flow Ratio (MFR)
Sum the positive and negative flows over the lookback period (e.g., 14 days), then divide them.
Step 5: Final MFI Formula
The final formula normalizes the ratio into an oscillator scale ranging from 0 to 100.
(Note: If the Total Negative Money Flow is zero, the MFR is technically infinite, and the MFI is capped at exactly 100).
3.2. Step-by-Step Calculation Example
To illustrate the exact mathematics, consider a simplified 3-day example focusing on the Money Flow Ratio (MFR) using clean hypothetical data:
| Day | High | Low | Close | Volume | TP | Prev. TP | RMF (TP × Vol) | Flow Type |
|---|---|---|---|---|---|---|---|---|
| 1 | 105 | 100 | 104 | 50,000 | 103.00 | N/A | 5,150,000 | N/A |
| 2 | 107 | 103 | 105 | 70,000 | 105.00 | 103.00 | 7,350,000 | Positive |
| 3 | 106 | 102 | 104 | 60,000 | 104.00 | 105.00 | 6,240,000 | Negative |
The final MFI value directly reflects the market’s power balance: A rising MFI confirms dominant buying pressure (capital inflow), while a falling MFI confirms selling pressure (capital outflow).
Calculation Breakdown (Based on Days 2 & 3):
- Total Positive Money Flow (Day 2) = 7,350,000
- Total Negative Money Flow (Day 3) = 6,240,000
- Money Flow Ratio (MFR) = 7,350,000 / 6,240,000 ≈ 1.178
- MFI = 100 − [100 / (1 + 1.178)] ≈ 100 − 45.91 = 54.09
A resulting MFI of 54.09 indicates a slight bias toward capital inflow (buying pressure) over this short period.
4. Interpreting MFI Signals
Interpreting the MFI involves analyzing both the extreme levels of the oscillator and, more importantly, the relationship between the MFI line and the price structure.
4.1. Overbought and Oversold Levels
MFI overbought levels (above 80) and oversold levels (below 20) identify extremes in capital flow where price reversals are statistically more likely. While these levels signal potential trend exhaustion, they must be filtered through market context to avoid “indicator traps” in strong trends.
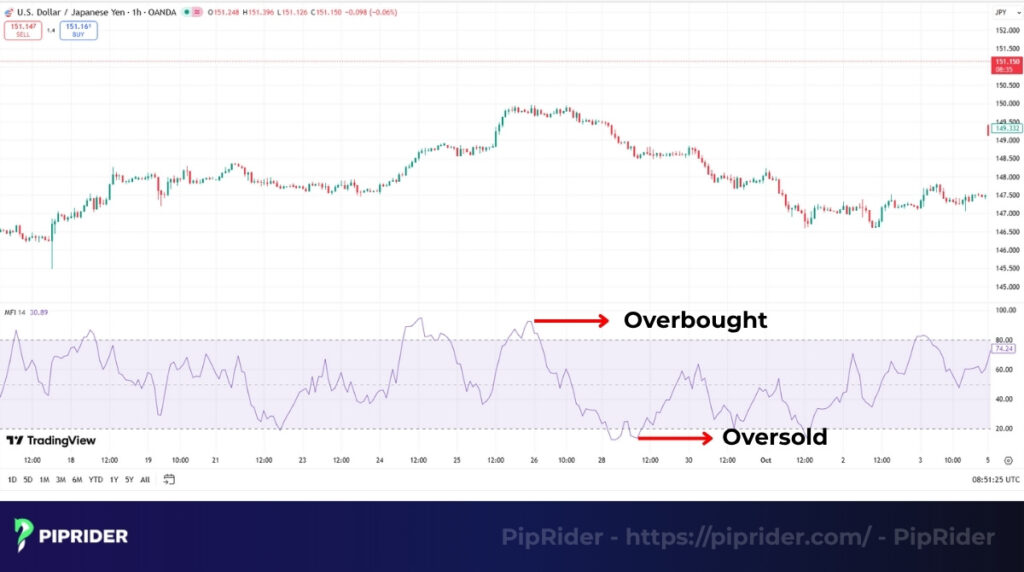
- Overbought (Above 80): This reading signals that capital inflow has reached an extreme. It suggests that buying pressure is exhausting and the asset may be nearing a structural peak or a period of consolidation.
- Oversold (Below 20): This reading signals that capital outflow has reached a panic extreme. It suggests that selling pressure is fading and the asset may be due for a technical rebound or a bullish reversal.
The 50-Level (Center Line): The 50-level acts as the market’s neutral point. When the MFI crosses above 50, it confirms that positive money flow is taking control, often acting as an early signal of bullish momentum. Conversely, a decisive cross below 50 indicates that negative money flow has become dominant.
The Context Filter: The Difference Between a Reversal and a Trap
Extreme MFI readings are not standalone entry signals. In a robust, trending market, the MFI can remain “pinned” above 80 or below 20 for extended periods while the price continues to move aggressively.
- In a Strong Trend: An overbought/oversold reading often confirms trend strength rather than a reversal.
- The Execution Rule: Only consider a reversal trade when the MFI extreme aligns with a major high-timeframe support/resistance zone or a confirmed Price Action rejection pattern (e.g., a Pin Bar or Engulfing candle).
4.2. Divergence: The Core MFI Signal
While overbought and oversold levels offer basic context, identifying divergence is widely considered a highly practical way to apply the MFI indicator. Divergence occurs when price action and the underlying momentum decouple, warning of a potential structural shift. Because the MFI incorporates volume, a divergence suggests that the actual trading volume supporting the current trend is drying up.
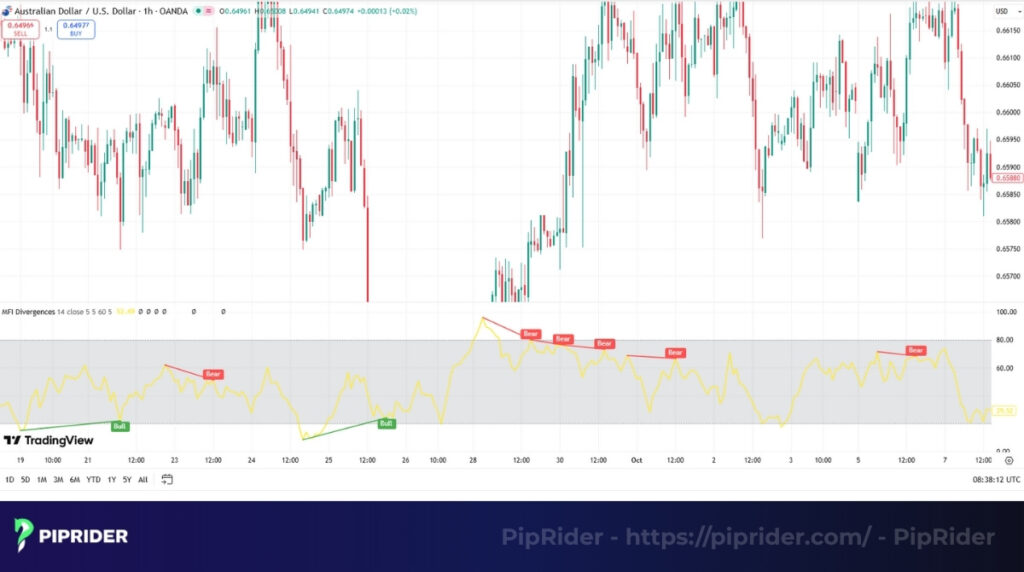
- Regular Bullish Divergence: This forms when the price structure prints a lower low, but the MFI registers a higher low. This structural mismatch suggests that while the price is dropping, the volume-backed selling pressure (negative money flow) is actually exhausting. It serves as a structural cue that downward momentum is stalling, warning of a potential bullish reversal.
- Regular Bearish Divergence: This occurs when the price records a higher high, but the MFI prints a lower high. This warns traders that the final upward price thrust lacks genuine volume support. The positive money flow (buying interest) is waning, indicating a potential market top and cueing traders to reassess long positions or tighten stop-losses.
- Hidden Divergence (Pro Tip): Advanced traders also look for hidden divergence to confirm trend continuation. For example, a hidden bullish divergence occurs when the price makes a higher low (maintaining the uptrend structure), but the MFI drops to a lower low. This deep reset in momentum, without breaking the bullish price structure, suggests a pullback where buying interest may be stepping back in.
5. Market Context: When to Use (and Avoid) the MFI
The Money Flow Index (MFI) is most effective in clear, high-volume trending markets where price momentum is backed by actual capital flow. Conversely, the indicator underperforms and frequently generates false signals in sideways or ranging markets due to a lack of directional volume.
The MFI is most effective when:
- There is a clear trend: In a strongly directional market, the MFI provides high-probability structural signals by highlighting momentum exhaustion (via divergence) or logical pullback entries.
- There is high volume: Because its calculation is volume-weighted, the MFI requires robust liquidity. High volume ensures the oscillator’s readings reflect genuine buying or selling pressure rather than random market noise.
The MFI underperforms when:
- The market is sideways: In a consolidating, ranging market, the MFI becomes highly unreliable. Without a clear trend, minor price fluctuations cause the indicator to swing erratically between the overbought and oversold extremes, generating continuous false signals (whipsaws).
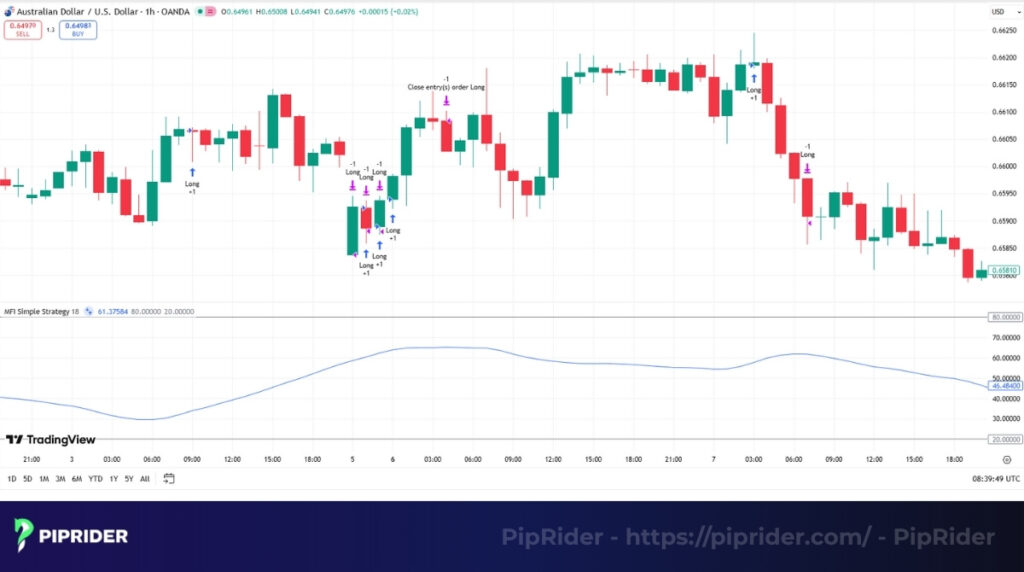
6. A Step-by-Step MFI Trading Strategy
Trading purely based on “overbought” (80) or “oversold” (20) readings is a common trap that often leads to buying into a falling knife or shorting a runaway trend. To trade the MFI effectively, you need a structured approach that combines market context, momentum confirmation, and strict risk parameters.
Timeframe Application: While this 5-step framework is adaptable to various trading styles, it yields the most robust structural signals on higher timeframes, particularly the 1-Hour (H1), 4-Hour (H4), and Daily (D1) charts, where volume data is more aggregated and reliable.
Strategy 1: Divergence Reversal (The Core MFI Setup)
Step 1: The Context (Identify the Value Zone)
Never look for MFI signals in the middle of a random price range. MFI signals carry the highest conviction when they align with established market geometry. Wait until the price reaches a major, high-timeframe support or resistance zone, a key Fibonacci retracement level, or a significant trendline. Divergence occurring outside these zones is often just market noise.
Step 2: The Setup (Divergence + The “Hook”)
- Observe Divergence: As the price tests your identified zone, look for structural divergence. For a long setup, the price should make a lower low into support, while the MFI prints a higher low, indicating that selling pressure is exhausting despite the dropping price.
- The Hook: Do not enter a trade simply because divergence exists. You must wait for the MFI line to decisively “hook” back from the extreme territory. For instance, the MFI should cross back above the 20 line for a long setup, or below the 80 line for a short setup. This hook confirms that capital flow is actively shifting direction.
Step 3: The Confirmation & Entry
The MFI serves as an excellent early warning system, but price action remains the ultimate trigger for execution.
- Confirmation: Wait for a definitive break in the local price structure. This could be a strong reversal candlestick pattern (such as an Engulfing candle or an Evening/Morning Star) or the break of a descending short-term trendline.
- Entry: Execute the trade only when the price breaks the high of your bullish confirmation candle (for longs) or the low of the bearish confirmation candle (for shorts). This ensures you are entering with the newly confirmed momentum, rather than blindly anticipating it.
Step 4: Stop Loss (SL) Placement
The stop loss must be placed at a strategic level where the reversal setup is technically invalidated, meaning the original trend has resumed.
- Placement: Position your SL just beyond the absolute swing low (for longs) or swing high (for shorts) of the reversal pattern.
- The Buffer Rule: Placing a stop loss exactly at the swing extreme makes your position highly vulnerable to liquidity sweeps. Always add a structural buffer, such as your broker’s spread plus a small fraction of the Average True Range (ATR) to survive random volatility spikes and market noise.
Step 5: Take Profit (TP) & Trade Management
- Primary Target: Aim for the next logical market structure, such as a previous swing high/low or a major supply/demand zone.
- R:R Requirement: As a strict risk management rule, calculate the distance to your primary target to ensure it offers a Risk-to-Reward ratio of at least 1:2. If the technical chart structure does not provide enough room for a 1:2 R:R, the trade is structurally flawed and should be skipped.
Strategy 2: Trend Continuation (The MFI Pullback Setup)
While divergence is used to anticipate reversals, the pullback strategy allows traders to join an established trend. In a robust uptrend, the MFI rarely drops to the traditional oversold level of 20. Instead, a momentum reset to the 40–50 zone often provides a structural entry point.
Step 1: The Context (Confirmed Uptrend)
Identify a clear bullish market structure, characterized by a series of higher highs and higher lows. The price should ideally be trading above a dynamic support level, such as the 20-period or 50-period Exponential Moving Average (EMA).
Step 2: The Setup (MFI Pullback to 40-50)
- Wait for the price to naturally retrace (pullback) toward a previous support zone or the EMA.
- Concurrently, observe the MFI indicator. It should drop from higher levels and reset near the 40 to 50 zone. This drop indicates a temporary decrease in positive money flow (often representing minor profit-taking) rather than a structural trend change.
Step 3: The Confirmation & Entry Filter
Do not enter a long position simply because the MFI hits 40.
- Confirmation: Wait for the price to print a bullish rejection signal in or around the support zone, such as a pin bar, a bullish engulfing candle, or a Morning Star pattern.
- R:R Filter: Before executing, calculate the distance to your first logical target (the recent swing high). Ensure the setup offers a minimum 1:2 Risk-to-Reward ratio. If the chart geometry doesn’t support this, skip the trade.
- Entry Long: Place a buy stop order just above the high of the bullish confirmation candle. This mechanical entry helps confirm that upward momentum has structurally resumed before your position is triggered.
Step 4: Stop Loss & Trade Management
- Stop Loss (SL): Place the SL immediately below the structural swing low of the recent pullback. Apply the standard buffer rule (your broker’s spread + a fraction of the ATR) to protect against random volatility spikes and market noise.
- Take Profit (TP): Target the previous swing high for your first partial take-profit (TP1). For the remaining position, trail your stop loss behind newly formed structural lows to capture potential trend continuation.
Pro Tip for Downtrends: This strategy is equally applicable to downtrends. In a strong bearish trend, wait for the price to pull back up to a resistance level while the MFI bounces to the 50–60 zone (instead of waiting for an extreme overbought reading of 80). Look for bearish rejection candles to trigger short entries, placing a sell stop order below the candle’s low and your SL above the pullback high.
7. Combining MFI with Complementary Indicators
Combining the volume-weighted Money Flow Index (MFI) with price-based indicators creates Technical Confluence. This approach filters out market noise by ensuring that price movements are backed by actual capital flow, identifying trade setups with a higher statistical probability of success.
7.1. MFI + RSI (The Dual Momentum Filter)
While both are oscillators, the RSI measures price speed (velocity) while the MFI measures money flow (volume).
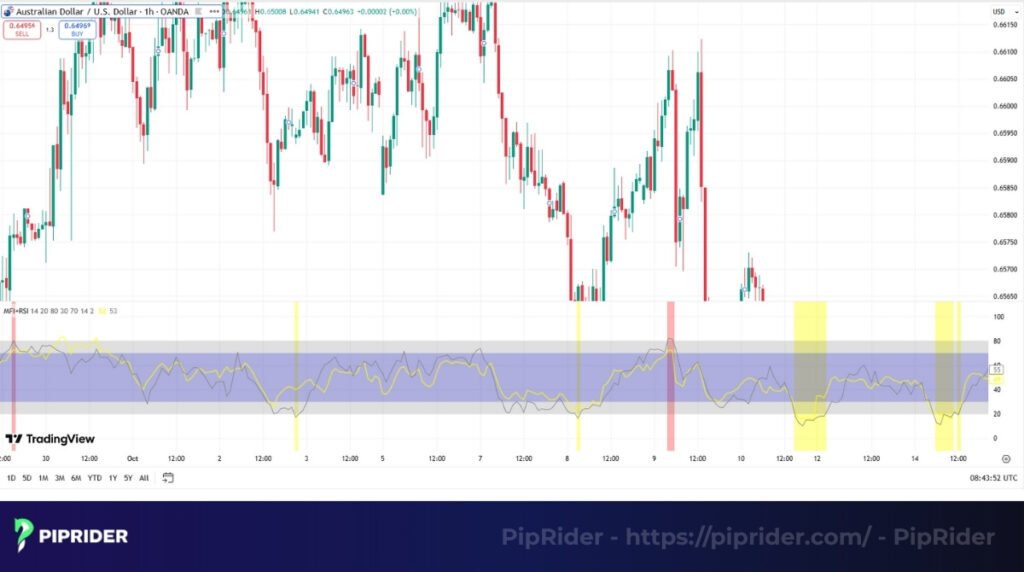
- The Logic: A signal is most reliable when price velocity and capital flow align.
- The Setup (Confluent Divergence): Look for situations where both the RSI and MFI print bullish divergence at a major support level.
- Significance: If the price makes a lower low but both indicators make higher lows, it confirms the move is losing both speed and “fuel” (volume), signaling a high-conviction reversal.
7.2. MFI + Bollinger Bands (Breakout Validation)
Bollinger Bands (BB) identify volatility and price extremes but cannot distinguish between a robust trend and a low-volume fakeout.
- The Logic: Use the MFI to determine if there is enough buying or selling pressure to sustain a band expansion.
- The Filter:
- Valid Breakout: Price breaks the Upper Band while the MFI decisively moves above 60. This suggests the breakout is backed by genuine capital.
- The Fakeout (Whipsaw): Price breaks the Upper Band, but the MFI remains flat or shows divergence. This indicates a “Low-Volume Exhaustion” and warns against entering the trade.
7.3. MFI + MACD (Trend & Flow Alignment)
The MACD identifies the “Big Picture” trend (lagging), while the MFI acts as the “Leading” pulse of the market.
- The Logic: Use the MACD to define the Bias (the “What”) and the MFI to time the Execution (the “When”).
- The Execution Rule: Only take MFI signals that align with the MACD’s prevailing structure.
- In a Strong Uptrend: If the MACD is bullish (histogram above zero), ignore MFI overbought (80) signals. Instead, wait for an MFI pullback to the 40-50 zone to join the trend.
- The Rationale: In powerful trends, oscillators like the MFI often stay “overbought” while the price continues to climb. Trading against this momentum is a common technical error.
8. Best Settings for the MFI Indicator
The default 14-period setting is the industry standard for the Money Flow Index, providing a balanced lookback for most market conditions. However, traders can optimize the MFI settings to align with specific timeframes and asset volatility.
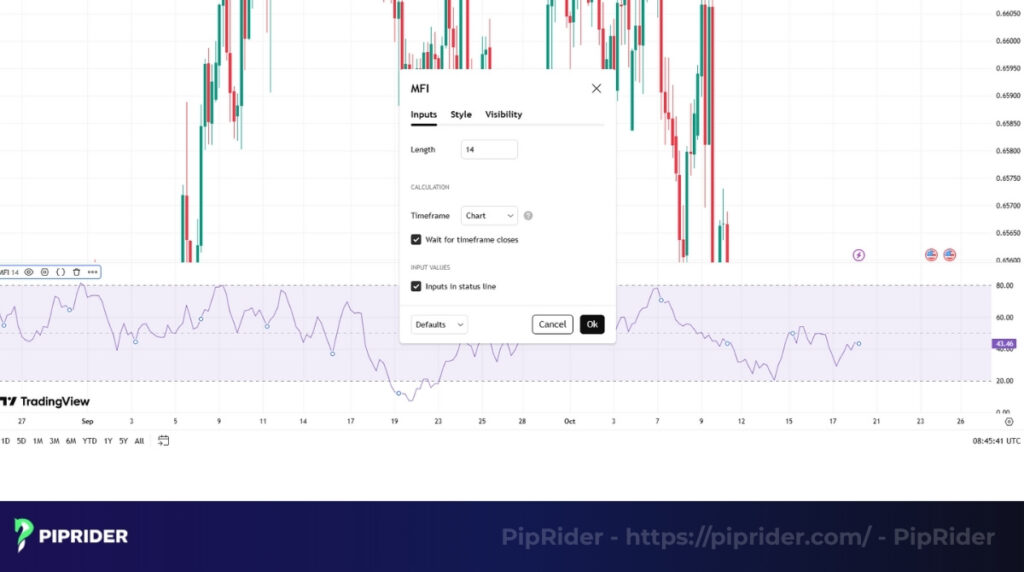
8.1. Period Customization by Trading Style
Adjusting the lookback period changes the indicator’s sensitivity. A shorter period increases signal frequency but also increases “noise,” while a longer period smooths the data at the cost of increased lag.
- For Day Trading & Scalping (M1 to M30): Use a 6 to 10-period setting. This increases sensitivity to intra-day volume spikes, allowing you to catch momentum shifts quickly.
- For Swing Trading (H4 to Daily): Stick with the 14-period default. This is the optimal “sweet spot” for capturing significant capital flows while filtering out daily market noise.
- For Position Trading (Weekly/Monthly): Increase to a 20 or 25-period setting. This creates a smoother oscillator line, helping identify long-term institutional conviction.
8.2. Optimizing Thresholds (80/20 vs. 90/10)
While the 80/20 thresholds are standard, they should be adjusted based on the asset’s specific volatility profile:
- Standard Markets (Blue-chip Stocks, Major Forex): Use 80/20. These levels provide reliable exhaustion signals in markets with stable liquidity.
- High-Volatility Markets (Cryptocurrency, Penny Stocks): Use 90/10. In these markets, money flow can stay “pinned” at extremes for long periods. Tightening the thresholds ensures you only act on the most extreme, high-conviction exhaustion points.
8.3. The Danger of Overfitting
A common mistake is “curve-fitting” or overfitting the MFI period to match historical data perfectly. While a customized setting might look flawless in a backtest, it often fails in live markets because market dynamics are constantly shifting.
The Professional Rule: Use optimization to align the tool with your timeframe’s “pulse,” not to eliminate every past losing trade. Consistency in your settings is more valuable than temporary perfection.
9. Advantages and Limitations of the MFI Indicator
The MFI’s construction offers significant benefits, but traders must acknowledge its inherent drawbacks, particularly regarding data quality.
9.1. Advantages
Understanding the core benefits helps integrate the MFI effectively into a technical analysis framework for higher conviction signals.
- Higher Reliability: By combining price and volume, the MFI provides signals more reliable than pure price oscillators like the RSI, as volume acts as a fundamental confirmation filter.
- Confirmation Tool: Excellent for confirming breakouts (supported by money flow) and identifying trend exhaustion at market extremes.
- Versatility: Functions best in trending markets where volume confirms direction.
9.2. Limitations
Being aware of the MFI’s weaknesses is vital for mitigating risk and avoiding trades based on potentially inaccurate data.
- Lagging in Volatility: The MFI can be lagging (delayed) during sharp, high-velocity price movements, leading to slow entry or exit signals.
- Volume Data Quality: It can generate false signals in markets where reported volume is not centralized or genuine (e.g., Crypto CFDs where the underlying volume is approximated).
- In decentralized markets like Forex, MFI relies on Tick Volume rather than actual capital flow. While still effective, signals should be cross-verified with Price Action to ensure accuracy.
10. Frequently asked questions about MFI Indicator
11. Conclusion
The MFI indicator is an indispensable tool in technical analysis, providing a unique volume-weighted view of market momentum. Its primary role is to gauge the true conviction behind price moves.
MFI is best used to confirm trends and identify high-probability trend reversals using divergence. Never trade MFI in isolation; always combine it with indicators like RSI (for dual momentum) or support/resistance (to filter false breakouts).
Avoid overfitting the MFI period during backtesting; always prioritize confirmation from volume and price action before entering trades. To enhance your skills, follow the technical indicators list sections of Piprider.