
The Price Rate of Change (ROC) is a momentum indicator designed to measure the percentage change in price between the current period and a past period. By tracking this market velocity, the ROC helps traders objectively confirm trend strength and anticipate potential exhaustion points before a reversal occurs.
This guide provides the complete formula, clear interpretation rules, and practical strategies for integrating the ROC into your analysis today.
Key Takeaways
- The Price Rate of Change measures the percentage change in price from a previous period.
- Its main functions are to identify overbought/oversold conditions, spot divergences, and confirm trends.
- Unlike the RSI, the ROC uses a centerline at zero and is unbounded.
- The most fundamental signals are when the indicator crosses above the zero line or below it.
- Though powerful, this indicator can be choppy and give false signals.
1. What is the Price Rate of Change?
The Price Rate of Change (ROC) is a foundational momentum indicator used to measure the rate and strength of price changes over a specified look-back period. It provides one of the most direct and clear readings of underlying market momentum for technical analysis.(StockCharts, n.d.).
The sole purpose of this tool is to measure the percentage change in price over a specific time period. Put simply, it helps traders answer the question, “Is the price moving faster or slower now than before?”
Imagine a sprinter running a race. The ROC doesn’t just tell you if the sprinter is moving forward; it tells you if they are speeding up or getting tired and slowing down.
This is crucial for traders. An upward-sloping line suggests that the rate of price increase is accelerating, indicating strengthening momentum. A falling line is a warning sign that the trend is losing momentum and may be vulnerable to a reversal, impacting the ability to trade trends.
2. The ROC formula and calculation
This section details the straightforward formula used to calculate the Price Rate of Change (ROC), step by step guide to calculate and simple example.
2.1. The Rate of Change formula
The formula is designed to give traders a simple percentage that shows how much the price has changed over a specific lookback period. The standard formula for the Rate of Change is as follows:
ROC = [(Current Closing Price – Closing Price ‘n’ periods ago) / (Closing Price ‘n’ periods ago)] x 100
This calculation produces a line that oscillates above and below a central point at zero (Investopedia, n.d.).
The lookback period (n) you select is not arbitrary; it must directly align with your specific trading goals. Instead of guessing, use this cheat sheet to match the settings to your style:
| Trading Style | Recommended Timeframe | Suggested ROC Period | Trade-off (Pros & Cons) |
| Short-term / Day Trading | M5, M15, H1 | 7 – 14 | Fast & Noisy: Reacts instantly to price changes but generates frequent false signals. |
| Swing Trading | H4, Daily | 14 – 36 | Balanced: The “Sweet Spot” for most traders. Offers a good mix of signal stability and speed. |
| Position / Trend Trading | Daily, Weekly | 36 – 200 | Smooth & Slow: Excellent for filtering out market noise, but signals often appear late (lagging). |
💡 Pro Tip:
If you are unsure, start with the standard 12 or 14-period setting on a Daily chart. This is the industry default and provides the most reliable baseline for learning.
2.2. The calculation process in simple steps
Let’s simplify that calculation into three easy-to-follow steps.
Step 1: First, it gets the current price
The indicator takes the most recent closing price of the asset traders are analyzing.
Step 2: Then, it looks back in time
It finds the closing price from ‘n’ periods ago. The ‘n’ is the only setting traders need to worry about, with a common default being 12 or 14 periods. A shorter lookback period increases its volatility and sensitivity. So on a daily chart, it would look at the price from 12 days ago.
Step 3: Finally, the percentage change is calculated
The difference between the new and old price is taken, divided by the old one, and then converted to a percentage through multiplication by 100. A positive outcome places the ROC line above its central point, which signifies an uptrend. A negative result means the ROC line is below its central point, indicating bearish momentum.
2.3. A simple example
To illustrate, let’s calculate a 12-period for a hypothetical stock and its holding period.
| Day | Closing Price | Price 12 Days Ago | Calculation | Resulting ROC |
| … | … | … | … | … |
| Day 13 | $105 | $100 (Price on Day 1) | [($105 – $100) / $100] x 100 | +5.00 |
| Day 14 | $108 | $101 (Price on Day 2) | [($108 – $101) / $101] x 100 | +6.93 |
| Day 15 | $109 | $105 (Price on Day 3) | [($109 – $105) / $105] x 100 | +3.81 |
Notice how the ROC rose from +5.00 to a peak of +6.93 on day 14, showing that bullish momentum was accelerating strongly.
However, on day 15, even though the price made a new high at $109, the ROC fell sharply to +3.81. This is a classic example of bearish divergence, a powerful early warning that despite the new high price, the momentum behind the trend is weakening significantly.
2.4. How to add ROC indicator on TradingView & MT4
Getting the Price Rate of Change on your chart is simple and takes just a few clicks:
- On TradingView: Click the “Indicators” tab on the top toolbar, type “Rate of Change” in the search bar, and select the built-in “Technical” version.
- On MT4 / MT5: Navigate to Insert > Indicators > Custom, and select ROC (or look under Oscillators).
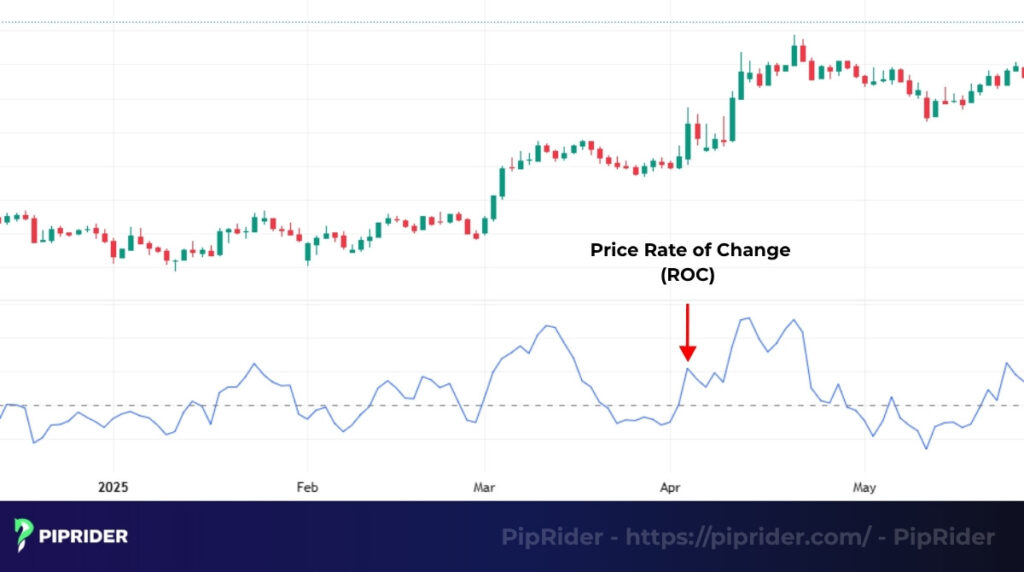
Note: Once added, you will see the line oscillating around a Zero Line (0) in a separate panel. This baseline represents 0% change, visually displaying the formula calculated above.
3. How to use the ROC in trading
With the mechanics understood, let’s move to the practical part. Interpreting signals from the ROC indicator is how this tool becomes a powerful analytical asset. The ROC provides four key signals, and it is crucial to understand what each one is telling traders about market momentum.
3.1. Zero line crosses
Zero-line is the dividing wall between positive (bullish) and negative (bearish) momentum. The crossover of this line is the most fundamental signal the ROC provides.
- A move above the zero line signals a bullish trend, showing that current prices are higher than they were previously.
- A move below the zero line signals a bearish trend, indicating that sellers are gaining control.
A word of caution: This signal is most reliable for confirming new trends, not for trading choppy, ranging markets which can produce many false signals.
3.2. Overbought and oversold conditions
This is where the ROC differs from bounded oscillators. Unlike the RSI or the DeMarker Indicator, which have clear predefined thresholds (like 0 to 1 or 0 to 100), the ROC is unbounded. Traders have to determine these levels for themselves based on historical volatility.
- To do this, traders must look at the historical data for the specific asset they are trading. Look back and see what extreme levels the ROC has reached in the past before reversing. These historical extremes become their custom overbought and oversold zones.
- The signal is not when the ROC enters an extreme zone, but when it begins to turn back and exit that zone. This indicates that the extreme momentum is starting to fade.
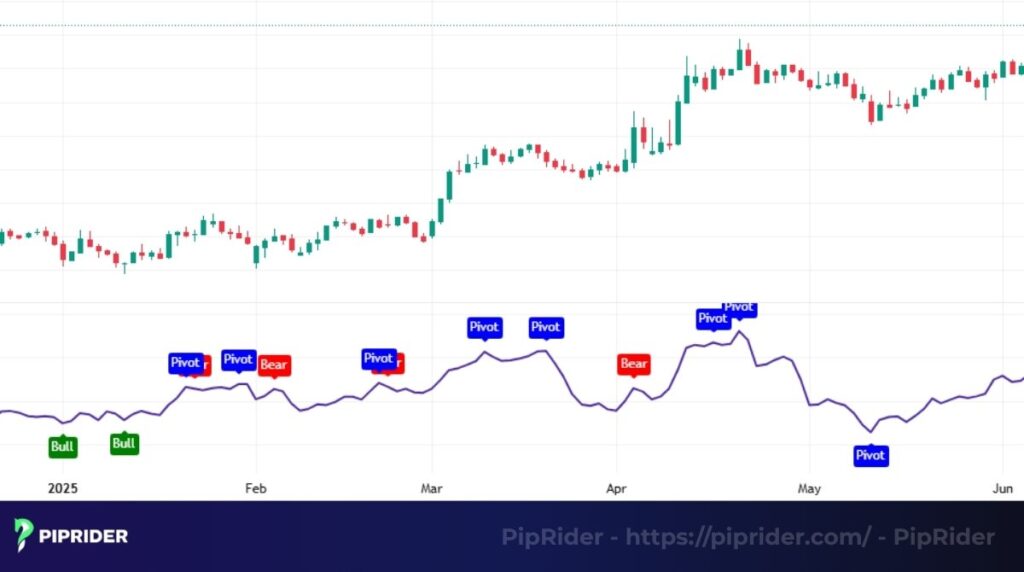
3.3. Divergences
Divergence is a popular concept used to spot potential reversals. It occurs when the direction of the price disagrees with the direction of the ROC (e.g., Price rises, but ROC falls).
Important Warning: While useful, divergence is not a precise timing signal. In strong trends, divergence can persist for a long time, meaning the price can continue to make new highs for days or weeks even while momentum is fading.
- The Rule: Treat divergence only as a “yellow traffic light” (prepare to stop), not a red light. Never trade on divergence alone; always wait for confirmation (such as a break of market structure, a trendline break, or a moving average crossover) before entering a trade.
The divergence signals:
- Bearish divergence forms when the price on the chart forges a new high, while the ROC indicator simultaneously fails to do so, creating a lower high instead. This is a major red flag, suggesting that even though the price looks bullish, the bullish momentum behind the move is weakening significantly.
- Bullish divergence happens when the price makes a new low, but the ROC makes a higher low. This tells you that selling pressure is becoming exhausted, even as the price is falling.
3.4. Breakout confirmation
The ROC is an excellent tool for helping traders distinguish between a genuine breakout and a frustrating “fakeout”. A legitimate price breakout should be validated by a strong increase in momentum.
- When traders see the price break resistance levels, glance down at the ROC. Is the line also surging upwards and making a new high? If so, that’s a strong confirmation that the breakout has real power behind it.
- If the price breaks out but the indicator is flat or falling (a form of divergence), traders should be extremely cautious. This often signals a lack of conviction that can lead to a quick reversal.
4. Pro Tip: using ROC Alerts & Scanners (TradingView)
Constantly staring at charts waiting for a signal is exhausting. Instead, efficient traders automate this process. Here is how you can use TradingView to let the market notify you when a setup is ready.
4.1. Setting a simple ROC Alert
The most basic use case is getting notified when momentum shifts from bearish to bullish.
- Step 1: Add the ROC indicator to your TradingView chart.
- Step 2: Right-click on the ROC line and select “Add Alert on ROC”.
- Step 3: Set the condition to “Crossing Up” and the value to “0”.
- Result: You will now receive a pop-up or email instantly when the momentum turns positive, so you never miss a zero-line crossover.
4.2. A basic Momentum Scanner (Forex & Crypto)
If you want to find assets that are already trending and showing strong momentum, use the Stock/Crypto Screener tab at the bottom of TradingView.
A simple “Strong Uptrend” Filter:
- Price: Above the 50-day SMA (Filters for uptrend).
- Rate of Change (12): Above 0 (Filters for positive momentum).
- Exchange: Select your preferred market (e.g., Forex or Crypto).
This simple filter instantly removes thousands of weak assets, giving you a short, high-quality list of potential buy candidates to analyze.
5. Price Rate of Change strategy in Forex
An indicator is only valuable when it’s part of a well-defined forex trading strategy. A strategy provides rules for entry, exit, and risk management, which is what separates disciplined trading from gambling. Let’s walk through two simple yet effective strategies that traders can use as a starting point for incorporating the ROC indicator into their own trading.
5.1. Strategy 1: The trend-following zero-line crossover
The trend-following zero-line crossover is a classic trend-following strategy. Its goal is to use the ROC’s most basic signal to join a trend that has just confirmed its momentum.
The logic: Use a long-term moving average (like the 200 EMA) to define the overall market price direction. Then only take ROC signals that align with that primary trend, filtering out low-probability counter-trend signals.
The rules for a buy trade:
- Trend filter: The price must be trading above the 200 EMA, and the EMA should be sloping upwards.
- The entry trigger: Wait for the ROC to move from below the zero-line to above it.
- Entry: Enter a buy trade at the open of the next candle after the indicator has confirmed its cross.
- Stop loss: Place your stop loss below the most recent swing low.
- Take profit: Set the profit target at a key resistance level visible on the chart, or use a fixed risk-to-reward ratio, for example, 1:1.5 or 1:2.
The rules for a sell trade (Short Setup):
- Trend filter: The price must be trading below the 200 EMA, and the EMA should be sloping downwards, confirming the market is in a downtrend.
- The entry trigger: Wait for the ROC to cross from above the zero-line to below it.
- Entry: Enter a short trade at the open of the next candle after the indicator has confirmed its cross.
- Stop loss: Place your stop loss just above the most recent swing high.
- Take profit: Set the target at the nearest key support level, or use a fixed risk-to-reward ratio (e.g., 1:1.5).
5.2. Strategy 2: The divergence reversal
The divergence reversal is a more advanced strategy aimed at catching potential trend shifts.
💡 Pro Tip:
Traders who struggle with timing these reversals often combine ROC with the Schaff Trend Cycle to identify precise cycle turning points.
The logic: Looking to spot a clear disagreement between price and momentum at a logical turning point on the chart, such as a key support or resistance level.
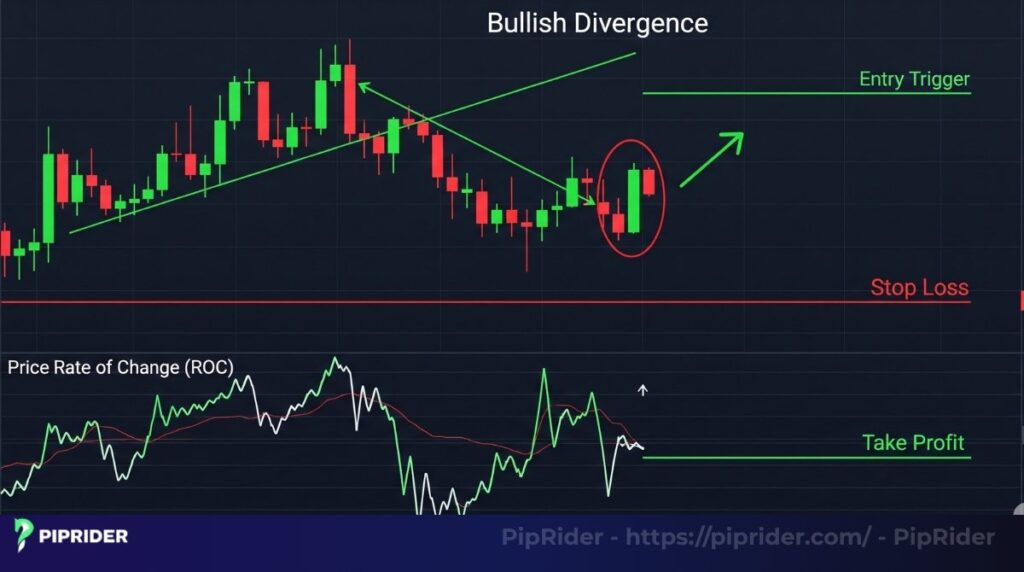
The rules for bullish reversals (buy trade):
- Spot the divergence: Look for an instance where price creates a new lower low, but the ROC indicator prints a higher one at the same time.
- Price action confirmation: Confirmation is a crucial step. Wait for a strong candle to form, using pattern recognition to confirm the move (e.g., a pin bar or a bullish engulfing pattern). This indicates that buyers are stepping in.
- Entry: Enter a long trade after the strong candle has closed.
- Stop loss: Place the stop loss just below the absolute low of the move.
- Take profit: Since this is a strategy to catch a reversal, a logical first target would be the nearest significant resistance level where the asset might struggle.
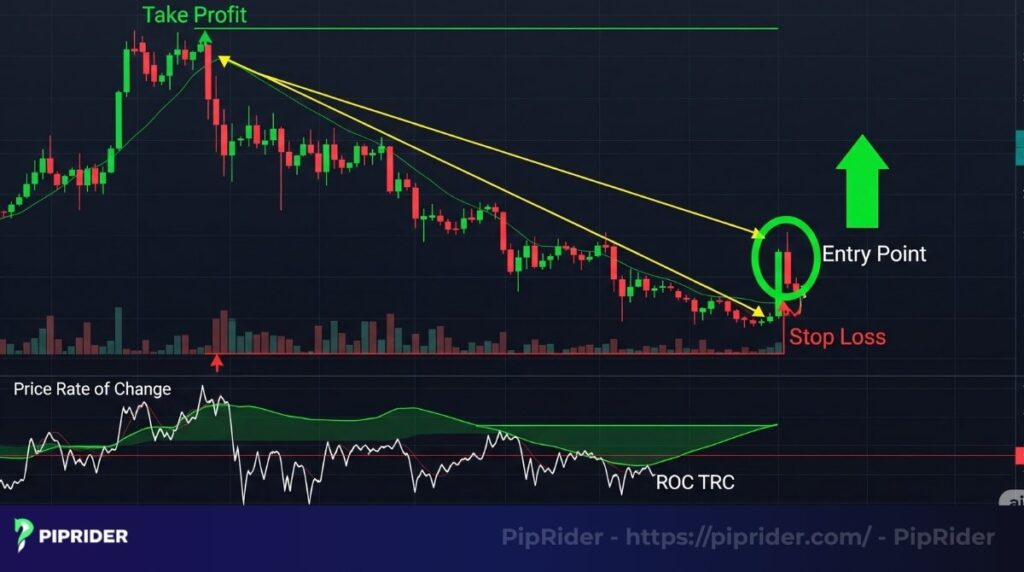
The rules for bearish reversals (Sell Trade):
- Spot the divergence: Look for an instance where price creates a new Higher High, but the ROC indicator prints a Lower High at the same time. This defines a Bearish Divergence.
- Price action confirmation: This is non-negotiable. Wait for a strong bearish candle pattern, such as a Shooting Star or a Bearish Engulfing, to confirm that sellers have seized control.
- Entry: Enter a short trade immediately after the confirmation candle closes.
- Stop loss: Place the stop loss strictly above the absolute high of the setup.
- Take profit: Target the nearest significant support zone where the price might bounce.
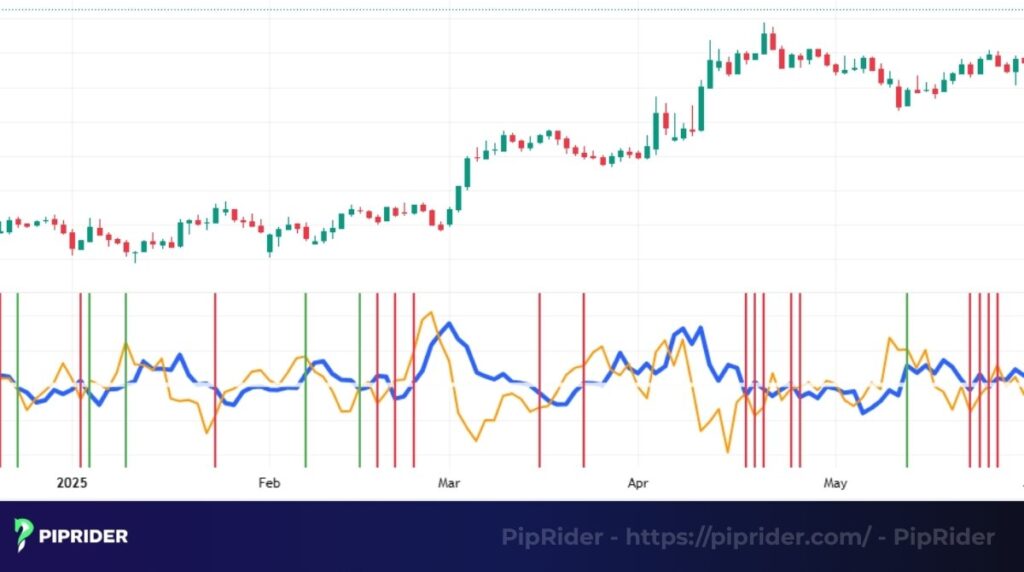
6. ROC vs. other momentum indicators
The world of momentum indicators is crowded. The best way to understand their roles is to see them side-by-side. The ROC is a pure, direct measure of price change, while others like the True Strength Index (TSI) add layers of smoothing to filter out market noise. Keep in mind that the ROC, while fast, can be choppy.
| Feature | ROC (Rate of Change) | RSI (Relative Strength Index) | MACD (Moving Average Convergence Divergence) |
| What it Measures | Raw percentage change in price over a set period. | The speed and magnitude of price changes (gains vs. losses). | The relationship between two Moving Averages (Trend & Momentum). |
| Centerline | Zero Line (0) | 50 Line | Zero Line (0) |
| Scale | Unbounded (Can go infinitely high/low). | Bounded (0 to 100). | Unbounded. |
| Primary Use | Spotting raw momentum bursts & Divergence. | Identifying Overbought (70) & Oversold (30) conditions. | Confirming trend direction & strength via crossovers. |
| Behavior | Fast & Choppy: Very sensitive to price noise. | Smoother: Internal formula smooths out the noise. | Slowest & Smoothest: Lagging but very stable. |
| Best For | Traders who want an unfiltered, direct view of speed. | Traders looking for clear reversal zones (tops & bottoms). | Trend followers looking for confirmation of a major move. |
7. Frequently asked questions about Price Rate of Change
8. Summary
In trading, understanding a trend’s direction is only half the battle; knowing its strength is the other half. The Price Rate of Change (ROC) indicator provides a simple and unfiltered way to measure that strength, acting as a true speedometer for market momentum.
While it can be prone to choppiness, its power lies in its simplicity. By using its zero-line crossovers to confirm trends and its divergence signals to warn of potential reversals, you can add a valuable layer of analysis to your trading.
This guide has given you the foundation. The next step is to apply this knowledge, backtest a strategy, and see how this classic indicator can enhance your trading. To continue learning, you might want to explore the True Strength Index (TSI) if you prefer a smoother momentum tool, or browse our full best technical indicators category here on Piprider.


