
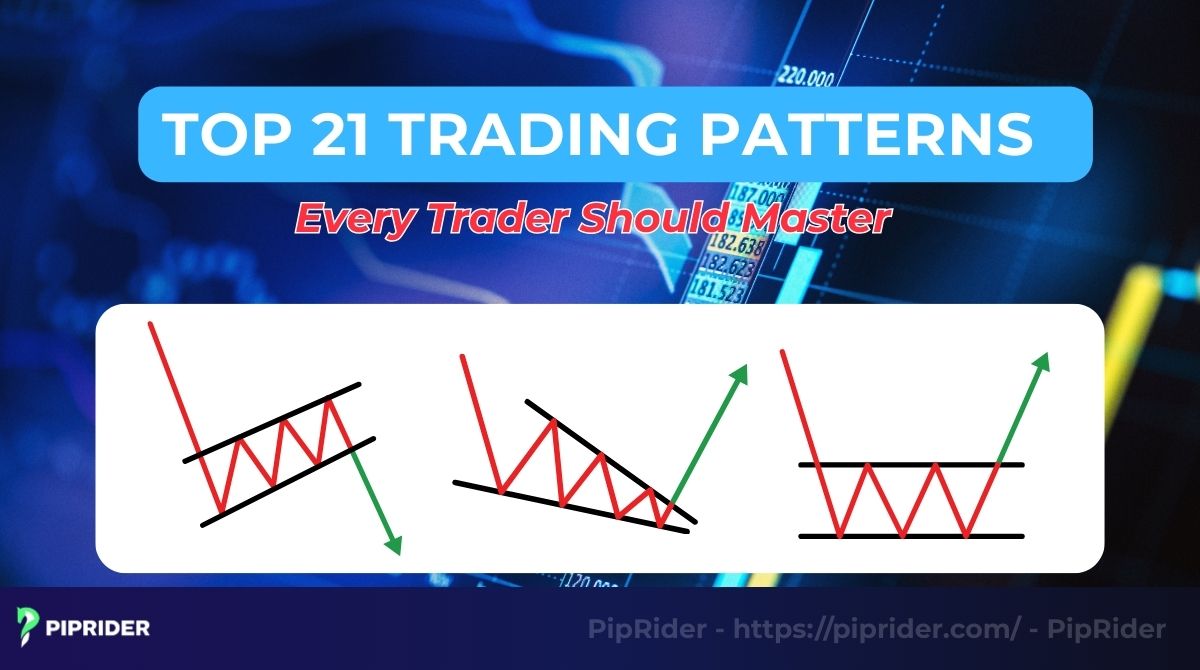
Many traders look at the chart and feel they’re telling a story, but they don’t always know how to read the language. That language is made up of trading patterns. These are recurring shapes that reflect market psychology, often signaling where the price might move next.
This complete guide for 2026 breaks down the most essential chart patterns, from simple triangles to complex structures, giving a trader a clear roadmap to improve their technical analysis and identify powerful trading signals.
Key Takeaways
-
Visual Roadmap: Trading patterns are visual formations used to forecast price movements based on historical psychology.
-
Three Main Types: They are primarily categorized as continuation (trend resumes), reversal (trend changes), or bilateral (indecision) patterns.
-
Best Market Condition: These patterns generally perform best in trending markets with high liquidity. Trading them during low-volatility “chop” or tight ranges often leads to failure.
-
Risk Warning: Every chart pattern can produce false signals, making confirmation (like volume) and stop-loss placement essential.
-
Confluence: Success rates increase significantly when patterns are combined with other factors like Volume, RSI, or MACD.
1. What Are Trading Patterns?
In technical analysis, trading patterns (or chart patterns) are recognizable shapes and formations on a price chart that are believed to predict future market trends. They are a visual representation of the battle between buyers and sellers and the collective psychology of the market.
The study of these formations is a cornerstone of classic price action analysis, with roots going back over a century. The core idea is that these price configurations are not random; they are recurring shapes created by human behavior that have proven to be statistically relevant over time.
Traders across forex, stocks, and crypto use share market chart patterns for several key reasons:
- To identify opportunities: Patterns like the Head and Shoulders or double tops can signal a potential trend reversal, offering clear entry and exit price points.
- To manage risk: The structure of a pattern provides logical places to set stop-loss orders, helping to define and control risk.
- To add confluence: A trading pattern can confirm a signal from another indicator, increasing a trader’s confidence in a setup. Ultimately, the most successful traders find that using chart patterns alongside trend analysis provides a more comprehensive view of market direction.
2. Types of Trading Chart Patterns
Chart patterns are typically classified into three main categories, based on the price action they predict.
Comparison of Trading Pattern Types
| Feature | Continuation Patterns | Reversal Patterns | Complex Patterns |
| Core Signal | Signals a temporary pause; the original trend is likely to resume. | Signals the current trend is losing momentum and may change direction. | Often signal major turning points or specific conditions; harder to identify. |
| Where It Forms | In the middle of an established trend (during a pullback). | At the end of a prolonged trend (at a market top or bottom). | Can form in various market conditions, often over longer periods. |
| Common Examples | Flags, Pennants, Triangles | Head and Shoulders, Double Top/Bottom, Wedges | Harmonic Patterns, Elliott Waves, Diamond Tops |
2.1. Continuation Patterns
These chart patterns suggest that after a brief pause or consolidation, the market’s prevailing trend will likely continue in its original direction. They are essentially “breather” periods within a larger trend, offering traders an opportunity to join the move. Triangles are a great example of this.
| Pattern Name | Signal / Bias | Confirmation | Best Timeframe |
| 1. Ascending Triangle | Bullish | Breakout of Resistance | H4, Daily |
| 2. Descending Triangle | Bearish | Breakout of Support | H4, Daily |
| 3. Symmetrical Triangle | Neutral / Breakout | Breakout Direction | H1, H4 |
| 4. Bullish Flag | Bullish | Break upper trendline | M15, H1 |
| 5. Bearish Flag | Bearish | Break lower trendline | M15, H1 |
| 6. Bullish Pennant | Bullish | Break upper trendline | M15, H1 |
| 7. Bearish Pennant | Bearish | Break lower trendline | M15, H1 |
| 8. Falling Wedge | Bullish (Continuation) | Break upper trendline | H4, Daily |
| 9. Rising Wedge | Bearish (Continuation) | Break lower trendline | H4, Daily |
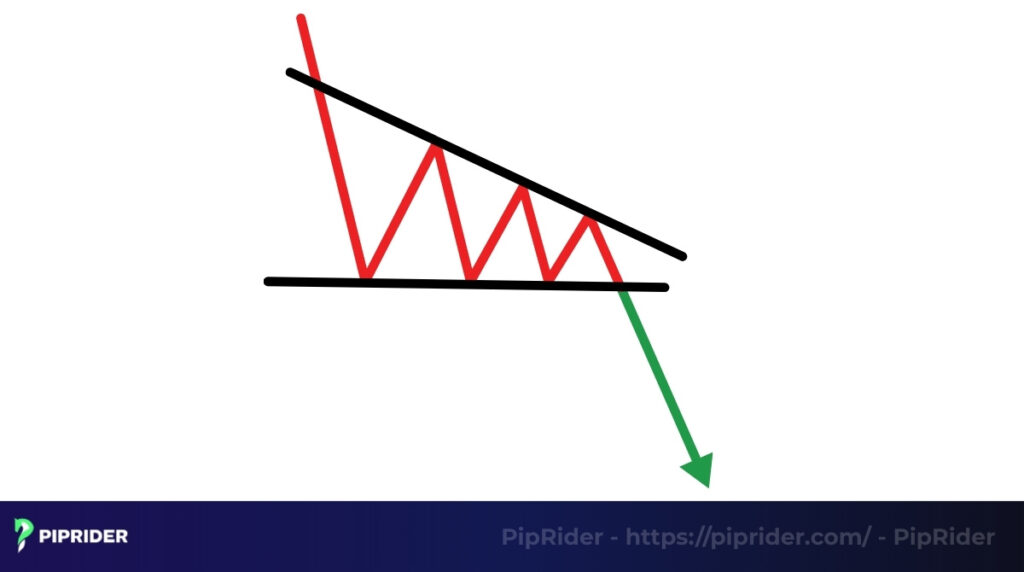
2.1.1. Triangles (Ascending, Descending & Symmetrical)
Triangles are one of the most common chart patterns, formed by converging trendlines that represent a coiling of energy before a potential breakout. An Ascending Triangle, with its flat top and rising bottom, is generally a bullish signal. It is formed by two distinct trendlines. The Symmetrical Triangle has two converging trendlines, signaling indecision, but often results in a breakout that continues the prior trend.
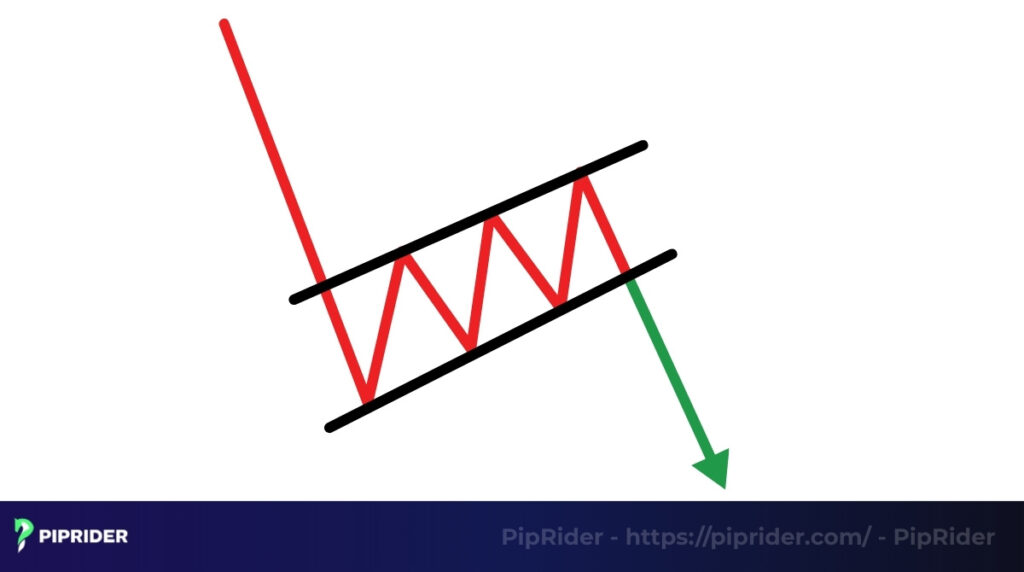
2.1.2. Bullish & Bearish Flags
Bullish flag patterns appear in uptrends, while bearish patterns like the bearish flag appear in downtrends before the trend powerfully resumes. The “flag” itself is a small, rectangular consolidation that slopes against the primary trend, representing a brief and orderly period of profit-taking.
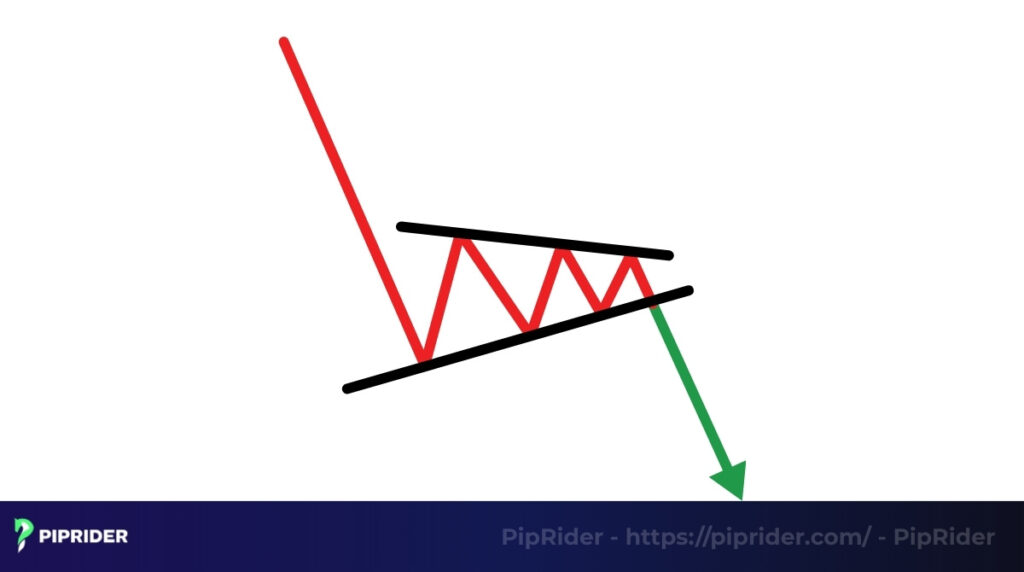
2.1.3. Pennants
Pennants are very similar to flags, also appearing after a strong “flagpole” move. The key difference is that the consolidation phase of a pennant forms a small symmetrical triangle, not a rectangle. Like a flag, it represents a brief pause and a buildup of energy before the trend continues.
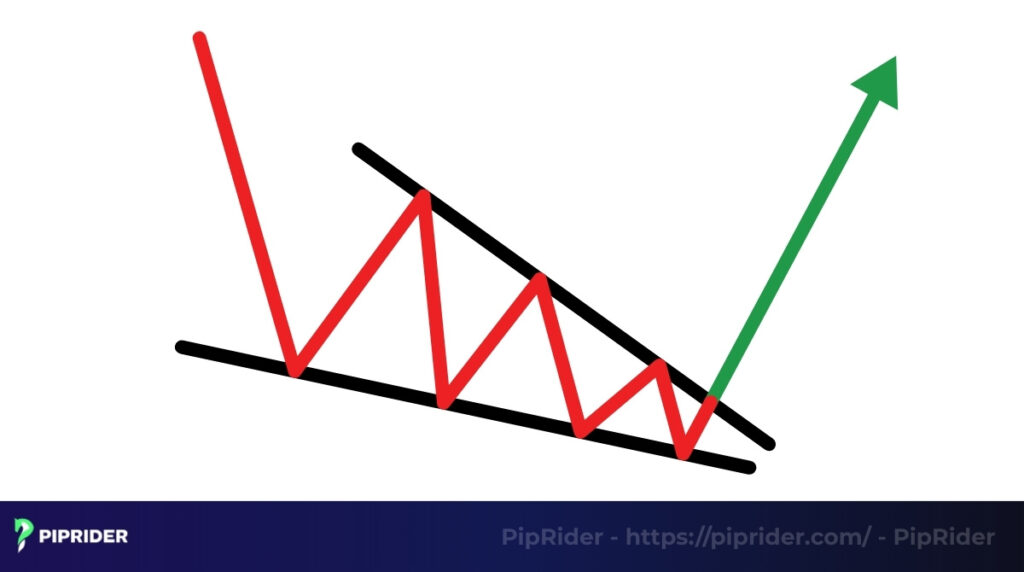
2.1.4. Wedge Patterns (as continuation)
While wedges can also be reversal patterns, they often act as continuation signals. A wedge has two converging trendlines that both slope in the same direction. A classic example is a falling wedge that appears during a larger uptrend; it shows that the downward correction is losing momentum and the original buyers are likely to take control again.
2.2. Reversal Patterns
In contrast to continuation patterns, reversal patterns signal that a prevailing trend is losing momentum and may be about to change direction. These formations are crucial for spotting potential market tops and bottoms, also known as trend reversals.
| Pattern Name | Signal / Bias | Confirmation | Best Timeframe |
| 10. Double Top | Bearish | Break Neckline Support | H4, Daily |
| 11. Double Bottom | Bullish | Break Neckline Resist. | H4, Daily |
| 12. Triple Top | Bearish | Break Support | Daily, Weekly |
| 13. Triple Bottom | Bullish | Break Resistance | Daily, Weekly |
| 14. Head & Shoulders | Bearish | Break Neckline | H4, Daily |
| 15. Inv. Head & Shoulders | Bullish | Break Neckline | H4, Daily |
| 16. Rounding Bottom | Bullish | Break out of Curve | Weekly |
| 17. Rounding Top | Bearish | Break out of Curve | Weekly |
| 18. Cup and Handle | Bullish (Reversal context) | Break Handle/Rim | Daily, Weekly |
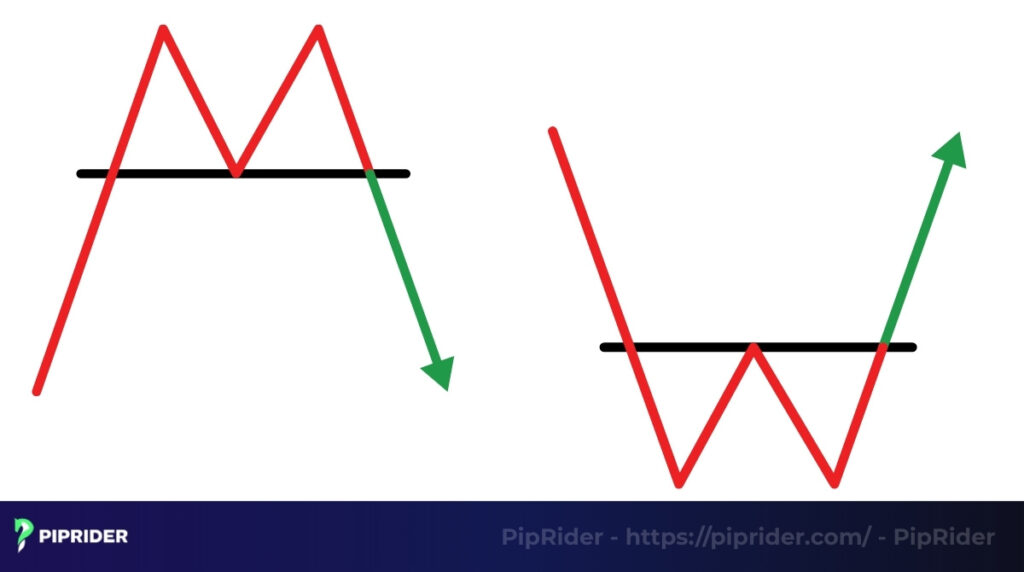
2.2.1. Double Top & Double Bottom
These double tops are classic and very common reversal patterns. A double tops pattern forms an “M” shape after an uptrend, showing two failed attempts to break resistance levels. Conversely, a double bottoms pattern forms a “W” shape after a downtrend, showing two strong rejections of key support levels. Both signal a likely trend reversal once the pattern’s “neckline” is broken.
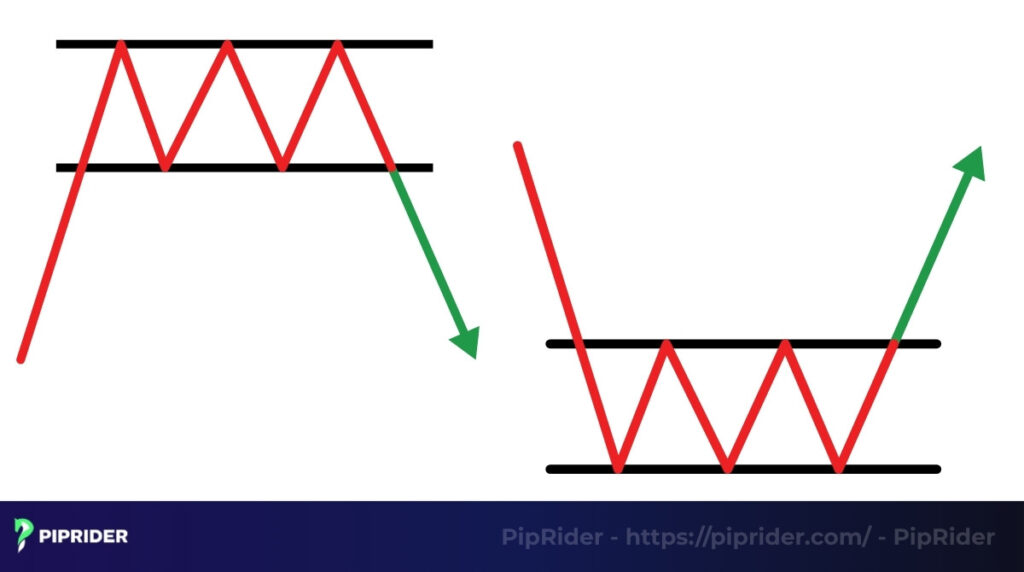
2.2.2. Triple Top & Triple Bottom
As the names suggest, these are more powerful and reliable variations of the double patterns. A Triple Top or Triple Bottom involves three failed attempts to break a key level of resistance or support. This triple rejection makes the signal even stronger, indicating a very decisive shift in market control.
2.2.3. Head and Shoulders (and Inverse)
This is one of the most reliable reversal patterns in technical analysis. The standard Head and Shoulders is a bearish pattern with three peaks, where the middle peak (the “head”) is the highest. Its bullish counterpart, the Inverse Head and Shoulders, has three troughs, with the middle trough being the lowest. Both signal a potential major trend change upon the breakout of the neckline.
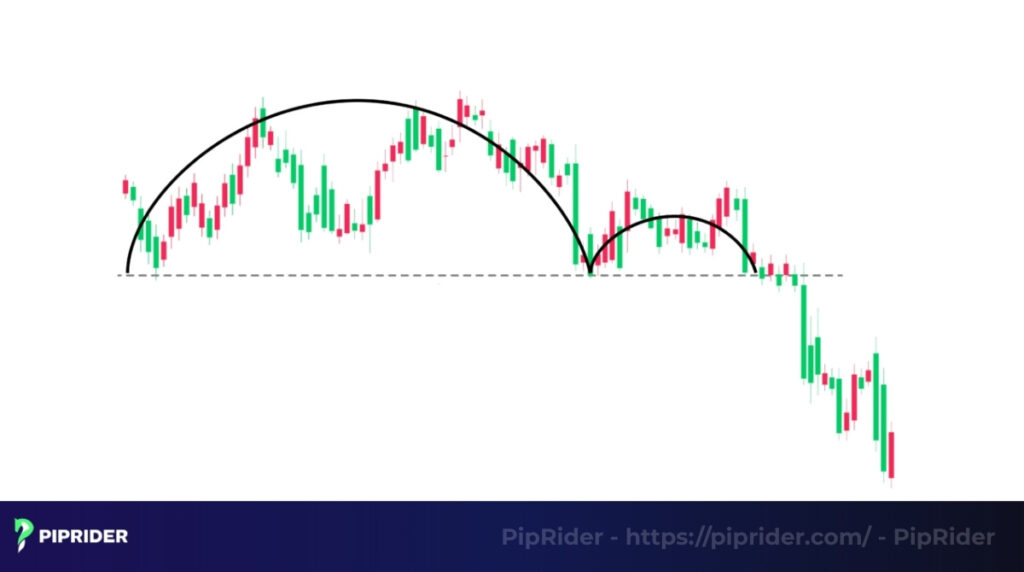
2.2.4. Rounding Top & Bottom
These patterns, also known as “saucers” or “bowls,” illustrate a very slow and gradual shift in market sentiment. They form distinct curves that signal a change in momentum. A Rounding Bottom forms a long, U-shaped curve at the end of a downtrend, signaling a slow transition from sellers to buyers. A Rounding Top is the bearish opposite.
2.2.5. Cup and Handle (as a Reversal)
While typically a continuation pattern, a Cup and Handle can also act as a powerful reversal signal when it forms at the end of a long downtrend. In this context, it represents a significant bottoming formation and a period of accumulation before a potential new uptrend begins.
2.3. Complex & Other Patterns
Beyond the standard continuation and reversal formations, traders will also encounter more complex or specialized chart patterns. These often require a higher level of experience to identify and trade effectively.
| Pattern Name | Signal / Bias | Confirmation | Best Timeframe |
| 19. Diamond Top/Bottom | Reversal | Break Diamond boundary | Daily |
| 20. Broadening Wedge | High Volatility | Breakout (High Vol.) | Daily |
| 21. Dead Cat Bounce | Bearish Continuation | Break low of bounce | Daily |
2.3.1. Diamond Top & Bottom
The Diamond Top (bearish) and Diamond Bottom (bullish) are rare but significant reversals. They typically form after a strong trend and represent a period of high volatility and indecision, creating a diamond-like shape on the chart before a reversal occurs.
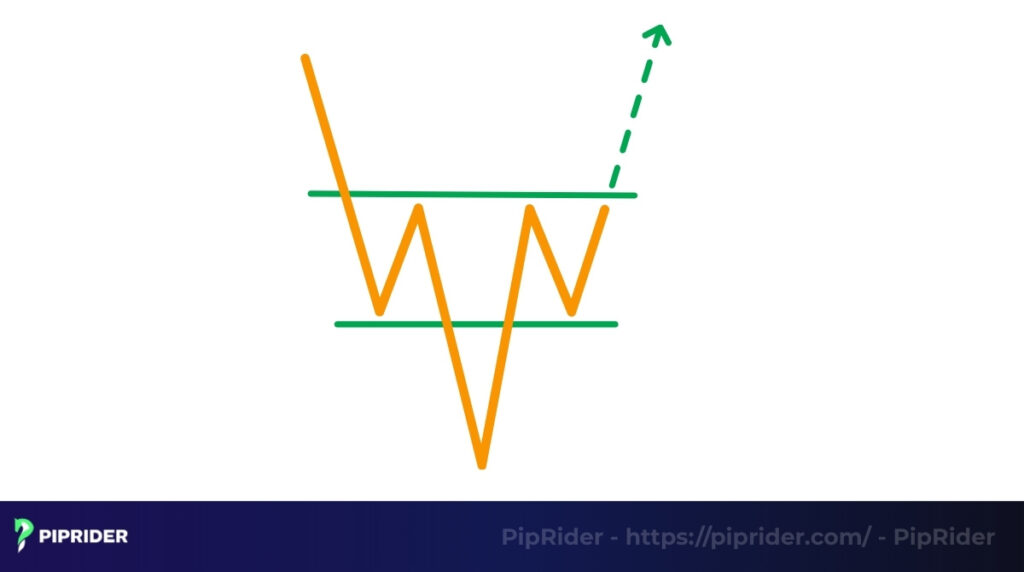
2.3.2. Price Channel Patterns
A Price Channel forms when the price is contained between two parallel, sloping trendlines. An ascending channel is generally bullish, while a descending channel is bearish. Traders often trade the “swings” within the channel or look for a breakout from the channel as a major signal.
2.3.3. Broadening Wedge (Megaphone)
Also known as a Megaphone pattern, the Broadening Wedge shows expanding volatility as the price makes a series of higher highs and lower lows. This pattern signals increasing uncertainty and can lead to a powerful breakout, though it often acts as a reversal pattern.
2.3.4. Parabolic Curve
A Parabolic Curve represents a powerful but unsustainable trend that accelerates rapidly, with price increases getting larger and larger. While incredibly profitable for those already in the trend, this pattern almost always ends in a sharp and dramatic reversal or crash.
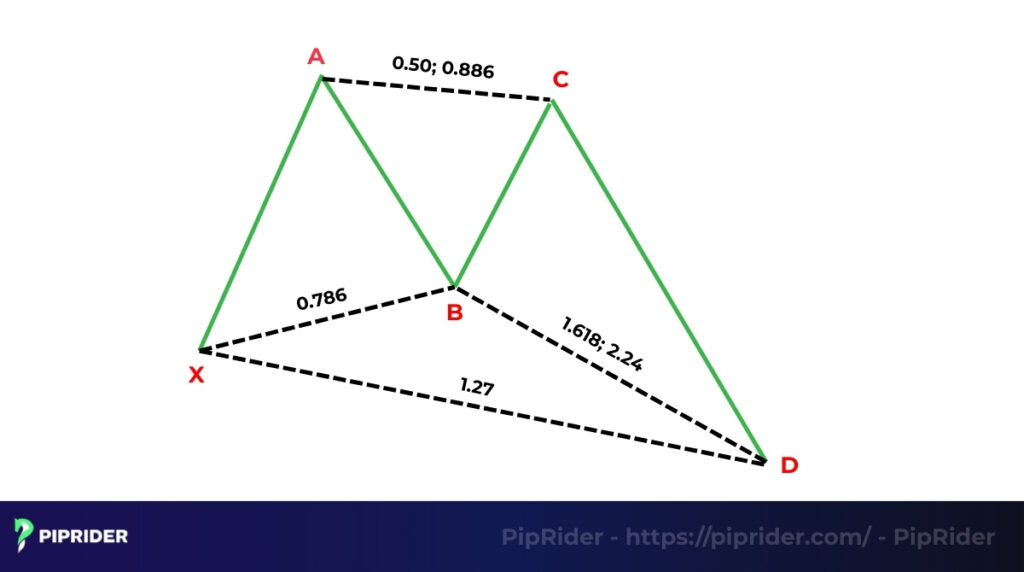
2.3.5. Harmonic Patterns (Gartley, Butterfly…)
Harmonic patterns, such as the Gartley or Butterfly, are complex five-point reversal structures based on specific Fibonacci ratios. They are used to identify precise Potential Reversal Zones (PRZs) and are a more advanced form of pattern trading.
2.3.6. Elliott Wave Theory & Three Drives
These are advanced theories that attempt to map out market cycles. Elliott Wave theory identifies trends and corrections in predictable wave structures (typically 5 waves up, 3 waves down). The Three Drives pattern is a simpler structure with three consecutive, symmetrical drives to a top or bottom.
2.3.7. Gap-Based Patterns (Island Reversal & Dead Cat Bounce)
An Island Reversal is a rare pattern where a trading session is completely isolated from the previous and following price movements by gaps, signaling a strong reversal. A Dead Cat Bounce is a temporary, failed recovery attempt after a major price decline, often followed by a continuation of the downtrend.
3. How to Trade Using Chart Patterns
Identifying a trading pattern is only the first step. The key to successfully trading them lies in a disciplined approach to confirmation, entry, and risk management. A well-defined trading strategy is essential for success.
3.1. Confirming a Pattern (Volume, Breakout, Retest)
A common mistake is trading a pattern before it is fully confirmed. This is particularly true for breakout patterns. To increase the probability of a trade, we look for these three key confirmation signals:
- Volume: A true breakout from a pattern should be accompanied by a significant increase in volume. High volume confirms strong conviction behind the move and reduces the chance of a false signal.
- The Breakout Candle: The breakout itself must be decisive. Look for a strong, full-bodied candle that closes clearly outside the pattern’s boundaries. A weak candle or a long wick signals hesitation.
- The Retest (Optional but Powerful): After a breakout, the price will often return to “retest” the level it just broke. A successful retest, where the price bounces off the old resistance (now acting as support), provides a high-probability secondary entry opportunity.
3.2. Entry and Exit Strategies
Once a chart pattern is confirmed, a trader needs a clear plan for execution. This involves defining your entry, your protective stop loss, and your profit target.
- Entry Strategy (Breakout vs. Early): The most common method is the breakout entry, where you enter after the price closes outside the pattern. A more aggressive early entry involves entering within the pattern in anticipation of the breakout, which offers a better price but carries higher risk.
- Stop Loss Placement: Your stop loss should be placed at a logical point where the pattern would be invalidated. For a bullish pattern (like a double bottom), this is typically just below the pattern’s low. For a bearish pattern, it’s just above the pattern’s high.
- Profit Target Calculation: Profit targets are often calculated using the “measured move” technique: measure the height of the pattern at its widest point and project that distance from the breakout point. Alternatively, traders use Fibonacci extension levels.
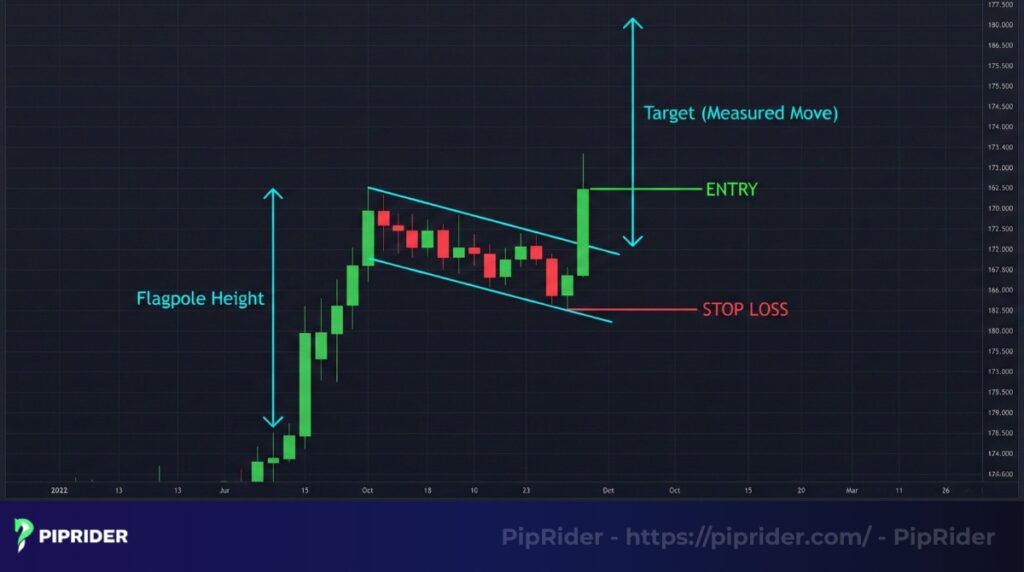
3.2.1. Practical Example: Trading a Continuation Pattern (Bullish Flag)
Let’s apply the rules above to a classic Bullish Flag setup. This pattern works best when found in a strong, existing uptrend.
- The Setup: Look for a sharp, vertical price rally (The Flagpole), followed by a brief, downward-sloping consolidation channel (The Flag).
- The Trigger: Wait for a solid bullish candle to close above the upper trendline of the flag. Warning: Do not enter if the breakout candle has a long upper wick.
- The Execution:
- Entry: Place a buy order slightly above the high of the breakout candle.
- Stop Loss: Place it just below the lowest point of the flag structure (Support).
- Target (Take Profit): Measure the height of the flagpole and project that distance upwards from the breakout point. This usually offers a favorable Risk:Reward ratio of 1:2 or better.
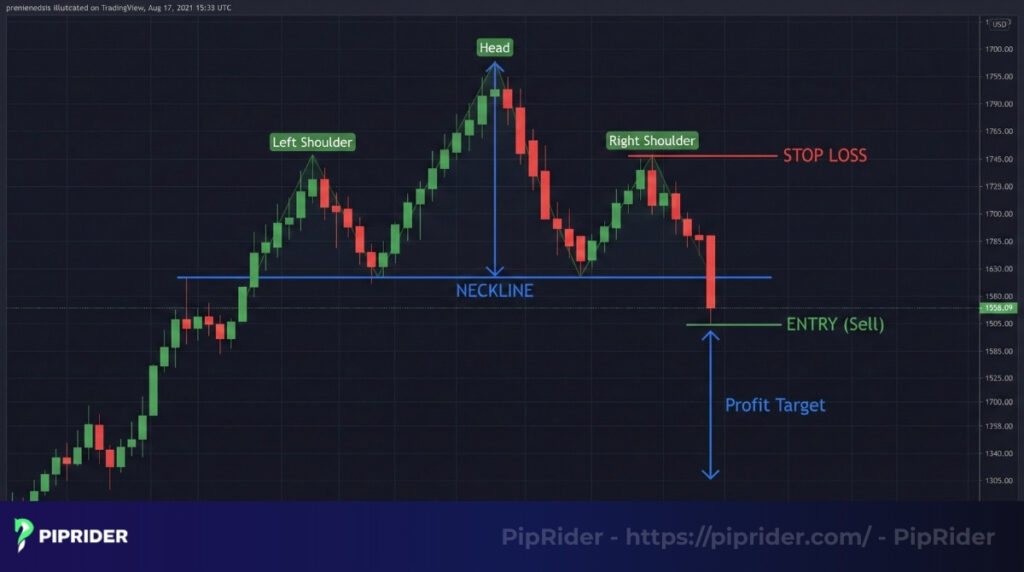
3.2.2. Practical Example: Trading a Reversal Pattern (Head and Shoulders)
Now, let’s look at how to trade a market top using the Head and Shoulders pattern. This setup requires patience as we are betting against the prevailing uptrend.
- The Setup: Identify three distinct peaks. The middle peak (Head) must be the highest, flanked by two lower peaks (Shoulders) at roughly the same height. Draw a “Neckline” connecting the lows of the shoulders.
- The Trigger: Wait for a decisive breakout candle to close below the Neckline. This confirms the reversal.
- The Execution:
- Entry: Place a sell order (Short) just below the low of the breakout candle.
- Stop Loss: Place it just above the Right Shoulder. Tip: Placing it above the Head is safer but often ruins the Risk:Reward ratio.
- Target: Measure the vertical distance from the Head to the Neckline, then project that distance downwards from the breakout point.
3.3. Best Time Frames for Chart Patterns
A general rule is that chart patterns are more reliable on higher timeframes. The longer the timeframe, the more significant the pattern, as it reflects the actions of more market participants.
- Intraday Trading (1-Hour, 15-Minute Charts): Trading patterns on lower timeframes is possible but requires more caution. While patterns form more frequently, they are susceptible to “market noise” and false breakouts. Success here requires quicker reactions and stricter risk management.
- Swing Trading (Daily, Weekly Charts): This is where chart patterns are most powerful. On daily and weekly charts, patterns represent major shifts in supply and demand. Their breakouts are often more sustained and reliable.
4. Advantages and Limitations of Trading Patterns
Like any tool, chart patterns have distinct strengths and weaknesses. A successful trader understands both.
4.1. Advantages
The popularity of chart patterns stems from several key strengths:
- Visual and intuitive nature: Many chart patterns are easy to identify visually, making them accessible for new traders.
- Defined trade parameters: They offer a clear framework for a trade, providing logical entry points, stop-loss levels, and profit targets.
- Confluence with other indicators: Patterns become more reliable when confirmed by other tools like the RSI or a specific moving average crossover chart pattern, allowing for a high-confidence trading approach.
4.2. Limitations
However, traders must also be aware of the inherent drawbacks of pattern trading:
- Risk of false breakouts: The most significant drawback is the risk of a “false breakout,” where the price moves beyond the pattern’s boundary only to quickly reverse. This often happens at key resistance levels.
- Subjectivity in interpretation: While some patterns are clear, others can be subjective. Two traders might look at the same chart and draw a pattern’s trendlines differently.
- Reliance on confirmation: Patterns are rarely strong enough to be traded in isolation and are most effective when confirmed by other factors, like a surge in volume.
5. Tools to Help You Find Patterns Efficiently
Scanning for patterns manually across dozens of charts can be exhausting and prone to error. Instead of relying solely on your eyes, utilize modern trading tools to automate the detection process.
- Chart Pattern Indicators: Platforms like TradingView now offer built-in indicators (e.g., “All Chart Patterns”) that automatically highlight valid formations like Wedges or Flags on your chart. This acts as a great “second opinion” for beginners.
- Market Scanners: Use screeners to filter for specific conditions. For example, you can set a filter for “Price crossing 50-day MA” or “High Volatility” to narrow down the list of assets that are likely forming breakout patterns.
- Price Alerts: Don’t stare at the screen waiting for a breakout. Set a Price Alert on the trendline of a triangle or flag. You will be notified instantly on your phone when the price breaks out, allowing you to enter the trade at the perfect moment.
Note: While these tools are powerful, they are not infallible. Always use your own analysis to confirm the validity of any pattern detected by software.
6. Frequently Asked Questions (FAQs)
7. Conclusion
Trading patterns are powerful and essential tools in technical analysis, providing a visual framework for understanding market psychology and identifying high-probability entry and exit points. While powerful, their reliability increases significantly when chart patterns are combined with confirming indicators and a strict risk management plan.
As with any of these trading strategies, we strongly advise that you thoroughly backtest and practice identifying these patterns on a demo account before applying them to a live trading environment.
To continue mastering this skill and discover more high-probability setups, we encourage you to explore our in-depth guides in the Forex Chart Patterns category on Piprider.


