In trading, a single reason is rarely enough to risk capital. Professional traders look for multiple, independent factors that all point to the same conclusion. The powerful technique is known as confluence in trading. This guide will teach you how to build a powerful confluence strategy, moving from simple single-signal trading to a more robust, multi-factor approach for identifying high-probability setups.
Key Takeaways
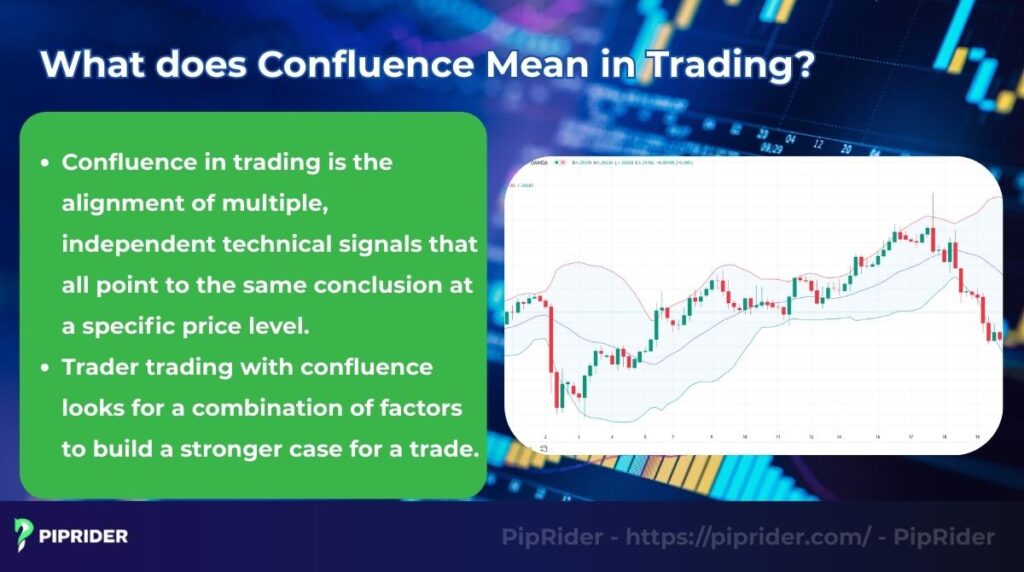
- Confluence in trading is the alignment of multiple, independent technical or fundamental analysis factors at the same price level.
- An area of confluence significantly increases the probability of a trade setup by confirming a signal from different perspectives.
- Key components include support/resistance, trendlines, chart patterns, indicators, and Fibonacci levels.
- While powerful, the main risk is “analysis paralysis” from using too many conflicting indicators.
1. What does Confluence Mean in Trading?
Confluence in trading is the alignment of multiple, strictly independent analytical factors that all point to the same trade idea at a specific price level. Instead of relying on a single technical trigger, professional traders look for a convergence of evidence to build an undeniable case for entry.
For example, a classic area of technical confluence might occur where a major horizontal support level directly intersects with a rising daily trendline and a 61.8% Fibonacci retracement.
The primary importance of a confluence strategy is that it increases the probability of a successful trade by acting as a strict filter against low-quality setups. However, true confluence requires combining factors from different categories (e.g., a key price level + market structure + timing + a fundamental catalyst).
Simply stacking three different momentum oscillators (like RSI, MACD, and Stochastic) on your chart does not increase your odds; it merely repeats the same data and creates a false sense of security. Real confluence relies on strictly independent confirmation (Murphy, 1999).
Psychologically, a confluence zone represents an area on the chart where different groups of market participants are all looking to execute at the exact same time. For instance, trend traders are buying the trendline, level-to-level traders are buying the horizontal support, and algorithmic systems are buying the Fibonacci retracement. When these diverse perspectives align, it creates a massive surge in liquidity and demand, triggering a highly explosive price reaction.
2. Confluence in Different Market Conditions
The factors that create a strong confluence setup can change depending on the current market environment. A successful trader knows how to adapt their technical analysis to different conditions.
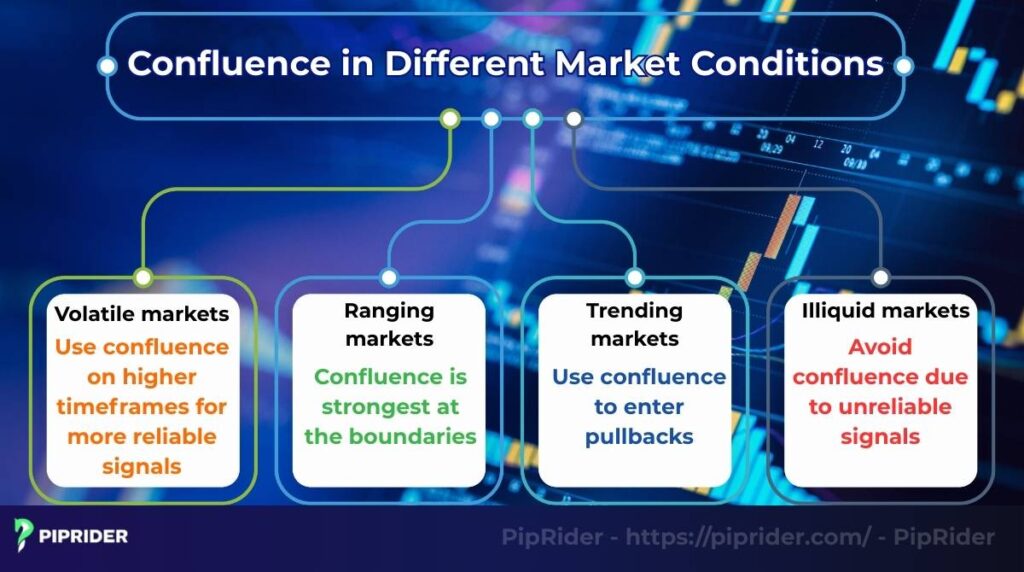
- In highly volatile markets, prices can easily overshoot key levels. Therefore, confluence becomes even more critical. Traders should look for wider confluence zones and prioritize signals from higher timeframes, as they are less affected by short-term noise.
- In a range-bound market, the most powerful confluence occurs at the boundaries of the range. A trader looks for a combination of horizontal support/resistance, an overbought/oversold Relative Strength Index (RSI) reading, and a clear reversal candlestick pattern to confirm a trade at the edge of the range.
- In a trending market, confluence is used to find low-risk entry points during pullbacks. The ideal setup is where a Fibonacci retracement level, a key moving averages, and a rising trendline all intersect, providing a high-probability zone to rejoin the trend.
- Traders should be extremely cautious when applying confluence in low-volume or illiquid markets (e.g., during holidays or overnight sessions). Signals can be unreliable, and price movements can move erratically. It is often best to avoid trading confluence setups during these periods.
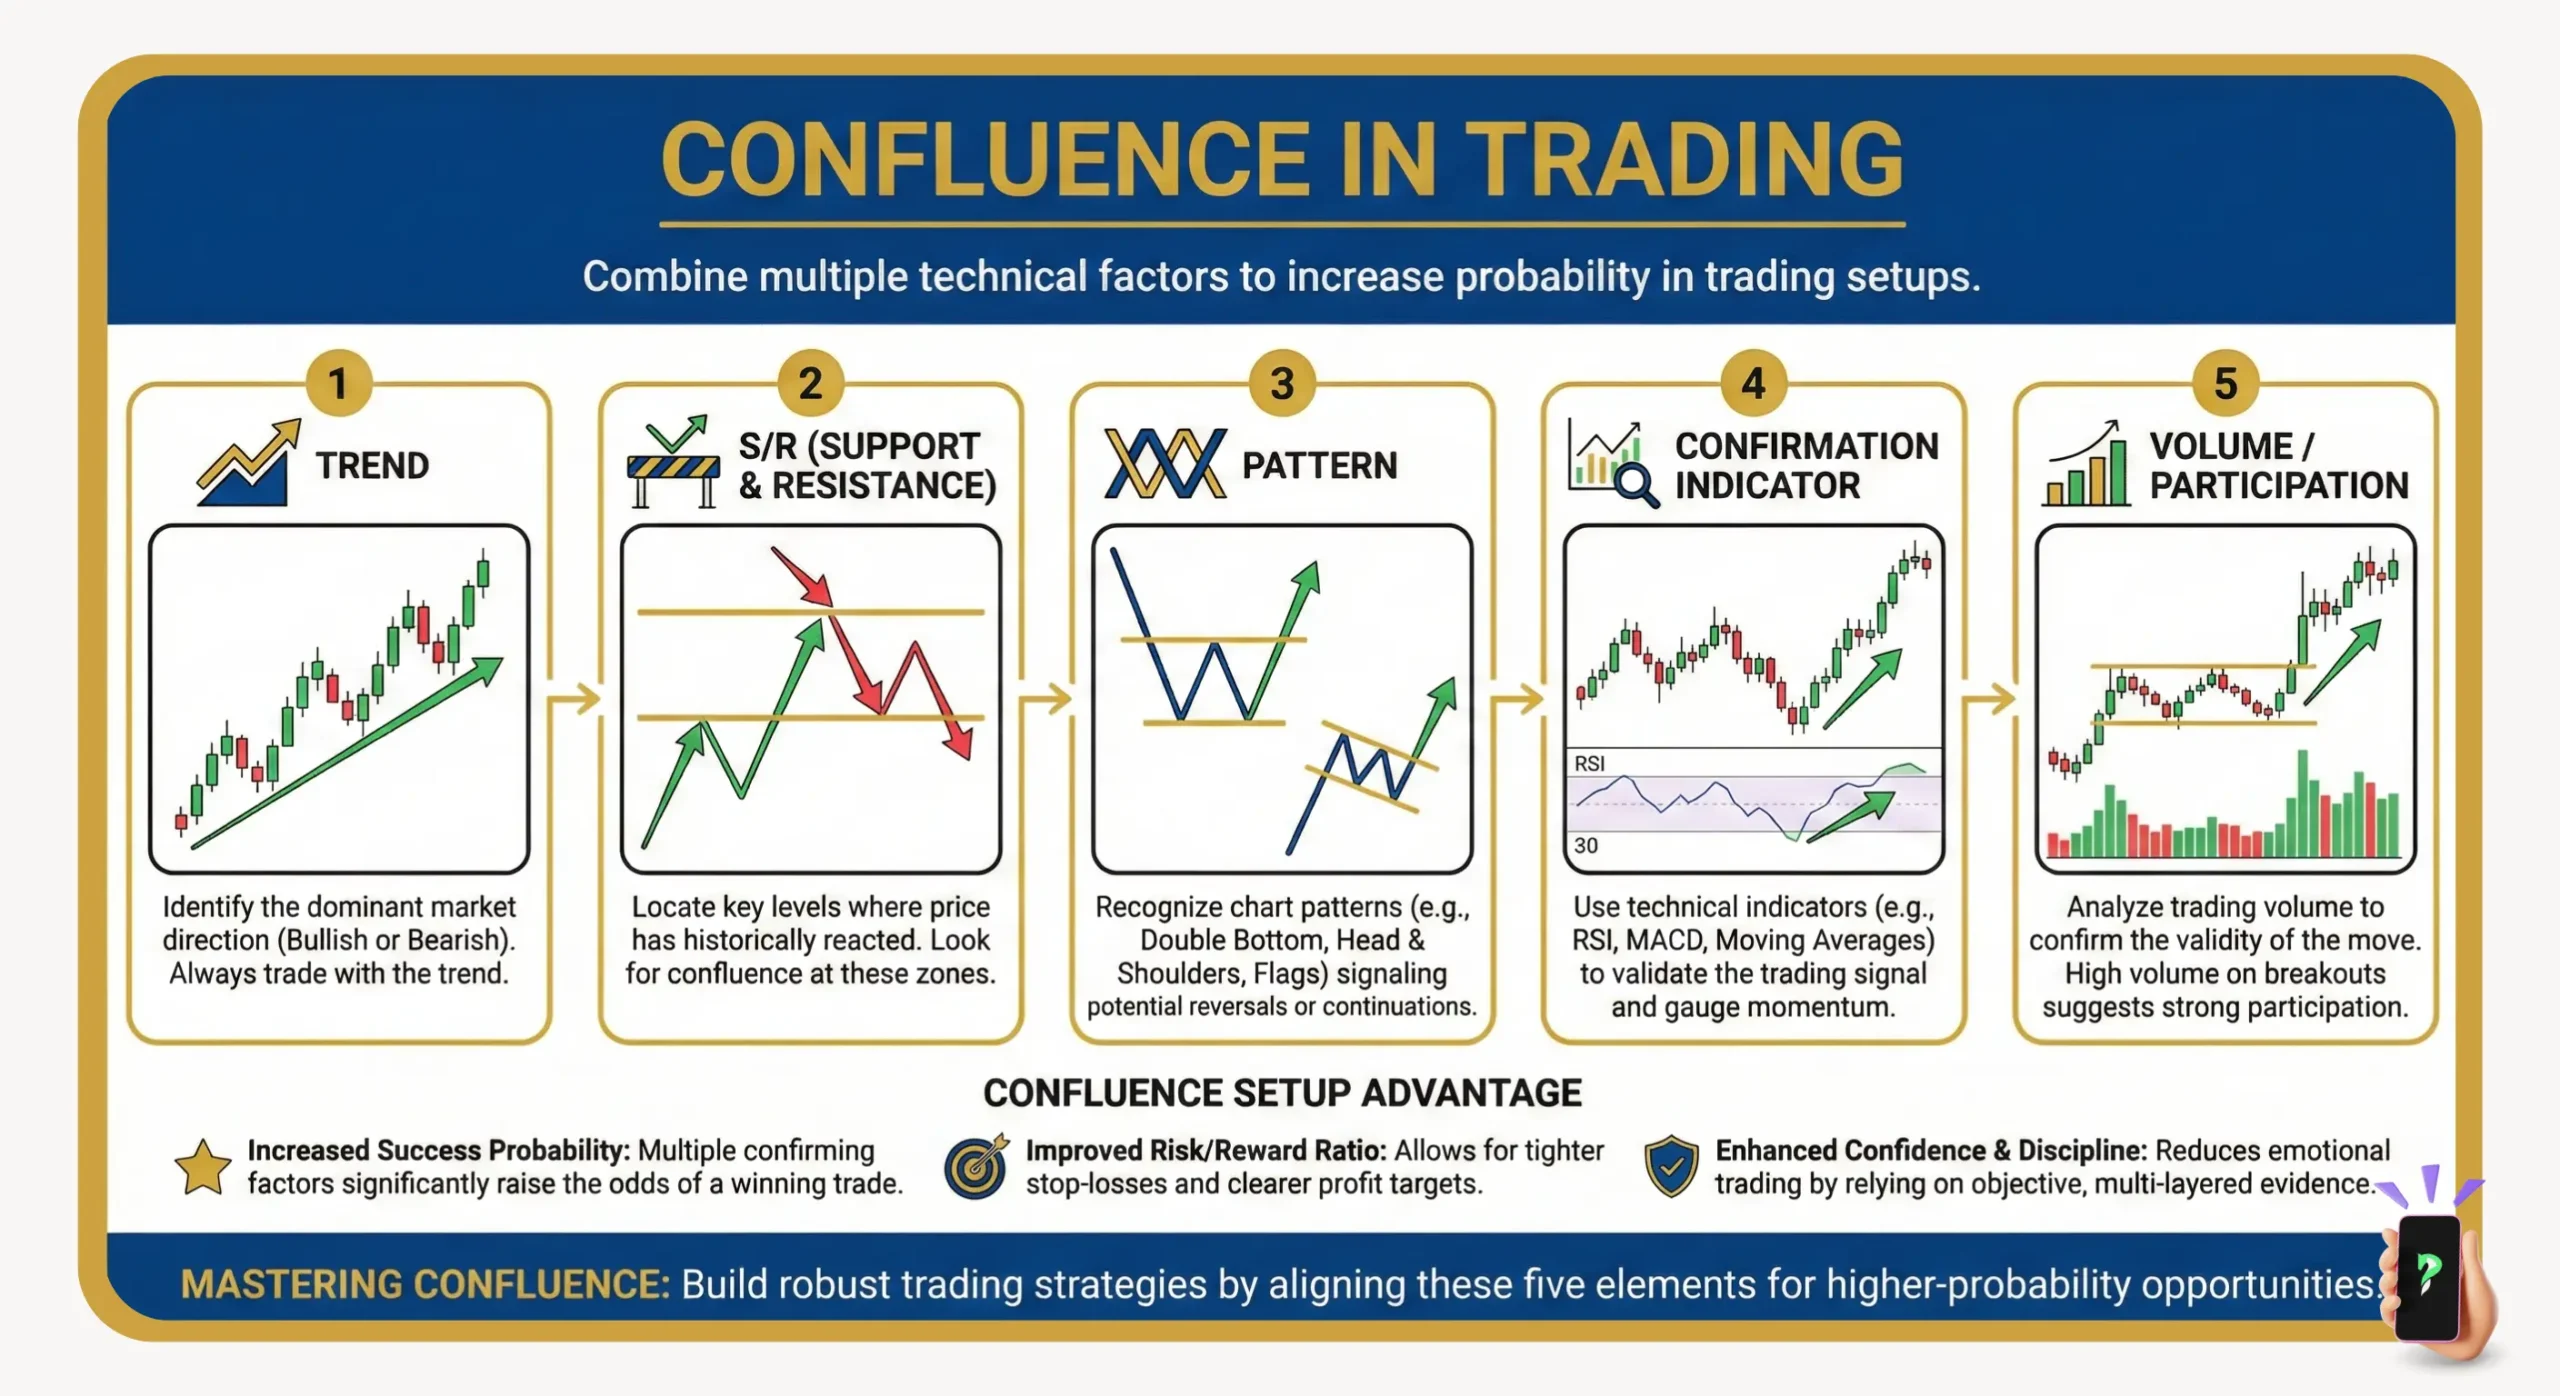
3. Key Components of Confluence in Trading
A powerful strategy is built by “stacking” several components, including chart patterns, support/resistance levels, and signals from technical indicators. The more independent factors that align, the higher the probability of the setup.
3.1. Indicator Signals (RSI, DMI, ATR, etc.)
Indicators help quantify momentum or volatility shifts, adding mathematical weight to a confluence setup. However, remember the golden rule: do not stack correlated oscillators. Instead of using RSI and MACD together, pair one momentum indicator with a completely different tool.
For example, when the price tests a major daily support level, look for:
- Momentum Confirmation: The RSI shows bullish divergence (price makes a lower low, but RSI makes a higher low), indicating selling pressure is exhausting.
- Volatility Confirmation: The Average True Range (ATR) begins to expand, confirming that new buyers are aggressively stepping in.
Furthermore, for trend strength confirmation, many experienced traders also incorporate the Directional Movement Indicator (DMI) or ADX. This tool helps distinguish between a strong trend and a sideways market, adding a critical “Market Regime” layer of verification to your confluence checklist without falling into the multicollinearity trap.
3.2. Chart and Candlestick Patterns
These trading patterns visually represent the psychology of the market. A bullish engulfing candle or a double bottom pattern forming at a key level provides a clear signal that buying pressure is overwhelming selling pressure, adding a strong reason to consider a long trade.
3.3. Support and Resistance Levels
Key horizontal support levels or resistance levels are often the “anchor” of a confluence setup. These are static, high-probability zones where the price has reacted in the past (BabyPips, n.d.). Finding other signals that align at these pre-defined levels is the essence of building a confluence trade.
3.4. Trend Analysis and Breakouts
Professional traders often say “the trend is your friend.” A buy setup is significantly stronger if it aligns with an established uptrend. A breakout from a consolidation pattern in the direction of the primary trend is a classic example of confluence, as it combines the pattern’s signal with the market’s overall momentum.
3.5. Higher Timeframe Analysis
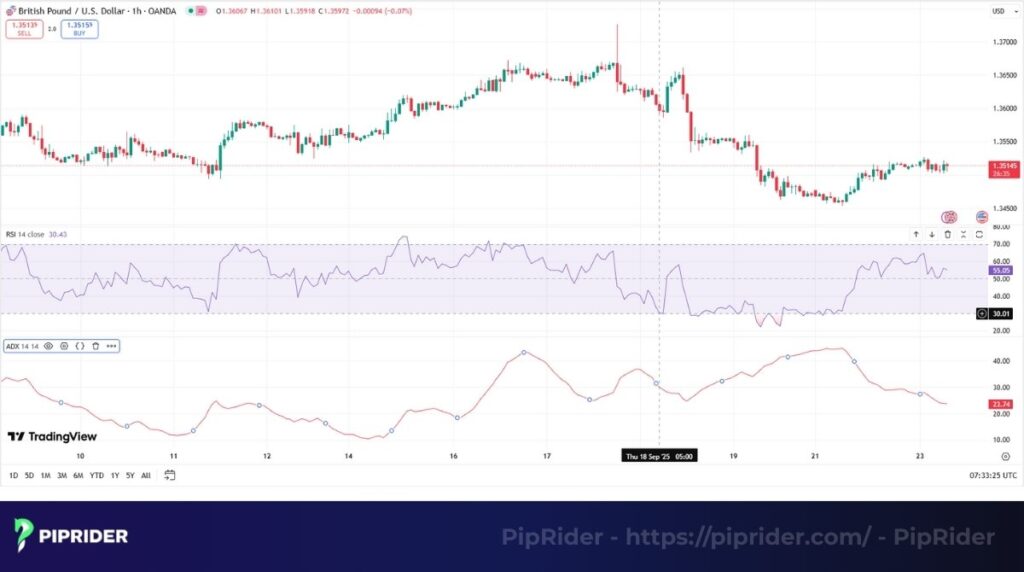
A “top-down” analysis involves a trader first identifying a key level or trend on a higher timeframe (like the daily chart). They then zoom in to a lower timeframe (like the 1-hour chart) to look for a specific entry signal at that major level. This ensures the short-term trade is aligned with the bigger picture.
3.6. Correlation Between Multiple Markets
Using intermarket analysis is a more advanced technique. For example, a trader looking to sell the AUD/USD (a commodity-linked currency) might gain confidence if the price of key commodities like copper and iron ore are also showing weakness. This provides an additional layer of confirmation.
3.7. Combining Technical and Fundamental Analysis
Combining technical analysis and fundamental analysis creates some of the most powerful trade setups. For instance, if a central bank announces a surprise interest rate hike (fundamental), and a currency pair subsequently forms a bullish breakout pattern at a key technical level (technical), the confluence of both provides a very strong reason to buy.
3.8. Time of Day and Market Sessions
Signals that form during high-liquidity market sessions (like the London-New York overlap) are generally much cleaner and more reliable. In the decentralized Spot Forex market, it is crucial to understand that your broker’s “volume” indicator typically measures tick volume (a proxy measuring the number of price updates), not actual capital flow (OANDA, 2024).
Therefore, while a volume spike can be used as a secondary confirmation of activity, you should prioritize price action and session overlap (liquidity) to confirm the strength of a move, avoiding setups during quiet, erratic periods like the Asian session.
4. How to Use Confluence in Trading (A Step-by-Step Framework)
Using confluence effectively is not about randomly adding indicators; it’s a systematic process of building a strong, evidence-based case for each trade. This framework guides a trader on how to identify, plan, and execute a high-potential trade.
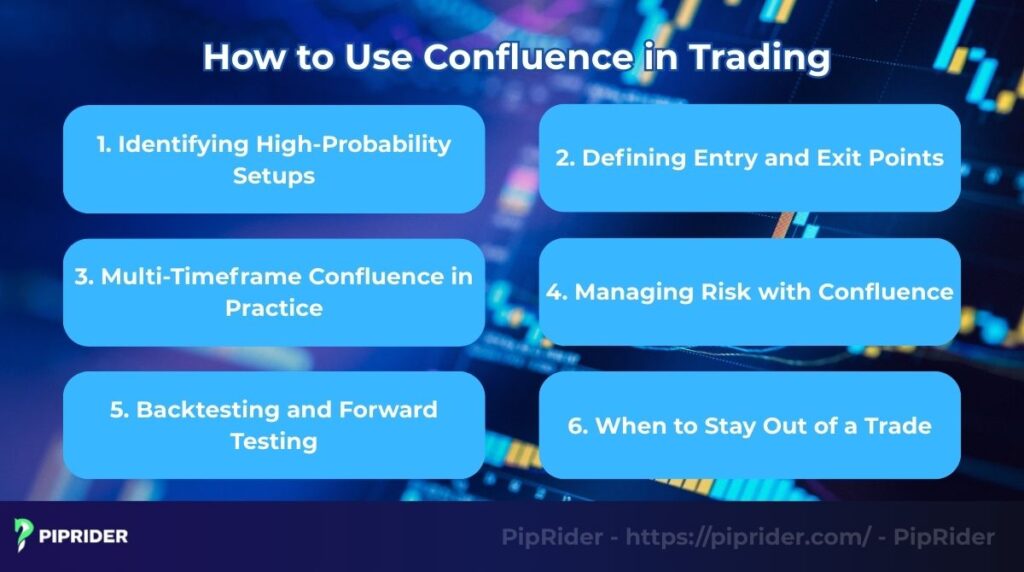
4.1. Identifying High-Probability Setups
A powerful strategy begins with a primary “anchor” signal. This is usually the most significant and reliable factor on the chart, typically a strong horizontal support or resistance level on a higher time frame. Once the anchor is found, the goal is to “stack” at least two other independent, confirming factors, which might include trendlines, Fibonacci levels, or specific indicators that align at that same price zone.
Ultimately, this layering of independent factors is the backbone of robust Forex trading strategies. By systematically combining candlestick patterns with key levels, you filter out market noise and focus exclusively on high-probability opportunities.
To ensure you are stacking odds correctly without falling into the multicollinearity trap, use this Confluence Scorecard. A high-probability setup must check boxes across strictly different categories:
| Category | Requirement | Professional Examples |
|---|---|---|
| 1. The Anchor (Mandatory) |
Higher Timeframe (HTF) foundation | Major HTF Support/Resistance, Weekly/Daily Trendline |
| 2. Market Regime (Choose 1) |
Directional bias | Price Structure (HH/HL), 50 EMA slope, ADX/DMI |
| 3. Confirmation (Choose 1-2) |
Independent filters | RSI/MACD divergence, Volatility expansion (ATR), Session alignment (London/NY) |
| 4. The Trigger (Mandatory) |
Entry execution | Decisive pin bar, Engulfing candle close, Break-and-retest |
| 5. Risk Plan (Mandatory) |
Capital protection | SL at structural invalidation, Minimum 1:2 R:R, 1% max risk |
4.2. Defining Entry and Exit Points
The confluence setup provides a clear, logical map for the trade.
- Entry: The entry is typically triggered by the final confirmation signal (e.g., the close of a pin bar).
- Stop-Loss: The stop-loss is placed at a logical invalidation point, just on the other side of the confluence zone.
- Take-Profit: A take-profit target should be set at the next major opposing level of market structure.
- Exit Points: The confluence setup also helps define your clear exit points so you can lock in gains or cut losses efficiently.
📋 The 6-Line Pre-Trade Template
To move from theory to flawless execution, professional traders condense their analysis into a strict checklist. Before you execute any trade, force yourself to fill out this 6-line template:
- 1. Context: (e.g., Daily uptrend / Range-bound / No high-impact news in the next 2 hours).
- 2. Anchor Level: (e.g., 4-Hour structural resistance turned support).
- 3. Confirmations (Different Types): (e.g., 1. Bullish MACD divergence + 2. Executing during the high-liquidity London session).
- 4. Trigger Rule: (e.g., Enter strictly on the close of a 15-minute bullish engulfing candle).
- 5. Stop-Loss (Invalidation): (e.g., Placed below the trigger candle’s wick + a 10-pip ATR/spread buffer).
- 6. Exit Strategy: (e.g., TP1 at the next major swing high, trail the remaining position behind the 20 EMA).
4.3. Multi-Timeframe Confluence (The “Top-Down” Drill)
Professional traders use the 3-Step Alignment Rule to find precision entries:
- Step 1: The Daily “Anchor” (Strategic View): Identify the major trend and mark your HTF support/resistance levels. This tells you where to look for a trade.
- Step 2: The 4-Hour “Filter” (Tactical View): Zoom in to see how the price is approaching the anchor (e.g., looking for a Fibonacci alignment or trendline touch).
- Step 3: The 15-Minute “Trigger” (Execution View): Wait for your specific candlestick trigger to close within the zone. This allows for a tighter stop-loss and a higher Risk-to-Reward ratio.
4.4. Managing Risk with Confluence
Confluence doesn’t just increase your win rate; it fundamentally improves your trading math. Because a multi-factor setup provides a highly specific, narrow zone for your structural stop-loss (compared to trading a vague, single indicator), it naturally allows for a tighter stop.
This tighter stop-loss distance is your biggest advantage. It enables you to use dynamic position sizing, meaning you can increase your actual lot size while still strictly risking only a predefined 1% to 2% of your account capital (Investopedia, n.d.). By mathematically fixing your risk per trade and leveraging the precise boundaries that confluence provides, you dramatically amplify your Risk-to-Reward (R:R) profile without exposing your portfolio to extra danger.
4.5. Backtesting and Validation
Before risking real capital, you must validate your framework. Do not rely on “gut feeling.” Use the 6-Line Template to clearly define your rules, then manually backtest historical charts to log at least 100 setups. Track your win rate and average risk-to-reward to ensure your strategy has a positive expectancy. Finally, forward-test on a demo account for 4-8 weeks to master your execution timing.
4.6. When to Stay Out (The “No-Trade” Zones)
A key part of a successful strategy is knowing when to sit on your hands. You should strictly avoid trading under these conditions:
- Forced Confluence: You only have one weak indicator but “convince” yourself to trade.
- Red-Folder Macro Events: Imminent high-impact news releases (e.g., NFP, CPI) that can destroy technical setups via liquidity sweeps.
- Poor Risk-to-Reward: Your logical Take-Profit is too close, resulting in an R:R of less than 1:1.5.
4.7. Case Study: Confluence in Forex vs. Crypto Markets
The principles of the confluence model are universal, but the specific “ingredients” that create a high-potential setup can vary by market.
Forex Example: A Reversal on EUR/USD
- The Anchor (Daily Chart): First, we identify a major psychological and horizontal support level at 1.0500 on the daily chart, where the price has reacted strongly in the past.
- Confirmation Signals (4-Hour Chart): As the price retests the 1.0500 area, we zoom into the 4-hour chart and find a rising trendline and the 61.8% Fibonacci retracement level aligning in the exact same zone, plus oversold RSI divergence.
- The Entry Trigger & Risk Plan: A clear 4H bullish engulfing candle forms, confirming institutional buyer interest at the confluence zone. Here is the exact execution plan:
- Entry: 1.0520 (Executing immediately at the close of the 4H engulfing candle).
- Stop-Loss: 1.0470 (Placed 30 pips below the 1.0500 anchor level to account for fake-outs and ATR buffer. This is our strict invalidation level).
- Take-Profit: 1.0620 (Targeting the next major 4H structural resistance, locking in a 100-pip gain for a clean 1:2 Risk/Reward ratio).
Crypto Example: A Breakout on Bitcoin (BTC/USD)
- The Anchor (Daily Chart): We identify a key horizontal resistance level on the daily chart that has rejected the price multiple times.
- Confirmation Signals (4-Hour Chart): As the price consolidates below this resistance, we see two confirming factors: the price is holding above the 50-period EMA (showing underlying strength), and a bullish ascending triangle chart pattern is forming.
- The Entry Trigger (4-Hour Chart): The entry is triggered on a decisive breakout candle that closes above the horizontal resistance, ideally on a spike in volume. (Note: When applying this breakout setup to Spot Forex, remember that volume is merely a tick volume proxy. Instead, prioritize confirmation through a decisive candle body close beyond the level, volatility expansion such as an ATR spike, and execution during a high-liquidity session). The stop-loss is placed below the recent swing low within the triangle.
5. Benefits of Using Confluence in Trading
Adopting a strategy requires more patience and analysis, but the benefits to a trader’s performance and psychology are significant.
- Increasing the accuracy of signals: By requiring multiple, independent signals to align, confluence acts as a powerful filter. It helps eliminate low-potential setups, allowing traders to focus only on trades that have a higher statistical likelihood of success.
- Reducing false breakouts: A common trading pitfall is the “false breakout.” Confluence helps mitigate this risk, especially in high-volatility environments. A breakout that is confirmed by a trendline touch, an independent momentum signal, and high volume (or a tick volume proxy / ATR volatility expansion if trading Spot FX) is far less likely to be a false move.
- Building confidence in trading decisions: Trading is a psychologically demanding activity. When a trader has a strong, multi-faceted case for entering a trade, it builds conviction. This confidence makes it easier to stick to the plan, manage the trade objectively, and accept the outcome, win or lose.
6. Common Mistakes to Avoid in Confluence Trading
While a multi-factor strategy is incredibly powerful, traders consistently fall into several classic traps. Being aware of these pitfalls is the difference between a robust, winning system and a drained account.
6.1. The Multicollinearity Trap (Stacking Correlated Signals)
This is the most common form of “analysis paralysis.” Traders often clutter their charts with indicators that measure the exact same data (e.g., stacking RSI, MACD, and Stochastic together). Since these are all momentum oscillators derived from the exact same closing prices, they will naturally generate the identical signals.
This does not increase your odds; it only creates an “illusion of confluence” and a false sense of security. A robust setup requires signals from strictly different categories (e.g., Price Level + Market Structure + Timing/Catalyst).
6.2. Waiting for “Perfect” Alignment (Late Entries)
In the pursuit of absolute safety, some traders wait for too many confirmations. By the time your anchor level, trendline, oscillator, moving average, and higher-timeframe candle close all align perfectly, the explosive move has already happened. You end up entering late with a terrible risk-to-reward ratio. Once your pre-defined 2-3 independent factors align and the trigger candle closes, execute without hesitation.
6.3. Trading Without a Hard Invalidation Level
A confluence zone doesn’t just give you a high-probability entry; it tells you exactly where your trade thesis is wrong. A fatal mistake is entering at a strong confluence zone but placing a random, arbitrary stop-loss (like a fixed 20 pips) or trading without one entirely.
If the price breaks and closes cleanly beyond your anchor level and structure, the confluence is dead. Your stop-loss must be a structural invalidation level. When it is hit, accept the loss and exit immediately.
6.4. Ignoring the Macro Context
A perfect technical confluence setup can still be easily destroyed if it goes blindly against the broader fundamental context. For example, a beautiful bullish technical setup on the EUR/USD is highly likely to fail if you buy right into a major US Non-Farm Payrolls (NFP) release that unexpectedly shows massive job growth. Always check the economic calendar to ensure no high-impact news will derail your technical setup.
6.5. Falling for Confirmation Bias
Confirmation bias is the psychological tendency to only look for information that justifies the trade you want to take. If a trader is eager to buy, they will actively search for bullish signals while completely ignoring glaring bearish divergences or broken support levels. To neutralize this emotional bias, force yourself to use the 6-Line Pre-Trade Template (from Section 4) to objectively assess all evidence before clicking buy or sell.
7. Frequently asked questions about confluence in trading
8. Conclusion
In conclusion, confluence in trading elevates a trader’s approach from simple signal-following to a systematic, probability-based process. By demanding multiple, independent reasons to enter a trade, a trader can significantly increase their odds of success and trade with greater confidence.
As with any new strategy, it is essential to test it thoroughly on a demo account before risking real capital. To continue building your trading system, we encourage you to explore more in-depth guides in our Trading Strategies & Forex Indicators category on Piprider.
Infographic Section
-
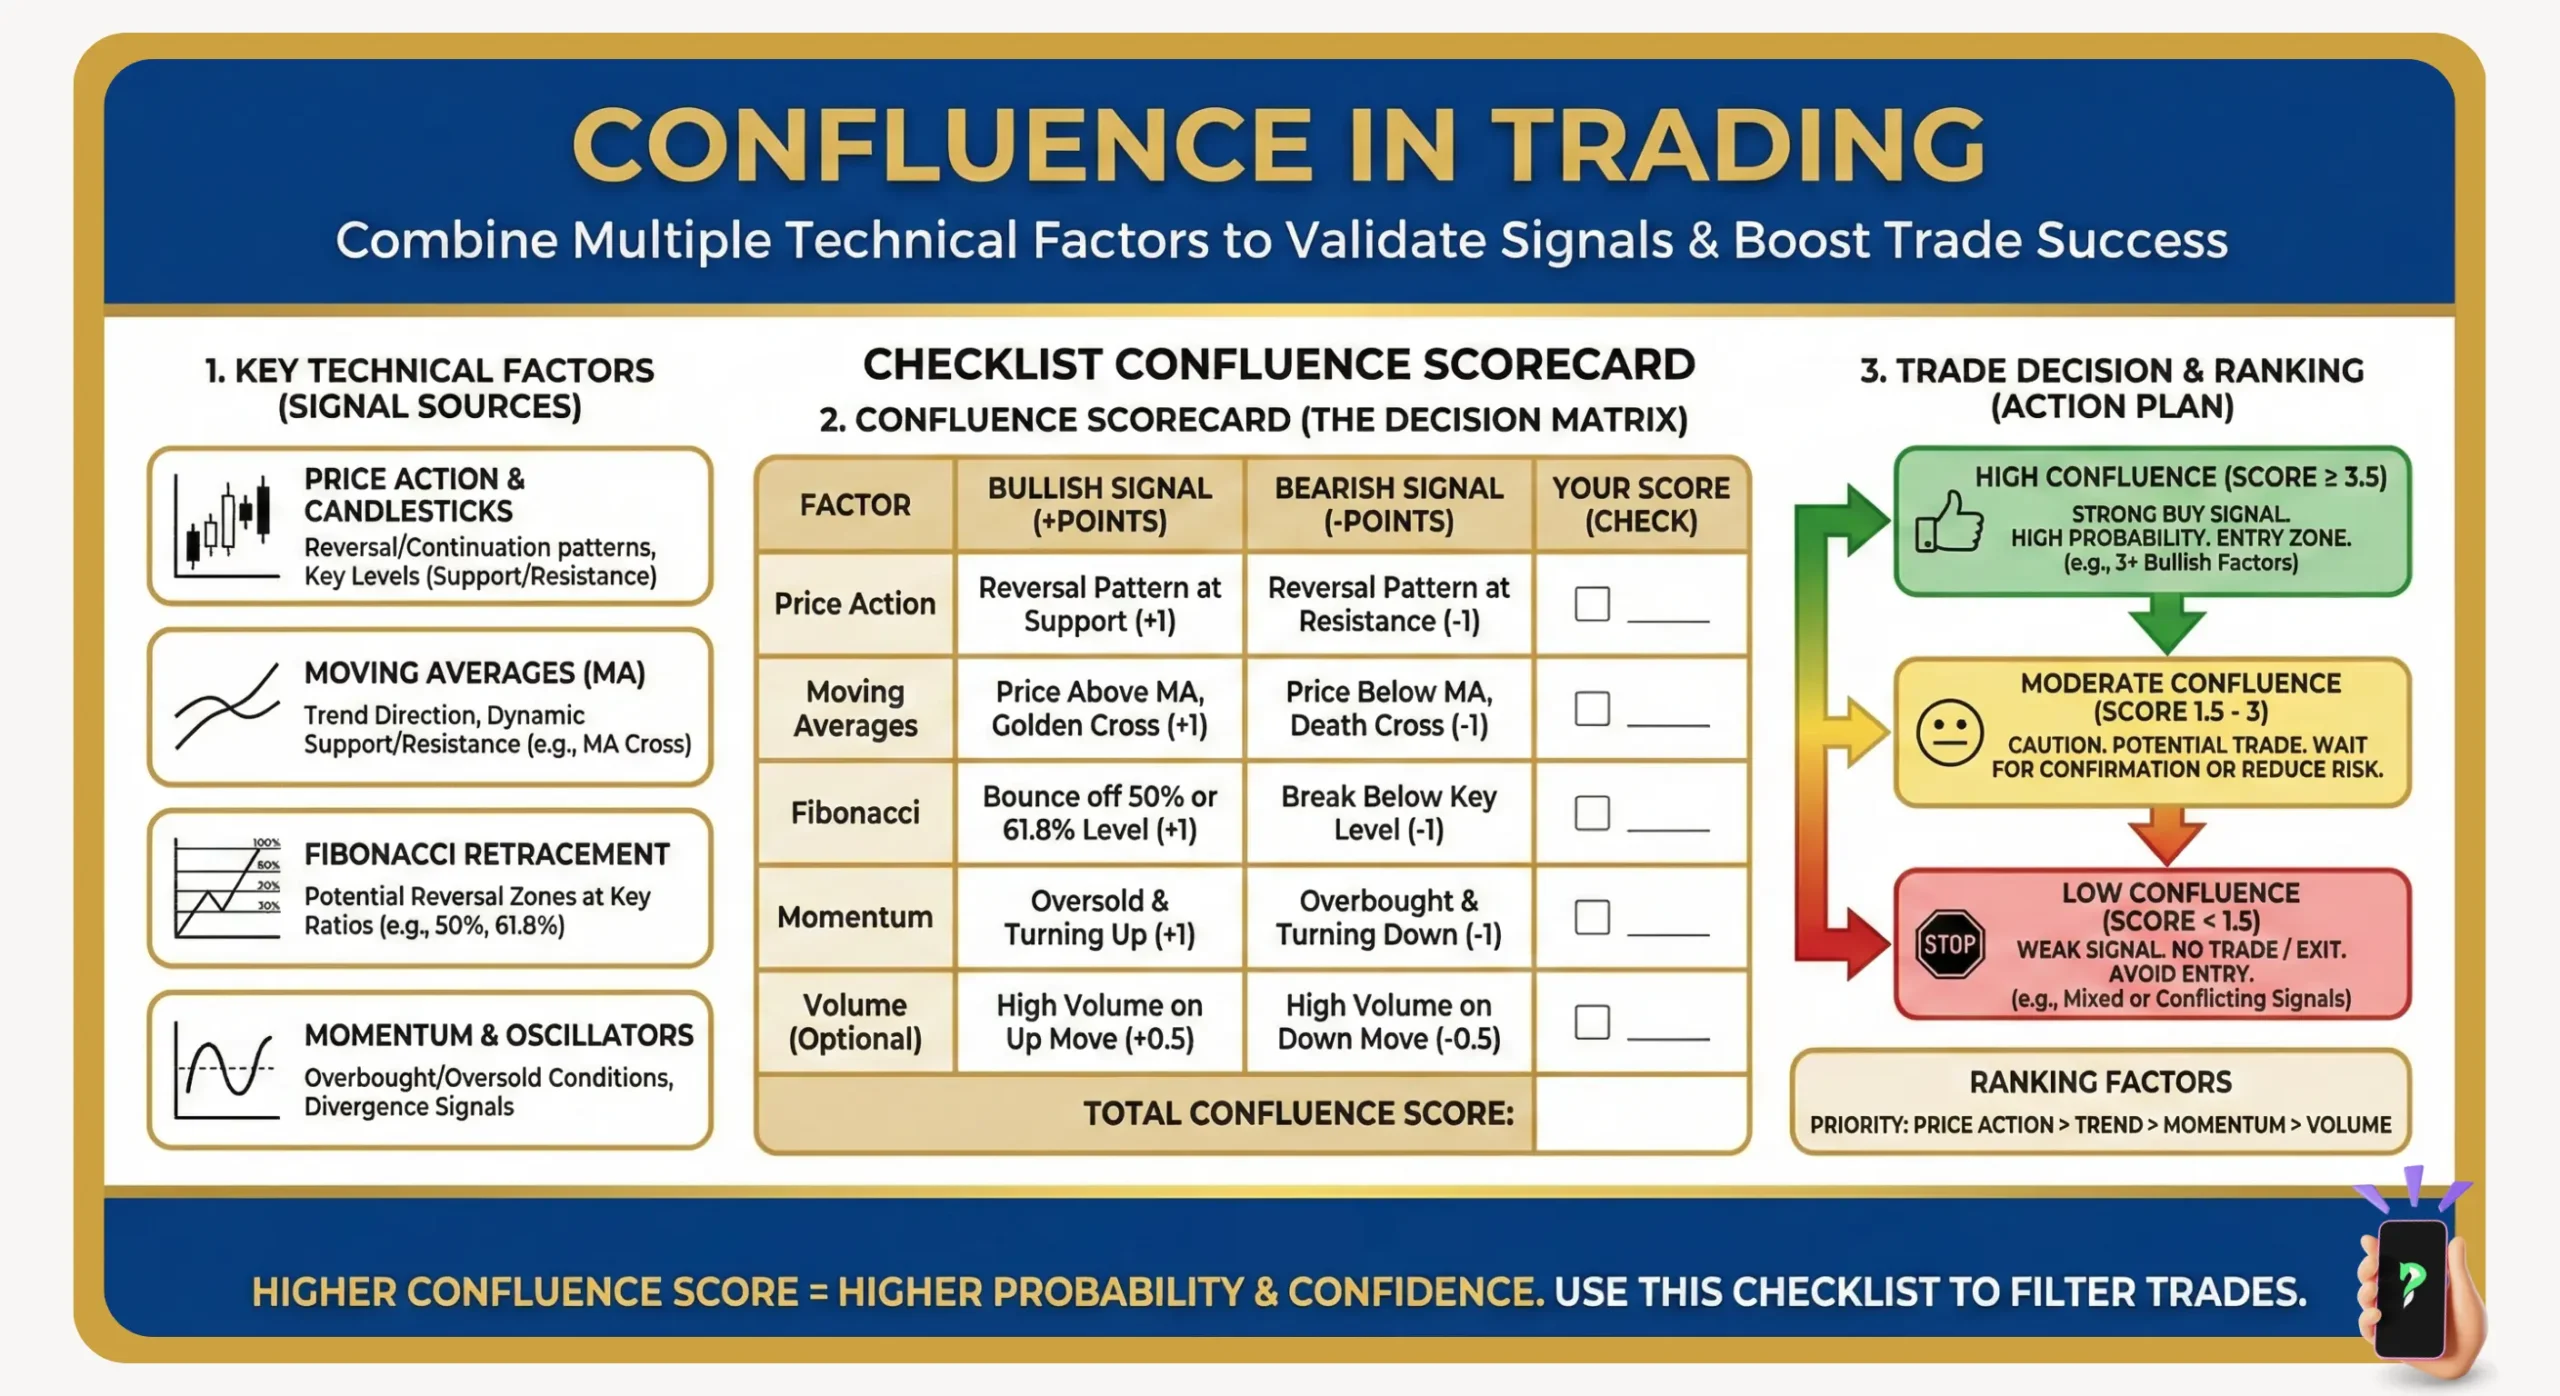
Checklist Confluence Scorecard -
Combine multiple technical factors -
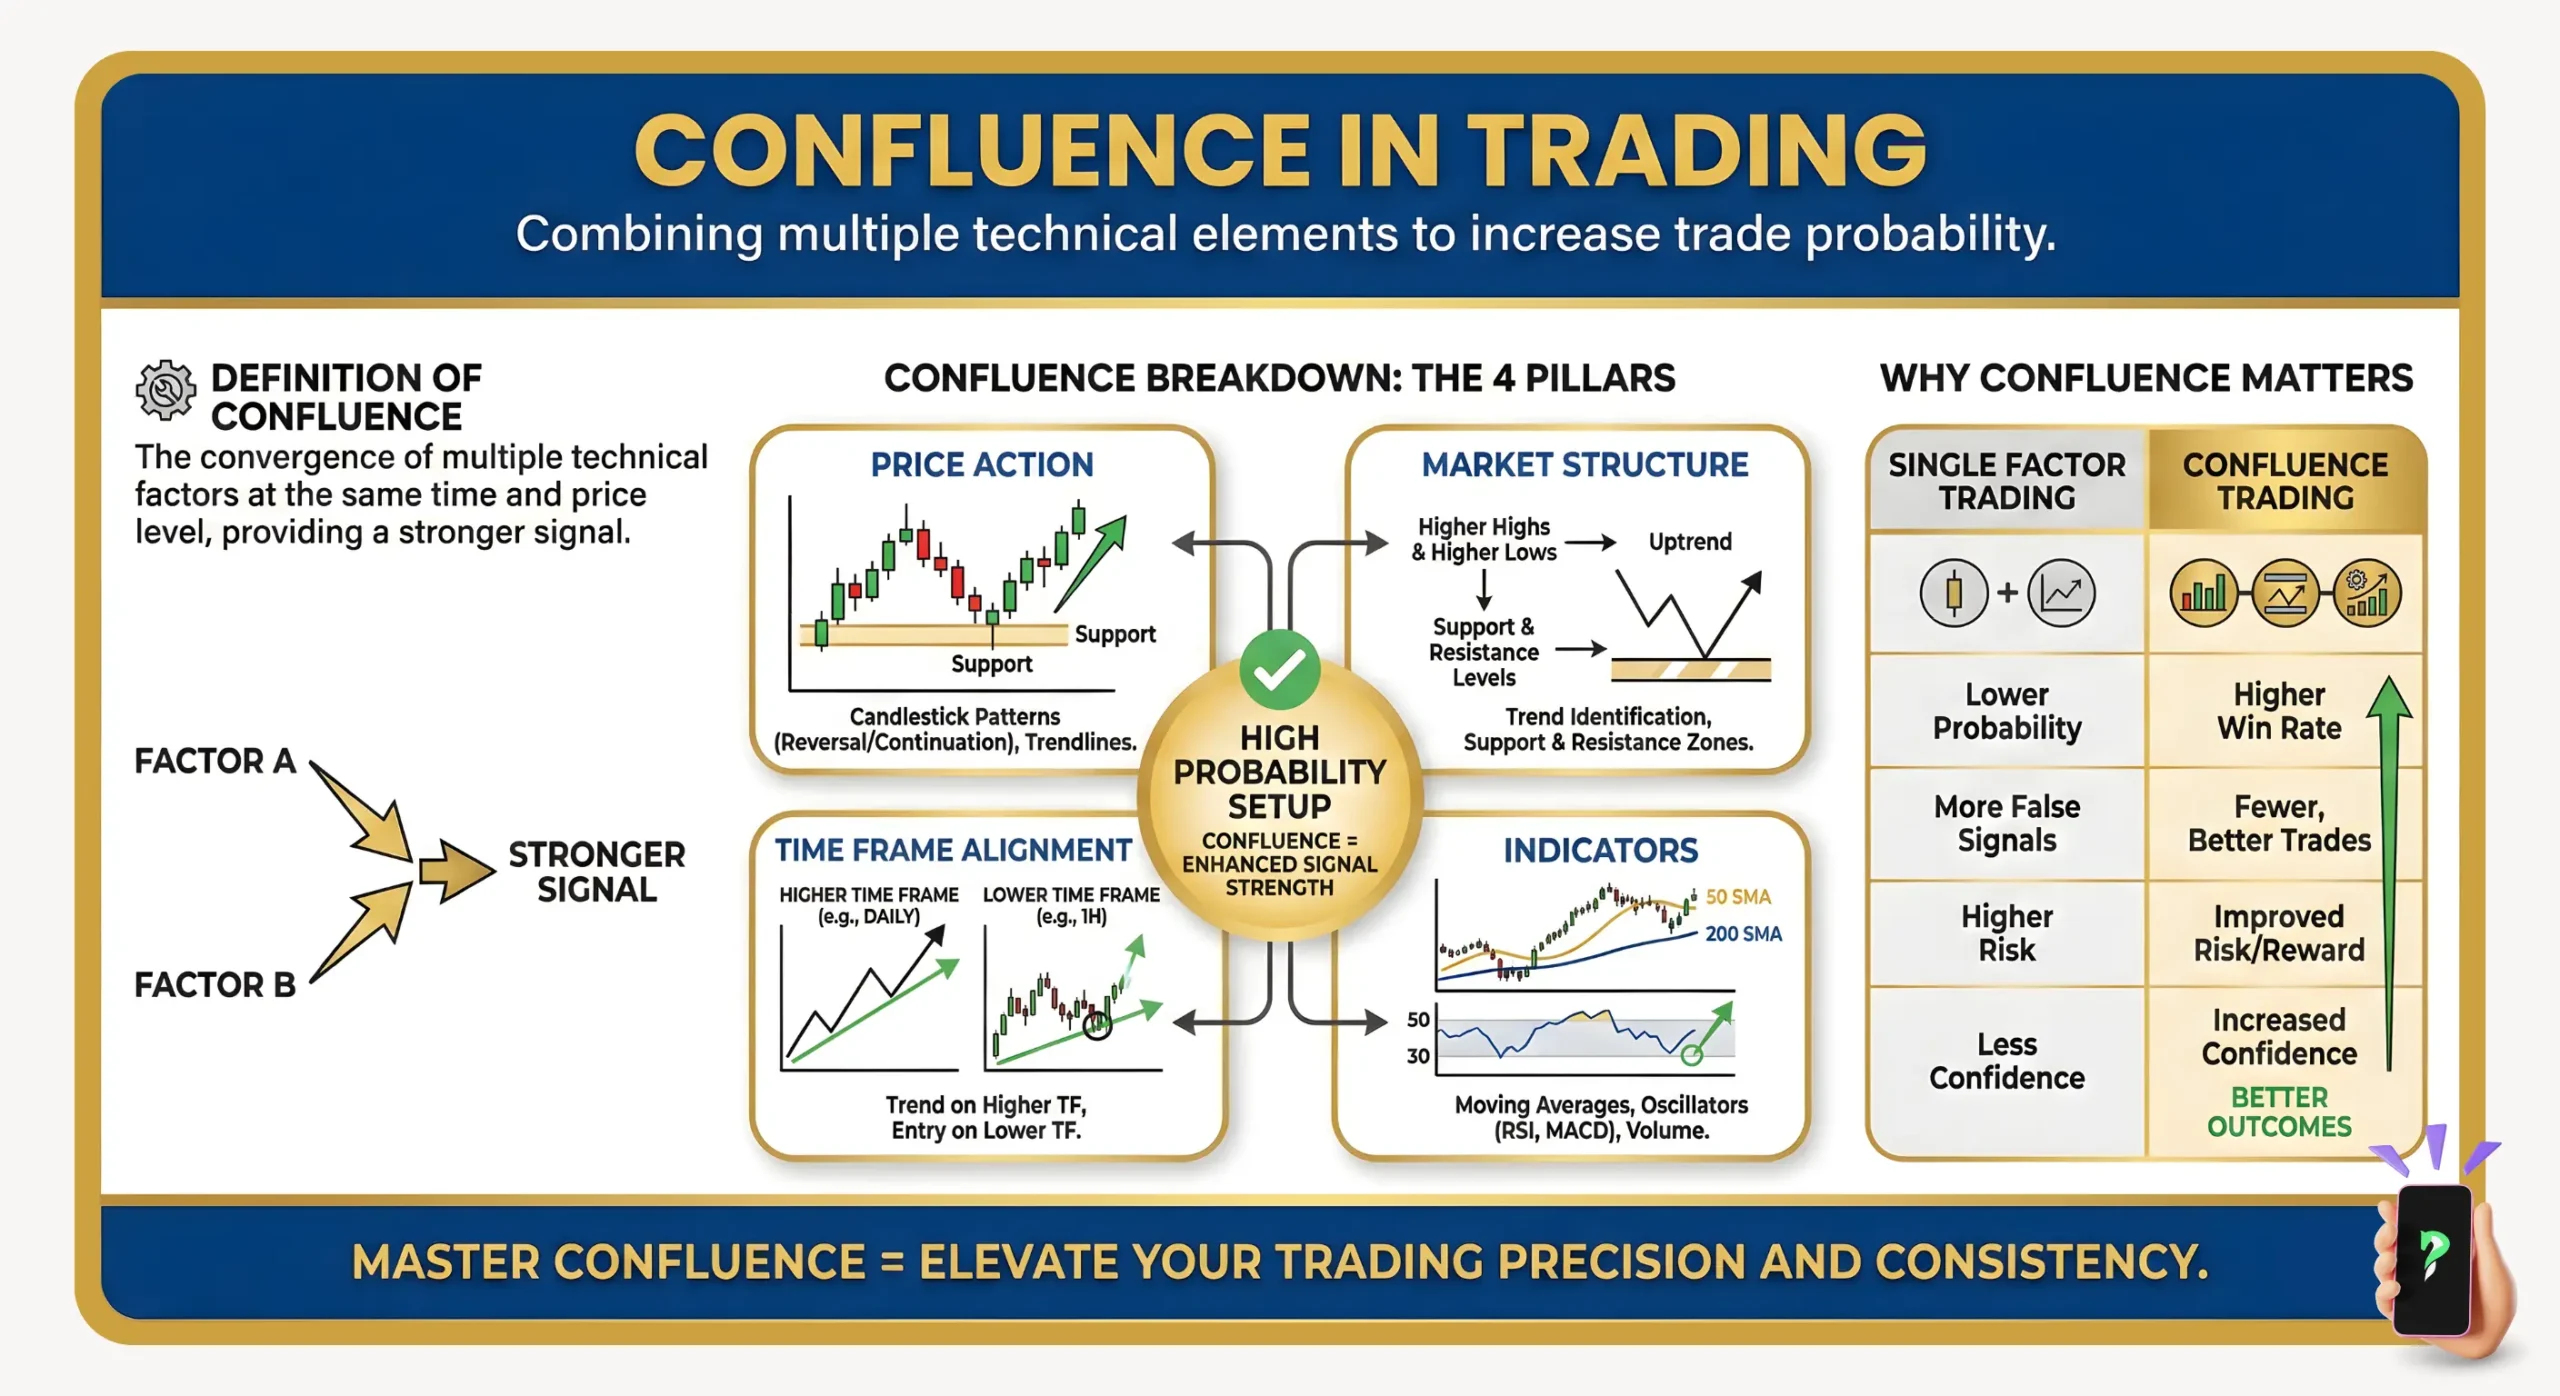
Confluence in Trading