Price tells you what happened, but trading activity reveals how much effort it took. Developed by Richard W. Arms Jr., the Ease of Movement Indicator (EMV) combines price volatility and trading volume to ask a crucial question: How easily did the price move? This unique focus on market efficiency helps traders pinpoint when “smart money” is quietly shifting the price with minimal resistance.
This guide provides an expert, step-by-step analysis of the EMV. It equips you with the practical strategies needed to accurately confirm market drive and gain a statistical edge in your technical analysis.
Key Takeaways
- Ease of Movement is a momentum oscillator measuring the efficiency of price variation and how much volume was required for a given price move.
- Oscillates around zero. Positive values signal price is rising easily (bullish efficiency); negative values signal price is falling easily (bearish efficiency).
- The Zero-Line Crossover confirms the direction of the momentum shift (buy/sell signal).
- EMV is sensitive. It must be paired with a Moving Average (MA) for smoothing and context or other indicators like RSI to validate signal strength.
- It compares the current price range movement to the Volume-to-Range Ratio (Box Ratio).
1. What Is the EMV Indicator in Trading?
The Ease of Movement (EMV) indicator, developed by Richard W. Arms Jr., is a specialized volume-based momentum oscillator. While traditional indicators look at price or volume in isolation, the EMV is designed to quantify the mathematical relationship between price volatility and trading volume to assess true market efficiency (Arms, 1994).
The Price Movement vs. Volume Relationship
The core objective of the EMV is to answer one critical question: How much volume (effort) was required to move the price from point A to point B (result)?
The indicator evaluates this relationship through two primary states:
- High Price Movement + Low Volume (High Efficiency): When the price advances or declines significantly on relatively light volume, it generates a high EMV value (positive or negative). This indicates low market friction, meaning “Smart Money” is moving the price with minimal resistance from opposing traders.
- Small Price Movement + High Volume (High Friction): When heavy trading volume results in very little price change, the EMV value drops toward zero. This highlights a period of high market friction or institutional churning, where massive effort is being expended but yielding almost no directional result.
By continuously measuring this ratio, Ease of Movement (EMV) indicator trading allows analysts to spot the “path of least resistance” and identify whether a current trend is structurally sound or secretly exhausting itself.
2. Understanding the Logic of Market Efficiency
In Ease of Movement (EMV) indicator trading, the core objective is to determine the “efficiency” of a price move. Instead of analyzing price or volume in isolation, the EMV focuses on the resistance (friction) the market encountered during a specific move.
2.1. Efficiency vs. Friction
The indicator identifies two primary states of market movement:
- High Efficiency (The Easy Move): Occurs when the price moves a significant distance on low volume. This suggests a lack of opposing supply or demand, allowing “Smart Money” to shift the price with minimal effort. This is often the precursor to a sustained trend.
- High Friction (The Difficult Move): Occurs when a large amount of volume results in only a small price change. This indicates a heavy deadlock or “churning” between buyers and sellers, where significant effort is being spent with very little price progress.
2.2. The Zero Line: The Market’s Equilibrium
The Zero Line acts as the critical threshold for sentiment control:
- Positive Values (Above 0): Market momentum is shifting upward with ease. The higher the value, the less resistance there is to the uptrend.
- Negative Values (Below 0): Market momentum is shifting downward with ease. The lower the value, the less resistance there is to the downtrend.
- Values Clustering Near Zero: This signals a “congestion” phase. Even if volume is high, the price isn’t moving, which often precedes a major breakout once one side loses the struggle.
3. Breaking Down the EMV Calculation
Understanding the EMV calculation is vital for customizing the indicator to different asset classes. The formula objectively quantifies the “effort vs. result” relationship through a structured three-step process.
3.1. Step 1: Calculating the Distance Moved
This component measures the shift in the price’s midpoint. It answers a simple question: Where is the center of today’s price range compared to yesterday’s?
Distance Moved = [(Current High + Current Low) / 2] – [(Prior High + Prior Low) / 2]
- Positive Result: The market’s center of gravity has moved up.
- Negative Result: The market’s center of gravity has moved down.
3.2. Step 2: Calculating the Box Ratio (The Friction)
The Box Ratio is the “secret sauce” of any EMV indicator strategy. It measures the “friction” encountered during the price move by looking at volume relative to the price range.
Box Ratio = (Volume / 1,000,000) / (High – Low)
- Scale Factor: The “1,000,000” is used to keep the final numbers manageable on the chart.
- High Box Ratio: High volume relative to a narrow price range. This signifies high friction (difficult movement).
- Low Box Ratio: Low volume relative to a wide price range. This signifies low friction (easy movement).
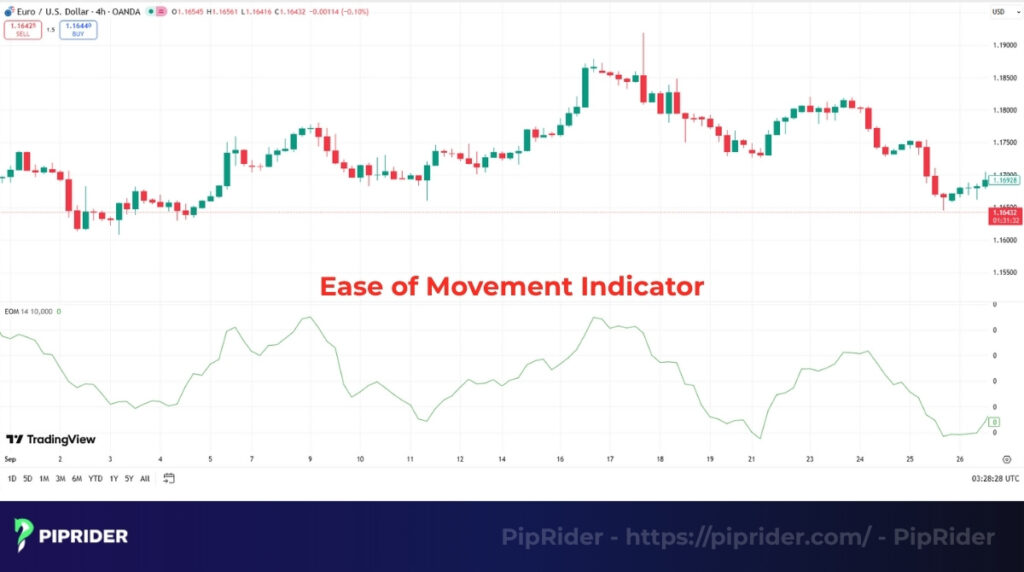
3.3. Final EMV Value and Signal Smoothing
The raw EMV for a single period is derived by dividing the Distance Moved by the Box Ratio. However, for actual Ease of Movement (EMV) indicator trading, the raw data is often too erratic to be used alone.
1-Period EMV = Distance Moved / Box Ratio
To filter out intraday noise and identify the “Smart Money” direction more clearly, standard platforms apply a 14-period Simple Moving Average (SMA) to these raw values. This smoothed line is what you actually see on your chart.
Pro Insight – Customizing for Your Asset: While the 14-period SMA is the standard, professional traders often adjust this look-back period to optimize their EMV indicator strategy:
- Crypto: Use a 9-period SMA for faster reaction to the high volatility and sharp “Smart Money” shifts in digital assets.
- Blue-chip Stocks: Use a 20-period SMA to filter out minor fluctuations and focus on long-term institutional accumulation phases.
4. When Does the EMV Indicator Work Best?
To succeed in Ease of Movement (EMV) indicator trading, you must deploy the tool in the right market environment. The indicator’s reliance on the Volume-to-Range ratio means it thrives in specific conditions while producing false signals in others.
4.1. Where EMV Excels (High Reliability)
To build a winning EMV indicator strategy, look for market structures that support sustained momentum:
- Trending Markets: EMV is highly effective when a clear uptrend or downtrend is already established. It acts as a lie-detector, confirming whether the trend is moving smoothly (sustainable) or encountering heavy friction (exhaustion).
- Strong Volume Expansion: The indicator shines during major price breakouts. When “Smart Money” forces a breakout with strong volume expansion and wide price spreads, the EMV will surge aggressively, validating the breakout’s legitimacy.
4.2. Where EMV Fails (The Danger Zone)
Knowing when not to use the EMV is just as critical for risk management.
- Low Volume Sideways Markets: During tight, choppy consolidations with low or erratic volume, the Box Ratio in the calculation becomes highly distorted. The indicator will flatline near the Zero Line or produce random, meaningless crossovers (whipsaws).
- Gap-Heavy Markets: Assets that frequently gap up or down at the open (like certain low-float stocks) can break the EMV’s math. The “Distance Moved” spikes artificially without organic intraday volume, creating a skewed reading.
Execution Rule: Never trade an EMV Zero-Line crossover during a tight, sideways range. Always wait for price action to show a structural breakout or a clear trend before relying on EMV signals.
5. How to Interpret the EMV Indicator
Reading the EMV goes beyond simply spotting buy and sell triggers. Mastering Ease of Movement (EMV) indicator trading requires a dual focus: understanding the zero-line equilibrium and continuously interpreting the underlying trend’s health.
5.1. The Zero-Line Equilibrium (Directional Bias)
The Zero Line is the absolute center of the EMV oscillator, representing a state of perfect balance between supply, demand, and volume friction.
- Above Zero (Upward Efficiency): Buyers are in control. The market is advancing with relative ease, meaning upward price action is outpacing volume resistance.
- Below Zero (Downward Efficiency): Sellers are in control. The market is declining with ease, meaning downward price action is outpacing volume resistance.
- Hugging the Zero Line (High Friction): When the EMV flatlines near zero, the market is in a deadlock. Even if trading volume is heavy, neither buyers nor sellers can move the price efficiently, resulting in a tight structural consolidation.
5.2. Trend Interpretation (Momentum Quality)
The true power of an EMV indicator strategy lies in reading the slope and extremes of the indicator to gauge the structural integrity of an ongoing trend.
- The Healthy Trend (Expansion): In a robust uptrend, the EMV should not only stay above the Zero Line but also print higher peaks alongside the price. This confirms that as the price rises, it is actually becoming easier to move, indicating strong institutional sponsorship.
- The Exhausting Trend (Contraction): If the price is steadily rising, but the EMV starts drifting lower toward the Zero Line, it acts as a critical divergence warning. This “trend deceleration” means the upward movement is encountering heavier friction. It requires more volume just to maintain the upward trajectory, signaling that the trend is aging and a pullback is likely.
- Extreme Spikes (Climax Moves): A sudden, massive vertical spike in the EMV often accompanies a blow-off top or a panic-selling bottom. While it highlights extreme “ease” in the moment, these anomalous spikes are unsustainable and typically indicate a volatility climax prior to a sharp mean-reversion.
6. Ease of Movement (EMV) Indicator Trading Strategies
To build a high-probability EMV indicator strategy, traders use the tool to validate momentum, measure market friction, and identify institutional shifts. Effectively applying Ease of Movement (EMV) indicator trading relies on four core setups: zero-line crossovers for trend shifts, trend continuation filters, divergence for early reversals, and technical confluence. Below are the exact execution rules for each setup.
6.1. Strategy 1: The Zero-Line Crossover (Momentum Shift)
The most fundamental EMV indicator strategy revolves around the Zero Line, which represents the exact point of market equilibrium. A crossover indicates a definitive shift in control and is primarily used to catch the beginning of a new directional move.
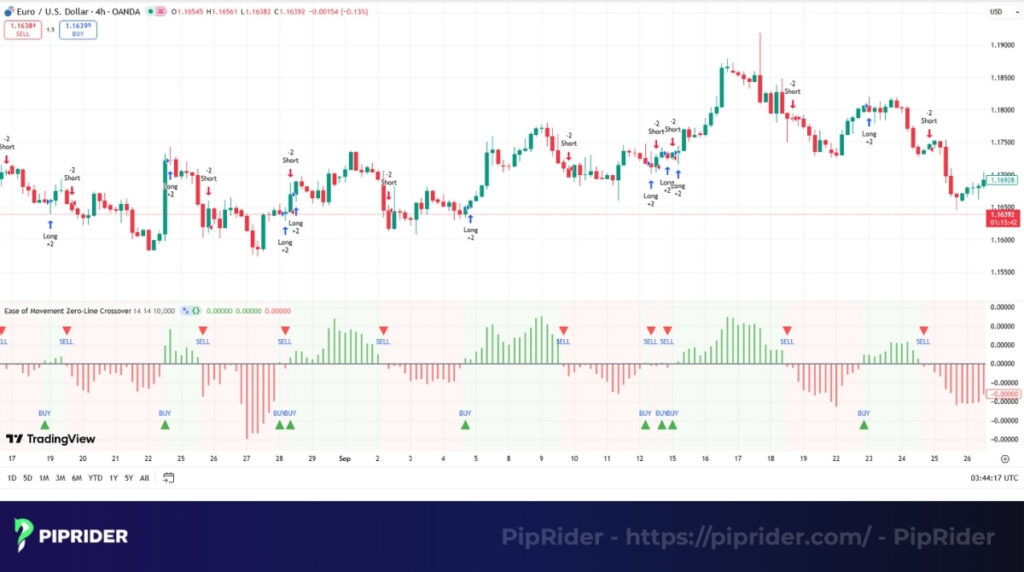
- Bullish Momentum (Long Signal): The smoothed EMV line crosses UP above the Zero Line (0).
- The Logic: The market has shifted into positive efficiency. Buyers are now able to push the price higher with minimal volume friction. Demand is overwhelming supply effortlessly, signaling strong upward momentum.
- Bearish Momentum (Short Signal): The smoothed EMV line crosses DOWN below the Zero Line (0).
- The Logic: The market has shifted into downward efficiency. Sellers have seized control and are driving the price lower with minimal resistance from buyers. Supply is overwhelming demand effortlessly, signaling strong downward momentum.
⚠️ Execution Rule for Crossovers: Never trade a crossover blindly. Ensure the broader market context supports the move (e.g., a structural breakout from a consolidation zone or a bounce off a macro support/resistance level). Trading crossovers in a tight, low-volume sideways market will lead to severe whipsaws.
6.2. Strategy 2: Trend Confirmation and Trade Management
While the crossover signals the start of a move, the EMV’s sustained position relative to the zero line acts as a continuous health check for an ongoing trend. This is crucial for Ease of Movement (EMV) indicator trading to manage open positions and trail stop-losses.
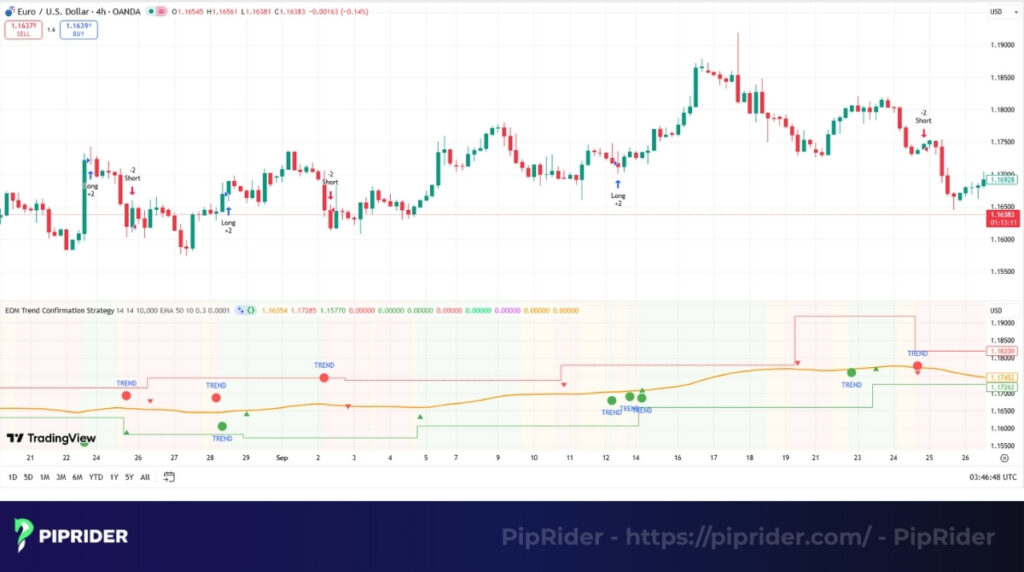
- Confirming a Healthy Uptrend: As long as the EMV remains distinctly above the Zero Line, the bullish momentum is structurally sound. If the price pulls back but the EMV stays above zero, it indicates that counter-trend sellers are weak and lack the volume to reverse the trend.
- Confirming a Healthy Downtrend: As long as the EMV remains distinctly below the Zero Line, the bearish momentum is intact. Bear-market rallies that fail to push the EMV back above zero indicate that counter-trend buyers lack conviction.
Execution Rule for Trade Management: Use the EMV Zero Line as a filter for holding trades. If you are in a long position and the price experiences a pullback, hold the trade as long as the EMV remains above 0. Exit or tighten your stop-loss only if the EMV decisively crosses back below the Zero Line, signaling that the “easy” upward momentum has died.
6.3. Strategy 3: The EMV Divergence (Early Warning Signal)
While zero-line crossovers are used for trend confirmation, divergence is a powerful EMV indicator strategy used to anticipate structural market reversals. Divergence occurs when price action and EMV momentum move in opposite directions, exposing a hidden shift in market efficiency.
- Bearish Divergence (Top Reversal): The price prints a Higher High (HH), but the EMV prints a Lower High (LH).
- The Logic: Although the price is advancing, the lower EMV peak indicates that this upward move required significantly more volume (effort) to achieve. The upward momentum has become highly inefficient, signaling that buying pressure is encountering heavy hidden resistance (distribution).
- Bullish Divergence (Bottom Reversal): The price prints a Lower Low (LL), but the EMV prints a Higher Low (HL).
- The Logic: The price continues to drop, but the higher EMV trough shows that the downward move is facing increasing friction. Sellers are expanding volume, but the price is not falling as easily, signaling potential accumulation by “Smart Money.”
Execution Rule for Divergence: Divergence is an anticipatory signal, not a direct entry trigger. In strong trends, divergence can build up over several price swings. To minimize risk, always combine EMV divergence with a confirmed break in the price structure (e.g., breaking a trendline) or wait for the EMV to cross the Zero Line to validate the reversal.
6.4. Strategy Combination: The Confluence Approach
Due to its inherent sensitivity, relying solely on a standalone EMV indicator strategy can generate false signals (whipsaws) during market consolidations. Professional traders use a confluence approach, combining the EMV with trend and volume tools to filter noise and validate trade setups.
- EMV + Moving Averages (Trend Filtering): The EMV measures momentum efficiency but does not define the macroeconomic trend. Overlaying a 50-period or 200-period Moving Average (MA) on the price chart establishes a strict directional bias.
- Execution Rule: Only execute long signals (EMV crossing above 0) if the price is trading above the MA. Ignore positive EMV spikes in a confirmed downtrend.
- EMV + Trend Lines (Breakout Validation): Trend lines define structural support and resistance boundaries. When the price breaks a descending resistance line, monitor the EMV.
- Execution Rule: If the EMV simultaneously surges into positive territory alongside the price breakout, it confirms the move occurred with low friction, validating a legitimate structural shift rather than a false breakout (bull trap).
- EMV + Volume Indicators (Flow Confirmation): While EMV measures the efficiency of a price move (effort vs. result), it does not track cumulative capital flow. Pairing it with a volume indicator provides a complete multidimensional market picture.
- Execution Rule: Combine EMV with a tool like On-Balance Volume (OBV). A high-probability setup occurs when an easy, low-resistance move (positive EMV) is simultaneously backed by sustained institutional accumulation (rising OBV).
7. Ease of Movement vs. OBV and CMF: Which is Better?
To choose the right volume tool for an EMV indicator strategy, traders must understand the core mechanical differences between the Ease of Movement (EMV), On-Balance Volume (OBV), and Chaikin Money Flow (CMF). Specifically, EMV measures the efficiency of a price move (friction), OBV tracks the cumulative flow of volume, and CMF evaluates intraday buying or selling pressure.
7.1. Ease of Movement vs. OBV (Efficiency vs. Cumulative Flow)
The primary difference in Ease of Movement vs OBV lies in how their respective formulas process price distance. While On-Balance Volume (OBV) focuses on the cumulative flow of volume to determine trend strength (Granville, 1963), the EMV evaluates how easily the price moved by factoring in the magnitude of the price shift relative to volume. In contrast, OBV simply adds or subtracts total volume based on the closing direction, completely ignoring how far the price actually traveled.
- On-Balance Volume (OBV) Logic: If the price closes higher than yesterday, all of today’s volume is added to the OBV total. Structural limitation: A $0.01 price increase on 10 million shares looks exactly the same to the OBV indicator as a $10.00 increase on 10 million shares.
- Ease of Movement (EMV) Logic: EMV measures Result vs. Effort. In the scenario above, the $0.01 move on 10 million shares drops the EMV near zero (massive friction). The $10.00 move causes the EMV to surge (low friction).
- The Verdict: Use OBV to track the absolute accumulation of capital over a macro trend. Use EMV to pinpoint the exact moments when the price breaks away with low resistance.
7.2. Ease of Movement vs. CMF (Midpoint vs. Closing Pressure)
The main difference between EMV and CMF is their focus on the daily price range. Chaikin Money Flow (CMF) measures buying and selling pressure by analyzing the closing price relative to the daily high-low range (Chaikin, n.d.), whereas EMV tracks the shift of the entire midpoint to gauge overall efficiency. Conversely, CMF measures closing pressure by analyzing where the asset closes relative to its own daily High-Low range.
- Chaikin Money Flow (CMF) Logic: If a stock consistently closes near its daily high on heavy volume, CMF rises, indicating localized accumulation.
- Ease of Movement (EMV) Logic: EMV ignores the closing tick and focuses on the broader center of gravity (the midpoint) compared to the prior session.
- The Verdict: CMF tells you who won the battle by the end of the day. EMV tells you how difficult the battle was overall.
7.3. Quick Comparison Matrix
To optimize your Ease of Movement (EMV) indicator trading, use this objective feature breakdown:
| Feature | Ease of Movement (EMV) | On-Balance Volume (OBV) | Chaikin Money Flow (CMF) |
|---|---|---|---|
| Primary Focus | Market Efficiency (Friction) | Cumulative Volume Flow | Intraday Closing Pressure |
| Calculation Basis | Midpoint Shift vs. Box Ratio | Adding/Subtracting Total Volume | Close relative to High-Low Range |
| Key Strength | Identifying low-resistance breakouts | Confirming macro trend strength | Spotting localized accumulation |
| Structural Weakness | Erratically skewed in tight sideways markets | Ignores the magnitude of price moves | Can lag behind sudden momentum shifts |
8. Real-World EMV Indicator Strategy Example
To effectively apply Ease of Movement (EMV) indicator trading in a real scenario, let’s look at a classic swing trading setup using the Daily (D1) chart.
The Setup: Imagine an asset has been trading in a tight sideways consolidation near a major macro support level. During this time, the EMV has been flatlining near the Zero Line (high friction).
- The Entry (Long): The price breaks above the consolidation resistance. Simultaneously, the smoothed EMV aggressively crosses UP above the Zero Line. You enter a Long position on the close of this breakout candle, confirming that the new bullish momentum has minimal volume friction.
- Stop-Loss Placement: Place your stop-loss just below the most recent swing low prior to the breakout. This protects your capital if the breakout turns out to be a “bull trap.”
- Take-Profit / Exit: Trail your stop-loss upward as the trend progresses. Exit the position completely when the EMV decisively crosses back below the Zero Line, signaling that the “easy” upward momentum has exhausted itself.
9. Special Consideration: Why EMV Struggles in Forex
While the EMV calculation is an elite tool for centralized markets (Stocks, Crypto), it faces a structural hurdle in the Foreign Exchange (Forex) market. Because Forex is a decentralized Over-The-Counter (OTC) market, the data fed into the indicator is often fundamentally flawed:
- Tick Volume vs. Real Volume: Most Forex brokers only provide “Tick Volume” (how many lần giá nhảy). It does not represent the actual capital ($) being traded, which is a requirement for an accurate EMV indicator strategy.
- Lack of Centralized Data: Since there is no central exchange, the volume data is limited to your specific broker’s liquidity pool, leading to skewed “efficiency” readings.
- The “Futures” Exception: If you must trade currencies with EMV, use Currency Futures (e.g., 6E, 6B). These are traded on centralized exchanges (like the CME) and provide the audited volume data necessary for the indicator to work.
Execution Rule: Avoid applying EMV to standard Spot Forex pairs. Stick to Stocks, ETFs, or Crypto where volume is a transparent, absolute metric.
10. Conclusion
The Ease of Movement (EMV) indicator is a sophisticated analytical tool that goes far beyond simple volume counting. By strictly measuring market efficiency—the direct result of price movement versus the effort of trading volume—it acts as an institutional lie-detector. It reveals the market’s true path of least resistance.
Remember, because of its inherent sensitivity, a standalone EMV indicator strategy is vulnerable in choppy markets. Always deploy it as a confirmation tool alongside structural price action, moving averages, or cumulative flow indicators like OBV.
To further refine your technical toolkit and discover the best platforms for executing these advanced volume strategies, be sure to explore our comprehensive Broker Reviews section at Piprider today.