
The best forex volume indicators help traders answer one critical question: Is this price move backed by real participation, or is it likely to fail? In the decentralized foreign exchange market, where there is no centralized exchange to report global volume, that answer is found within Tick Volume.
Because you are trading based on activity frequency rather than total contracts, choosing the right indicator is the difference between identifying a high-probability trend and falling into a retail liquidity trap. This guide breaks down the most effective volume tools to help you validate every breakout and trade with institutional conviction.
Key Takeaways
- Gain insight into volume indicators: These tools assess the intensity of trading activity in the forex market, helping traders evaluate momentum, liquidity, and the strength of price movements useful for confirming trends or identifying potential reversals.
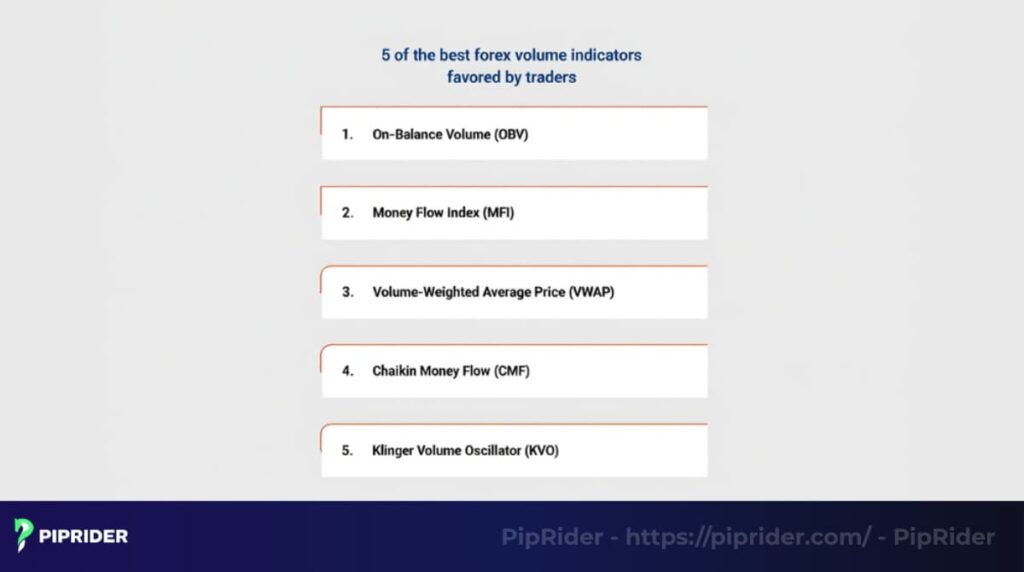
- Top five indicators: On-Balance Volume (OBV), Money Flow Index (MFI), Volume-Weighted Average Price (VWAP), Chaikin Money Flow (CMF), and Klinger Volume Oscillator (KVO) are popular choices, each suited to specific trading styles like trend, reversal, or breakout trading.
- Strategic application: Use OBV for trend confirmation, MFI for reversals, VWAP for intraday scalping, CMF for breakouts, and KVO for momentum shifts, with optimal timeframes ranging from 1-minute to H1+ charts.
- Pros and cons: Volume indicators enhance trade timing and trend validation but rely on broker-specific data and may lag in low-volatility markets, requiring confirmation from tools like RSI or price action.
- Practical tips: Test indicators on demo accounts, use multiple timeframes, combine with other tools, and monitor economic events to maximize effectiveness and minimize false signals.
1. What is a volume indicator in forex?
In forex trading, volume indicators usually track market activity using what’s known as “tick volume.”Because forex is a decentralized (OTC) market with no central exchange, it’s impossible to measure the total actual lots traded across the entire market. According to the Bank for International Settlements (BIS) 2025 Triennial Survey, the foreign exchange market now reaches a staggering daily turnover of $9.6 trillion. This massive liquidity is distributed across a global network, making tick volume the most reliable proxy for retail traders.
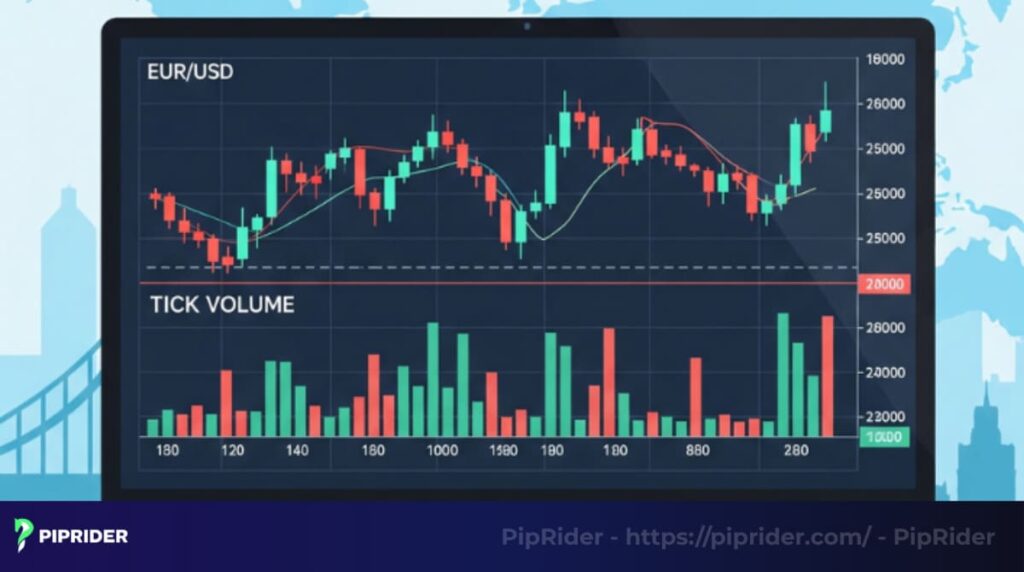
Tick volume reflects how frequently the price moves during a given time frame. High activity (many price changes) often correlates with high actual trading volume, reflecting buying and selling pressure.
Understanding what is a volume indicator in forex in this context is a game-changer for traders. It helps you estimate the market’s activity level, giving clues about momentum and potential price moves.
- Why it’s important: Tick volume provides insights into market liquidity and the intensity of trading activity. High tick volume often indicates significant market interest. Combining tick volume with price action helps me spot the best forex volume indicators for reliable signals.
- Application: Traders analyze volume to support trend confirmation, identify possible reversals, or verify breakout strength. For instance, a sharp price increase accompanied by low volume may indicate a lack of conviction behind the move. Understanding this can save you from bad trades.
2. Forex Volume Indicators vs. Price Indicators
To trade with an edge, you must distinguish between the Direction of the market and the Conviction behind that direction. While both categories are essential, they serve entirely different analytical purposes.
2.1. The Data Source: Result vs. Commitment
The primary challenge in market analysis is distinguishing between a genuine structural shift and a temporary price fluctuation. To achieve this, traders must understand the dichotomy between “Price” as an outcome and “Volume” as the driving force. By analyzing the source of the data, you can determine whether a move has the necessary institutional backing to sustain itself:
- Price Indicators: Tools such as Moving Averages (MA) or the Relative Strength Index (RSI) are Lagging Indicators. They are 100% derived from historical price points. They show you the “Result”—where the price has already traveled.
- Volume Indicators: Tools like OBV or CMF track Market Participation. In the decentralized Forex market, this is measured via Tick Activity (the frequency of price changes). These tools provide insight into the “Commitment”—how much institutional interest is fueling a move.
2.2. Technical Comparison: Price vs. Volume
To build a high-probability trading system, you must understand that price and volume represent two different dimensions of the market. While price action tells you where the market is moving, volume reveals how much conviction is behind that move.
The following technical comparison highlights the fundamental differences between these two data streams and how they function within a professional analysis framework:
| Feature | Price Indicators | Volume Indicators |
|---|---|---|
| Market Function | Measures Price Displacement | Measures Liquidity & Participation |
| Analytical Role | Identifies Trend Direction | Validates Trend Sustainability |
| Signal Type | Lagging (Follows Price) | Coincident / Leading (Confirms Momentum) |
| Primary Goal | Spotting Oversold/Overbought levels | Detecting Institutional Accumulation |
2.3. The Mechanics of Market Conviction
In professional trading, a price breakout is merely a “claim.” For that claim to be valid, it must be supported by a surge in market activity.
- High-Conviction Move: Price breaks a key level with a simultaneous spike in volume. This indicates institutional consensus—major players are actively defending the new price level.
- Low-Liquidity Trap: Price breaks a level on declining or flat volume. This suggests a lack of institutional backing, often signaling a retail-driven “fakeout” that is likely to reverse once liquidity is cleared.
By combining price direction with volume conviction, you move from “guessing” where the market might go to “validating” where the real money is moving.
2.4. Market Scenario Validation
To put this into practice, here is how you should interpret the relationship between price movement and volume signals to assess market strength:
| Scenario | Volume Signal | Market Implication |
|---|---|---|
| Rising Price | High / Increasing | Strong Trend: High conviction; safe to maintain or enter positions. |
| Rising Price | Low / Decreasing | Weak Trend: Lack of participation; high risk of an imminent reversal. |
| Price Breakout | High Spike | Sustainable Move: Institutional backing confirmed; low probability of a fakeout. |
| Price Breakout | Low / Flat | Liquidity Trap: Likely a retail-driven move; high probability of a fakeout. |
3. Best Forex Volume Indicators for Beginners
If you are new to volume analysis, trying to master every indicator at once will lead to analysis paralysis. At PipRider, we highly recommend following a progressive learning path. Start simple, and gradually add complexity as your chart-reading skills improve:
- Step 1: Start with On-Balance Volume (OBV). This is your ideal starting point. It is visually simple, adding or subtracting volume based on the closing price. It trains your eye to spot divergences and accumulation without requiring complex mathematical understanding.
- Step 2: Move to the Money Flow Index (MFI). Once you understand basic volume flow, upgrade to the MFI. Think of it as a volume-weighted RSI. It teaches you how to combine price and volume to identify overbought (80+) and oversold (20-) exhaustion zones.
- Step 3: Advance to VWAP and CMF. When you are ready for tactical execution, introduce these two. Learn VWAP to understand intraday “fair value” (crucial if you want to scalp), and use Chaikin Money Flow (CMF) to measure the actual buying/selling pressure needed to validate breakouts.
- Step 4: Tackle the Klinger Volume Oscillator (KVO) Last. Save the KVO for when you have a solid grasp of price action. Because it uses moving averages of volume, it is highly sensitive and can produce false signals (noise) if you don’t know how to filter them out with market structure.
By following this exact order, you build a solid foundation in market mechanics before dealing with highly sensitive, fast-moving oscillators.
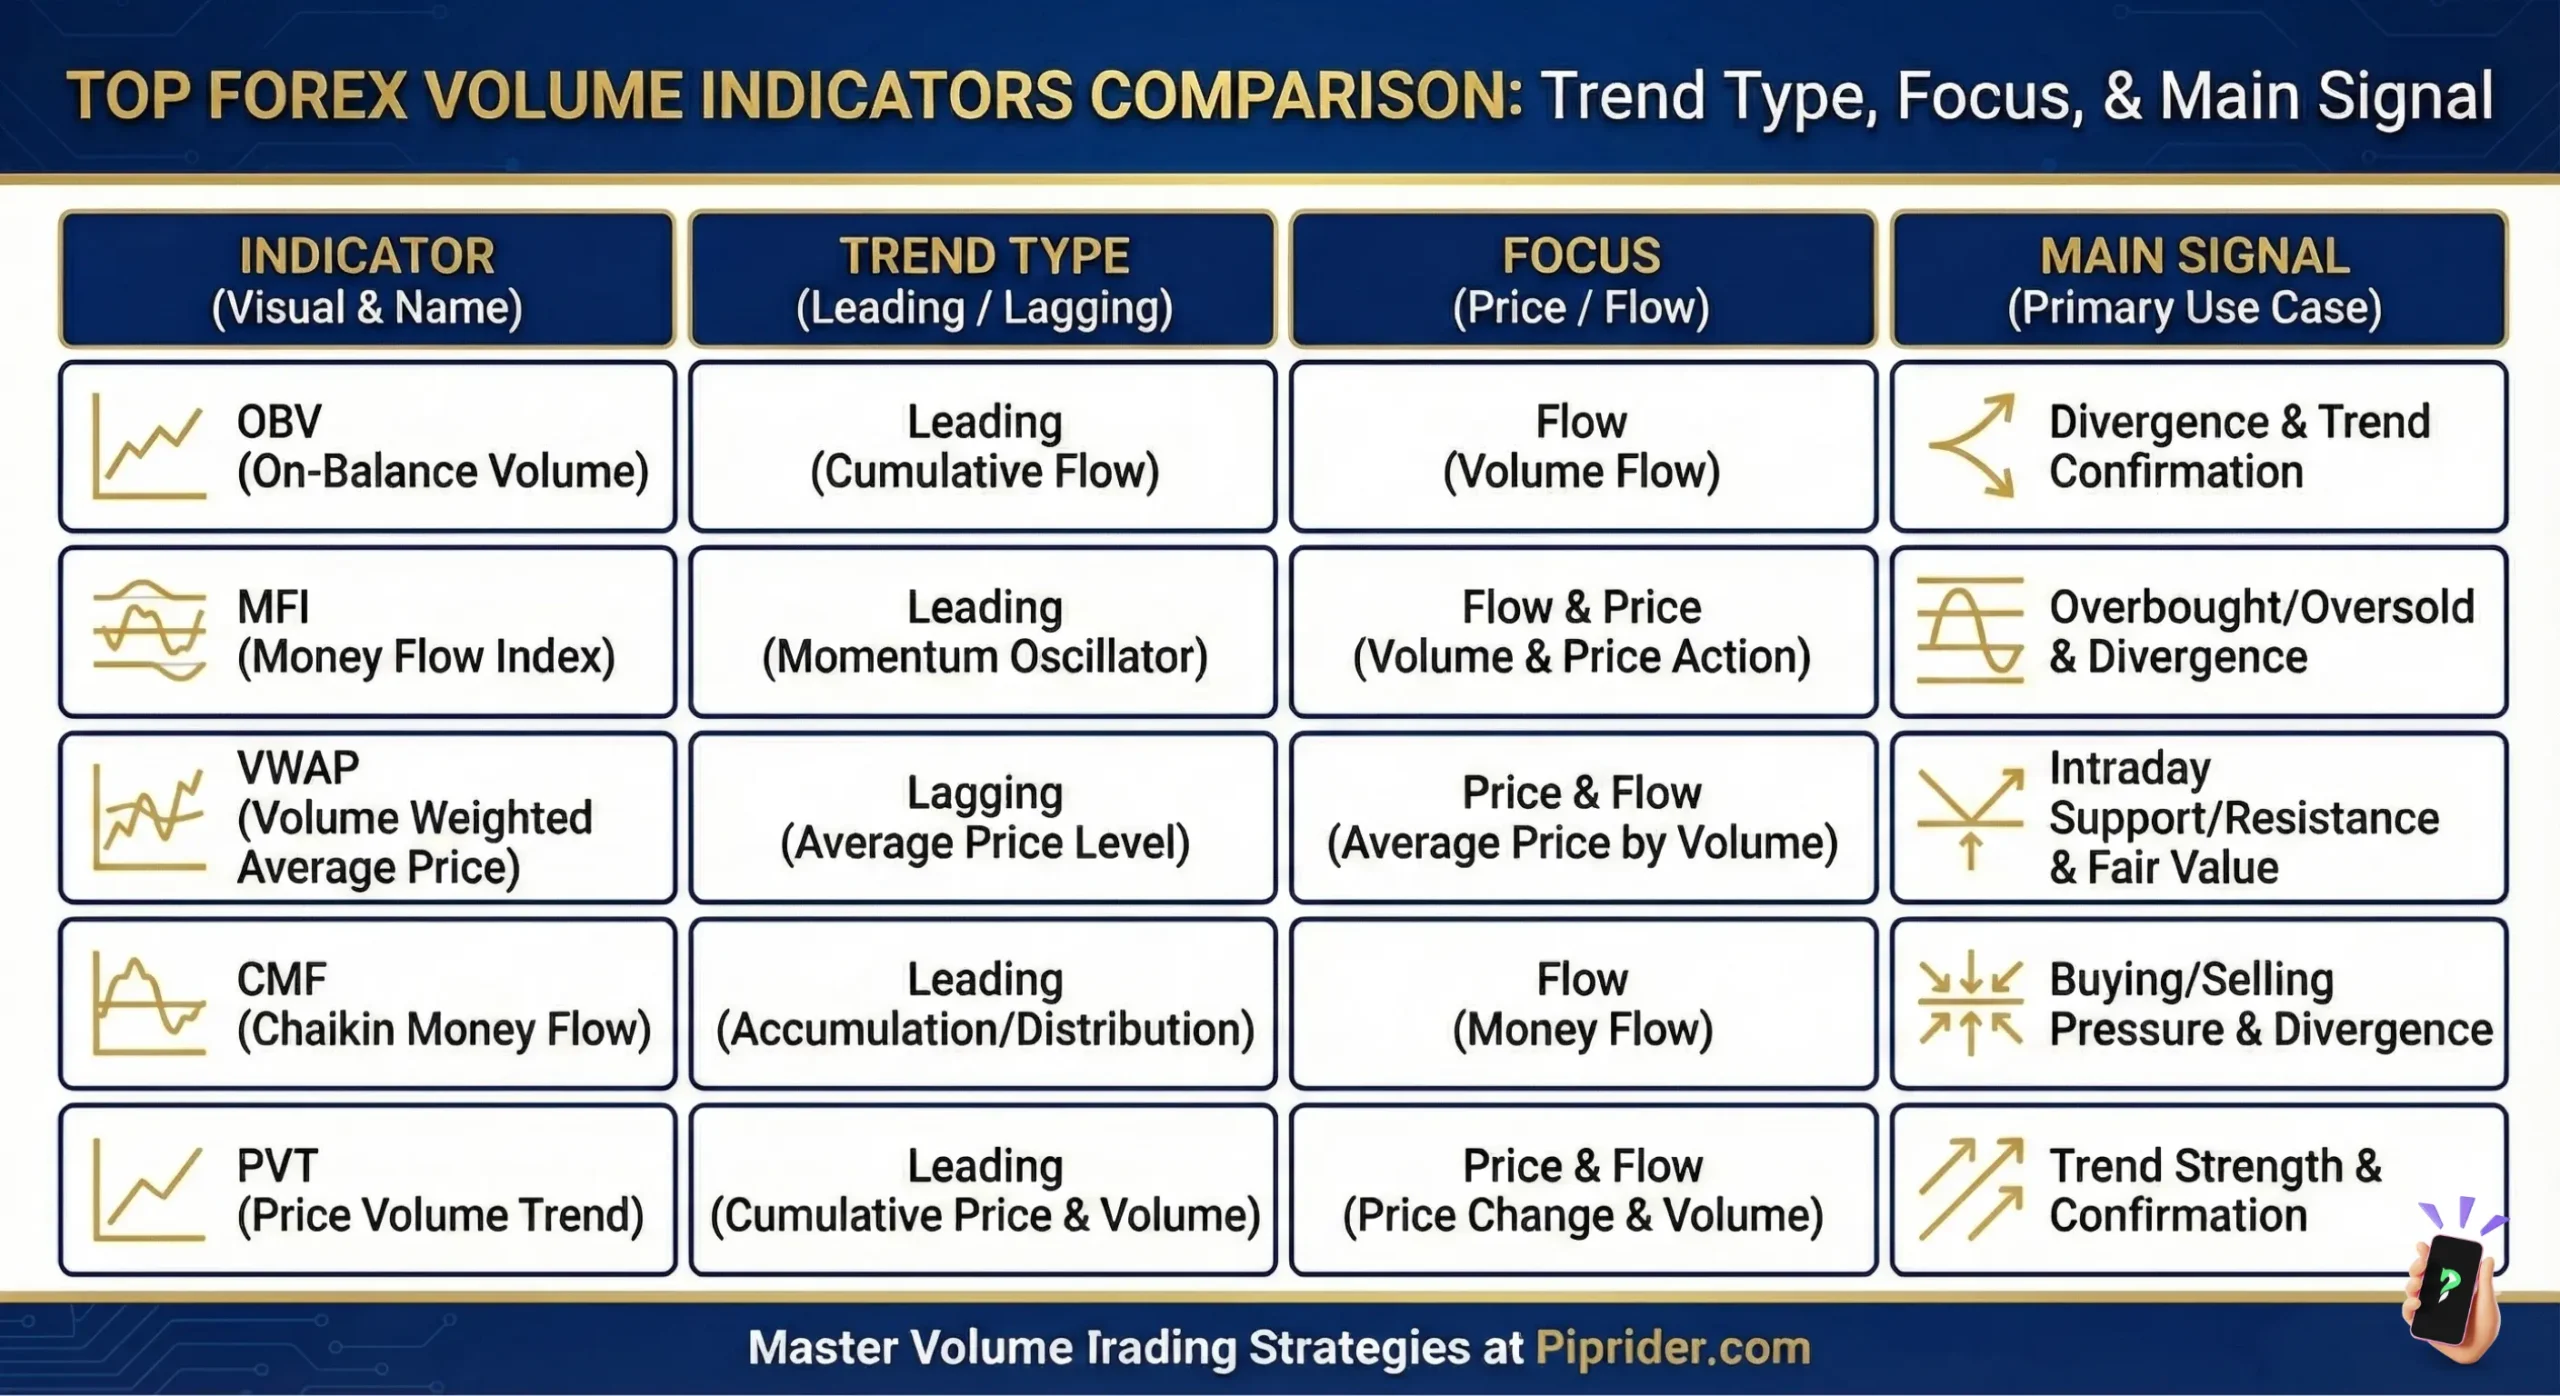
4. 5 of the best forex volume indicators favored by traders
Choosing the best forex volume indicators can transform your trading by revealing market strength and timing. This section dives into five powerful tools that help confirm trends, spot reversals, and nail breakout trades.
| Indicator | Best for | Timeframe | Strength | Weakness |
|---|---|---|---|---|
| OBV | Trend confirmation | H1+ | Simple, clear divergences | Less useful in noisy intraday conditions |
| MFI | Reversals | M5–H1 | Overbought/oversold signals | Can whipsaw in choppy markets |
| VWAP | Intraday bias | M1–M15 | Great for session trading | Less useful for swing trading |
| CMF | Breakout confirmation | M1–M15 / H1 | Good for buying/selling pressure | Sensitive to short-term noise |
| KVO | Momentum shifts | M1–M5 | Early signal potential | More complex, more noise |
Let’s break down each one to see how they can boost your strategy.
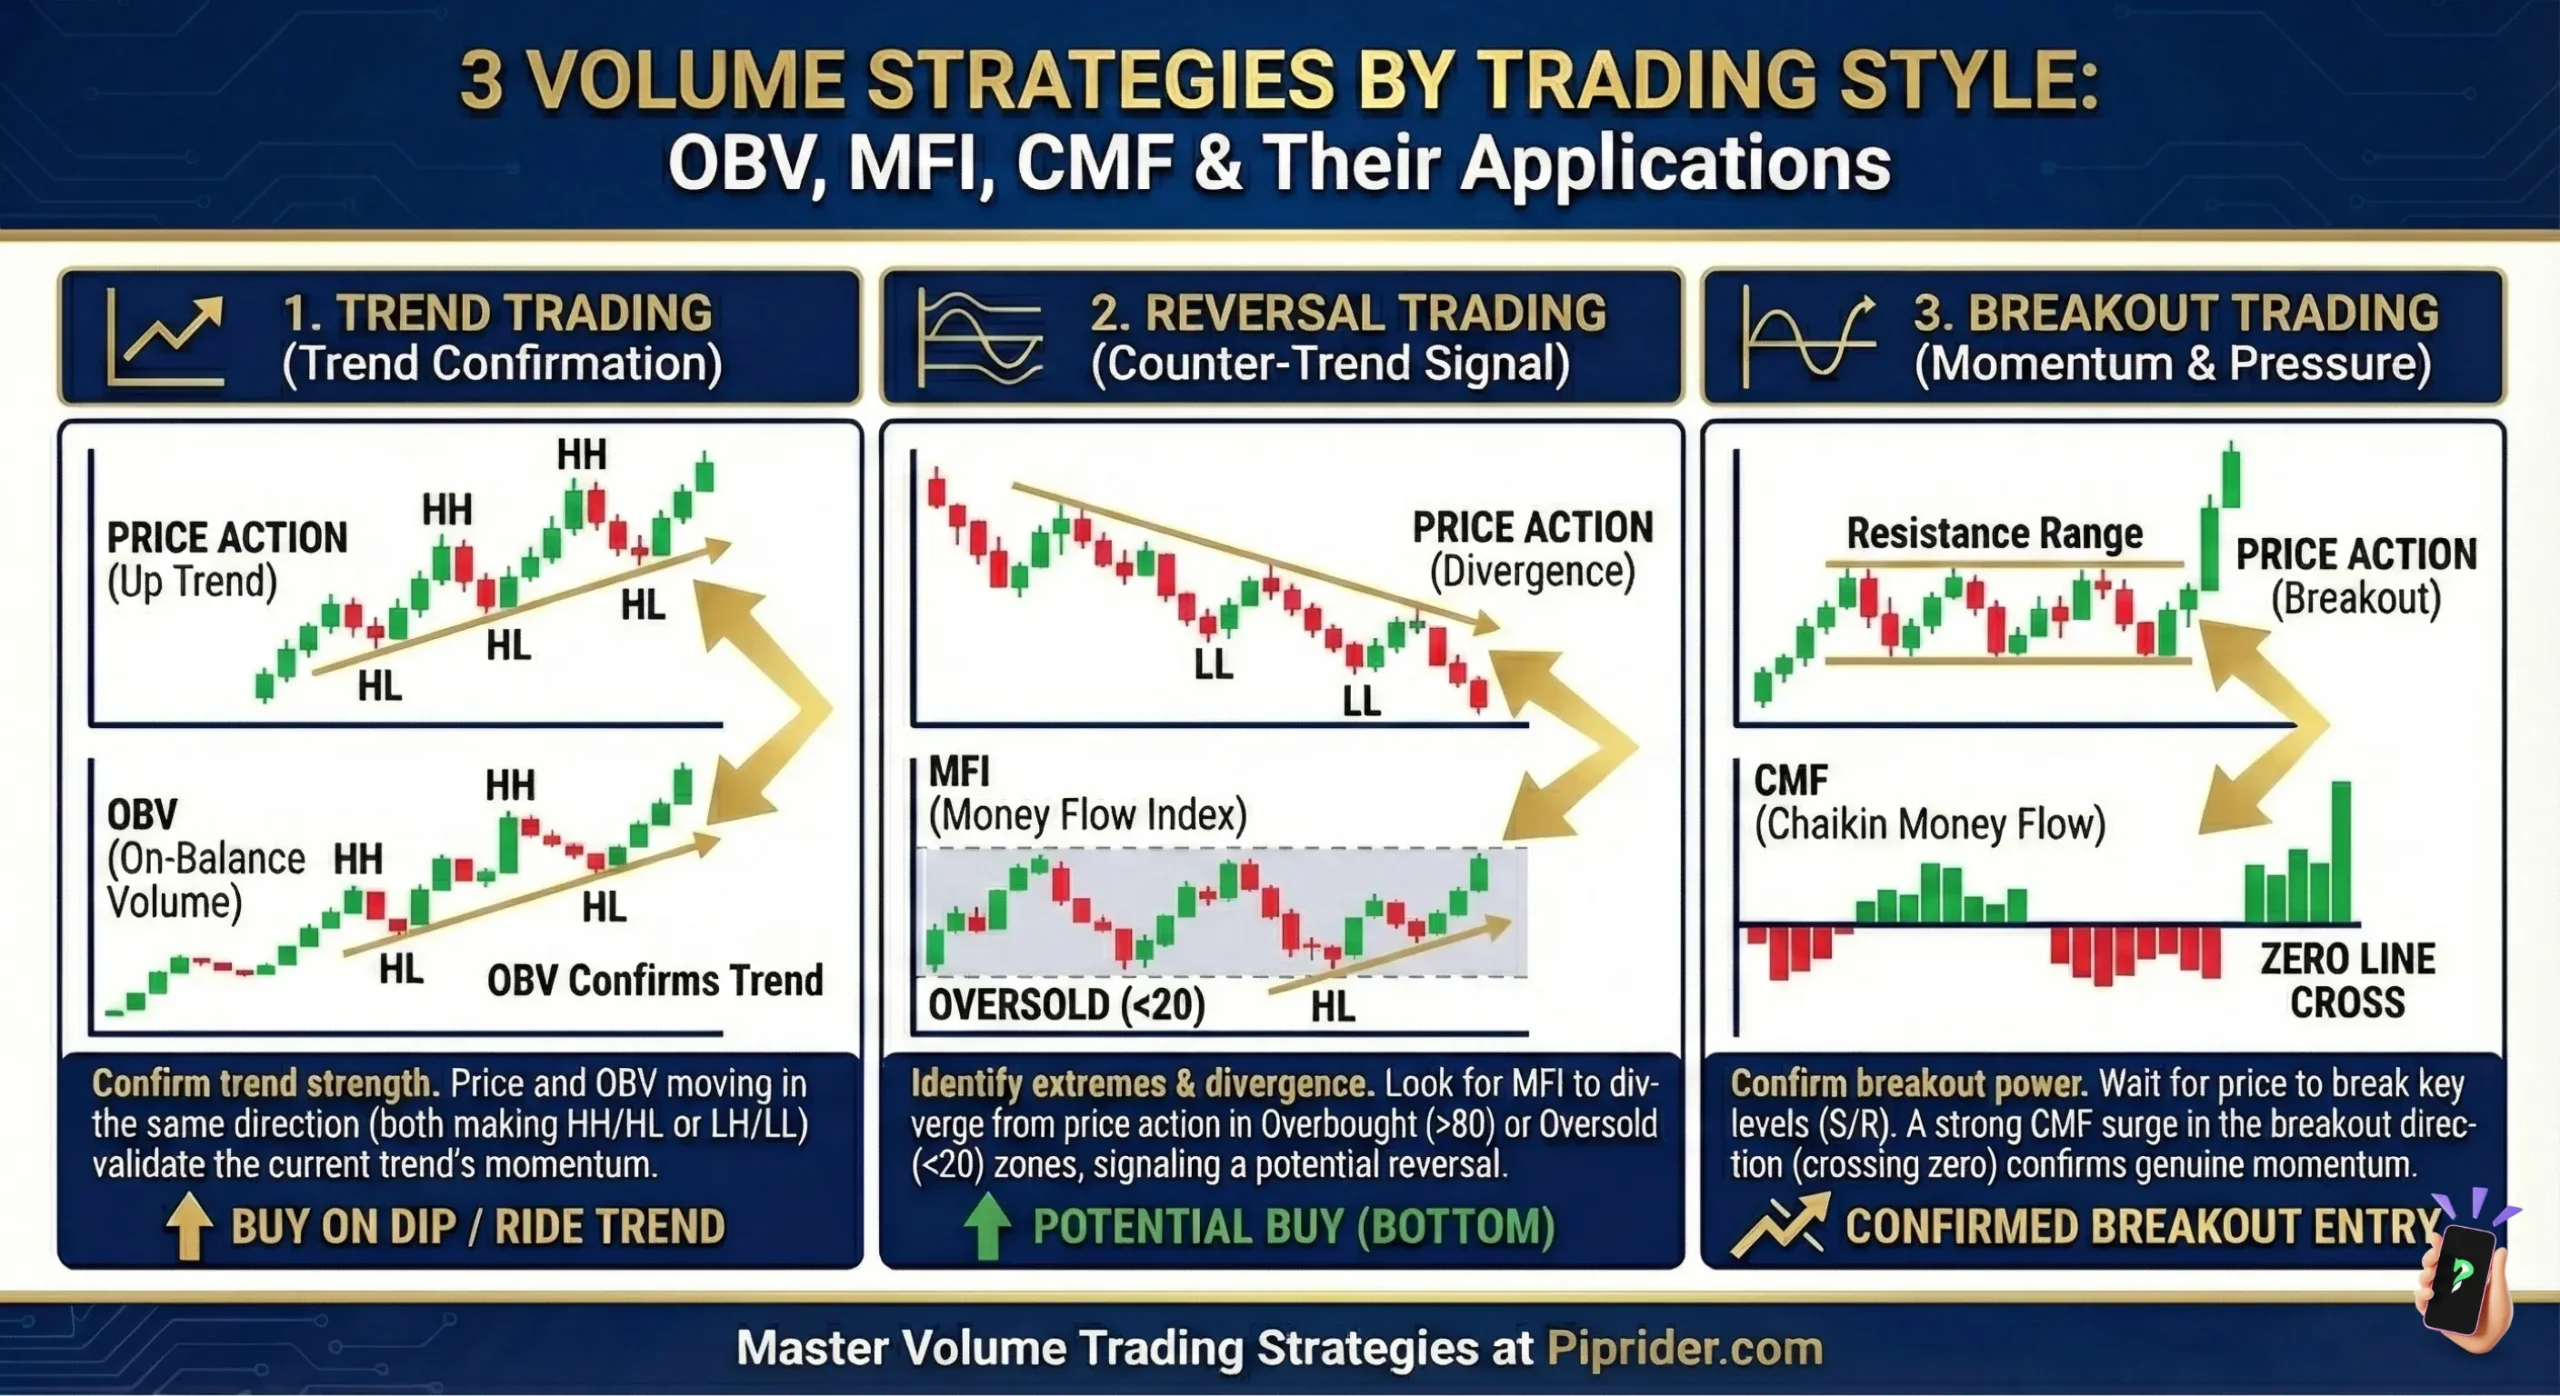
4.1. On-Balance Volume (OBV)
OBV is a popular tool among traders because it measures buying and selling momentum by adding volume on days when prices rise and subtracting volume on days when prices fall. This method provides a clear insight into the strength of market trends.
- How it works: When a candle closes above the previous one, its volume is added to the OBV total. Conversely, if it closes below, the volume is deducted. This calculation simplifies the Wyckoff Methodology, a legendary framework developed by Richard D. Wyckoff by visually confirming if institutional ‘smart money’ is accumulating or distributing positions.
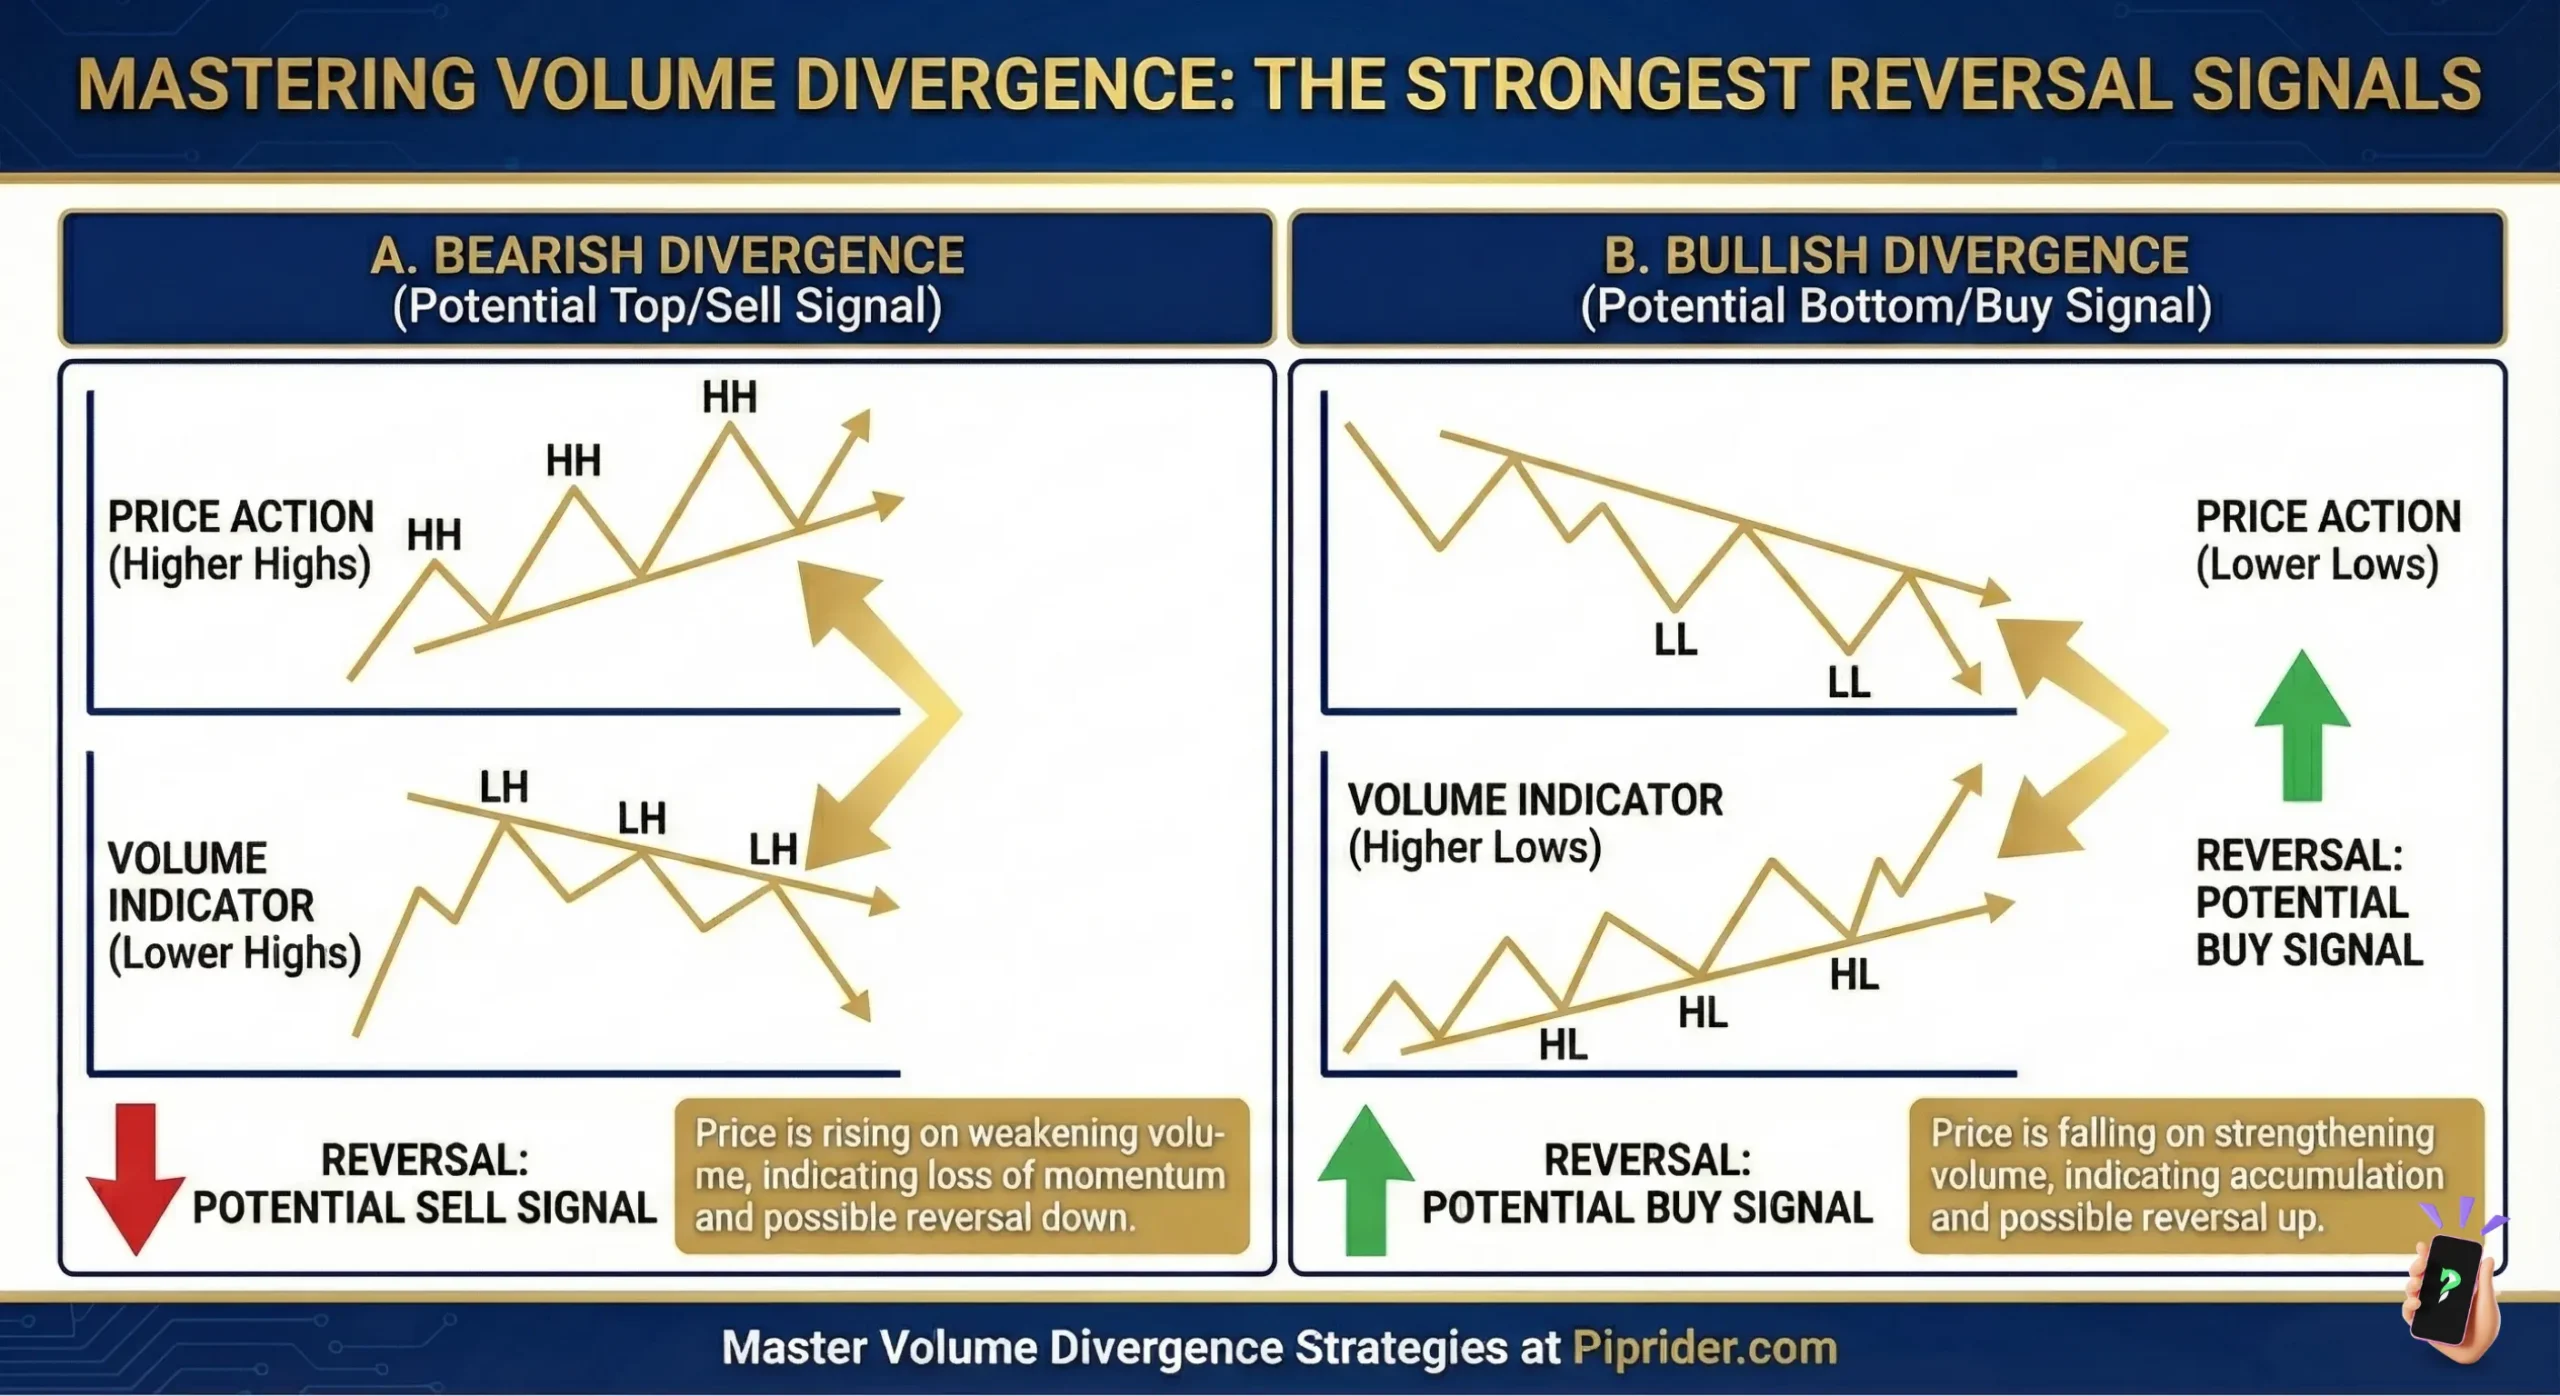
- Best use cases: Ideal applications include confirming trend direction, detecting divergences, and validating breakout moves. For instance, if prices increase while OBV declines, it could signal an impending reversal.
- Timeframes: OBV is especially effective on hourly (H1) or longer timeframes, making it well-suited for swing trading. Combining OBV with key support and resistance levels can help pinpoint more accurate entry points.
4.2. Money Flow Index (MFI)
The MFI indicator merges price movements with trading volume to help detect when an asset might be overvalued or undervalued. It’s like a guide for catching reversals before they happen. Traders love it for its clear signals.
- How it works: MFI ranges from 0 to 100. Values exceeding 80 generally indicate an overbought market, whereas readings below 20 imply oversold conditions. When the indicator moves out of these areas accompanied by strong volume, it may indicate a possible reversal.
- Best use cases: Reversal trading and scalping on 5-minute charts. MFI helps traders avoid jumping into trades during choppy markets.
- Timeframes: Best on 5-minute to H1 charts for quick trades. Combine it with candlestick formations to enhance signal reliability.
4.3. Volume-Weighted Average Price (VWAP)
VWAP is popular among day traders as it provides a volume-adjusted reference point for determining fair price levels. On retail forex platforms, VWAP uses tick volume for its calculation, acting like a map for finding the best entry and exit points. This makes it a top pick for the best volume indicator for forex trading, especially for intraday strategies.
- How it works: VWAP computes the volume-weighted average price. When prices rise above the VWAP, it indicates buying momentum; when they fall below, it reflects selling pressure. It serves as a flexible support or resistance level.
- Best use cases: Scalping and intraday trading. Enter long when prices cross above VWAP with strong volume, or short when they dip below.
- Timeframes: Ideal for 1–15 minute charts. Traders used VWAP to time entries during volatile sessions with great results.
4.4. Chaikin Money Flow (CMF)
CMF measures buying and selling pressure by combining price and tick volume, displayed on a scale from -1 to +1. It’s a reliable tool for confirming the strength behind breakouts and shifts in market sentiment. Many traders consider it a standout among the best volume indicators for forex due to its intuitive nature.
- How it works: CMF values above +0.05 show buying pressure, below -0.05 indicate selling pressure. A zero-line crossover signals a potential trade opportunity.
- Best use cases: Scalping and breakout trading on 1–3 minute charts. CMF confirm breakouts when paired with key price levels.
- Timeframes: Best for short-term trades. Use with other indicators like RSI for better accuracy.
4.5. Klinger Volume Oscillator (KVO)
KVO is a unique tool that compares short- and long-term volume trends to spot momentum shifts. It’s perfect for scalpers looking to catch early reversals. This is why it’s often considered one of the top volume indicators in the forex market.
- How it works: KVO uses two moving averages of volume. When the short-term MA crosses above the long-term MA, it’s bullish; below, it’s bearish. Divergences signal potential reversals.
- Best use cases: Quick trades and momentum strategies using 1 to 5-minute timeframes. KVO’s sensitivity helps catch quick market shifts.
- Timeframes: Works best on short timeframes. Pair with price action for stronger signals.
4.6. Which Forex Volume Indicator Is Best for Your Trading Style?
Selecting the optimal volume tool depends entirely on your execution timeframe and strategic objectives. To eliminate the guesswork, use this definitive classification to align the indicator with your specific trading approach:
- Best for Beginners: OBV, MFI
(Prioritizes visual simplicity and straightforward momentum signals). - Best for Trend Confirmation: OBV, CMF
(Validates the underlying structural strength of a directional macro move). - Best for Reversals: MFI, KVO
(Excels at spotting volume divergence and structural market exhaustion). - Best for Breakout Validation: CMF, VWAP
(Confirms institutional backing when the price breaches critical support or resistance). - Best for Intraday & Scalping: VWAP
(Provides highly accurate, dynamic micro-levels for fast execution on 1m-5m charts).
5. How to Use Volume Indicators to Avoid Fake Breakouts
The single biggest account-drainer for retail Forex traders is the “fakeout” (or bull/bear trap). This happens when the price breaks a major support or resistance level, triggering your entry, only to immediately reverse and hit your stop-loss.
To fulfill the promise of validating every breakout, you must treat price action as the “claim” and volume as the “proof.” Here is the exact 4-step framework to filter out retail noise and trade alongside institutional momentum:
Step 1: Mark the Structural Breakout Level
Before looking at any volume data, clearly define your battlefield. Identify a significant support, resistance, or consolidation zone on your chart. Do not anticipate the break; wait for the price to reach this critical boundary.
Step 2: Wait for the Price Break
Patience is key. Wait for a candlestick to physically break and close beyond your marked level. A wick piercing the level is not a breakout; it is a liquidity sweep. You need a solid body closure.
Step 3: Check Volume Confirmation (The Proof)
The moment the price closes outside the zone, immediately consult your volume indicators to validate the move:
- If using CMF: The indicator should show a strong surge. A bullish breakout requires a reading decisively above +0.05, while a bearish breakdown needs a reading below -0.05.
- If using OBV: The OBV line should break its own corresponding resistance or support level simultaneously with the price, confirming that heavy accumulation or distribution is driving the move.
- If using VWAP (Intraday): The breakout candle should push cleanly away from the VWAP line, showing that buyers (or sellers) are aggressively taking control of the session’s fair value.
Step 4: The Fakeout Filter (When to Walk Away)
This is the most important step. If the price breaks a major level, but your CMF is flat, your OBV is diverging, or tick volume is noticeably low, do not enter the trade. A breakout on low volume is a trap engineered to capture retail liquidity. If the volume signal is weak, walk away and protect your capital.
6. Best Indicator Combinations: Building a Complete System
Professional traders rarely rely on a single volume indicator in isolation. To eliminate false signals and build a robust trading edge, you must pair volume data with price action and structural market levels. Here are the highest-probability combinations used on professional trading desks:
- OBV + Support/Resistance (The Hidden Accumulation Setup): Volume must validate structural levels. If the price is testing a major resistance zone but the OBV is already breaking out to new highs, it signals hidden accumulation—expect the resistance to break. Conversely, if price hits resistance and OBV drops, expect a harsh rejection.
- VWAP + Session Structure (The Intraday Momentum Setup): VWAP is most powerful when anchored to the opening of major trading sessions (London or New York). A price crossing above the VWAP during the London open, while simultaneously breaking the Asian session high, is a classic high-probability momentum entry.
- CMF + Breakout Levels (The Institutional Validation Setup): A visual price breakout means nothing without financial backing. When the price breaches a critical consolidation zone, check the CMF. A reading strongly above +0.05 (for longs) or below -0.05 (for shorts) confirms the breakout has genuine institutional pressure behind it, rather than just being a retail trap.
- MFI + Candlestick Reversals (The Exhaustion Trigger): An MFI reading in the overbought (>80) or oversold (<20) territory is not an automatic entry command. You must wait for a definitive price action trigger—such as a sharp Pin Bar rejection or an Engulfing candlestick—to confirm that the reversal has actually begun.
- KVO + Price Action Shifts (The Early Trend Setup): The Klinger Oscillator provides excellent early crossover signals, but it can be noisy. To filter out false whipsaws, only execute a KVO crossover when it directly aligns with a structural shift in price action, such as the formation of a clear higher-low (in an emerging uptrend) or a lower-high (in a downtrend).
7. The Biggest Problem With Forex Volume Indicators
To build a truly robust trading strategy, we must address the fundamental limitation of volume data in the foreign exchange market. Understanding this limitation is what separates amateur retail traders from professionals.
Here is the reality of how Forex volume actually works:
- The Decentralized (OTC) Reality: Unlike the stock market (e.g., NYSE) or futures markets, Forex is an Over-The-Counter (OTC) market. There is no central exchange or global clearinghouse that records every single transaction. Therefore, a “true” global volume measurement simply does not exist.
- Tick Volume vs. Real Volume: Because there is no centralized data, the volume bars you see on retail platforms (like MT4, MT5, or TradingView) represent Tick Volume, not real exchange volume. Tick volume merely counts how many times the price changed (ticked up or down) during a specific timeframe. It does not measure the actual number of lots or the financial size of the orders traded.
- The Proxy Concept: Does this mean Forex volume indicators are useless? Absolutely not. Research by institutional experts, such as Caspar Marney (former UBS trader), confirms a high correlation (often exceeding 90%) between tick activity and actual traded volume. Within a $9.6 trillion daily market, tick volume remains the most accurate estimate available to retail participants for identifying institutional footprints.
When you accept that Forex volume indicators are measuring activity frequency rather than contract size, you stop looking for perfect mathematical guarantees and start using them correctly: as powerful confirmation tools for your price action analysis.
8. When Forex Volume Indicators Are Weak (When Not To Use Them)
Knowing when to ignore your indicators is just as critical as knowing when to follow them. Because Forex volume is driven by tick activity, these tools lose their predictive edge in specific market environments. To protect your capital and maintain a high win rate, absolutely avoid relying on volume indicators under the following conditions:
- The Dead Asian Session: Without a major economic catalyst (such as a Bank of Japan announcement), the mid-Asian trading session typically suffers from extremely low volatility. Tick volume drops drastically, causing indicators to flatline or produce meaningless, weak signals.
- Pre-News and Post-News Whipsaws: Minutes before high-impact data releases from the U.S. Bureau of Labor Statistics (BLS), such as Non-Farm Payrolls (NFP) and the Consumer Price Index (CPI), institutional liquidity is often pulled from the market. Immediately after the release, algorithmic high-frequency trading (HFT) spikes heavily distort the volume profile. Volume indicators cannot process these instant fundamental shocks.
- Noisy Lower Timeframes in Ranging Markets: Dropping down to the 1-minute or 3-minute chart during a choppy, directionless market amplifies “noise.” In a tight consolidation, volume oscillators will rapidly flip back and forth, generating endless false signals and “whipsaws” with no actual momentum behind them.
- Poor Broker Feed Quality: Because retail Forex volume is derived entirely from broker-specific tick data, your volume indicator is only as good as your broker’s price feed. If you are trading with a broker that provides a low-quality, heavily filtered, or lagging data feed, your volume readings will be inherently flawed and untrustworthy.
By stepping aside during these low-probability environments, you eliminate the vast majority of fakeouts that trap amateur retail traders.
9. Tips for maximizing volume indicator effectiveness
To get the most out of the best forex volume indicators, you need a smart approach. These tips will help you use them effectively and avoid common pitfalls.
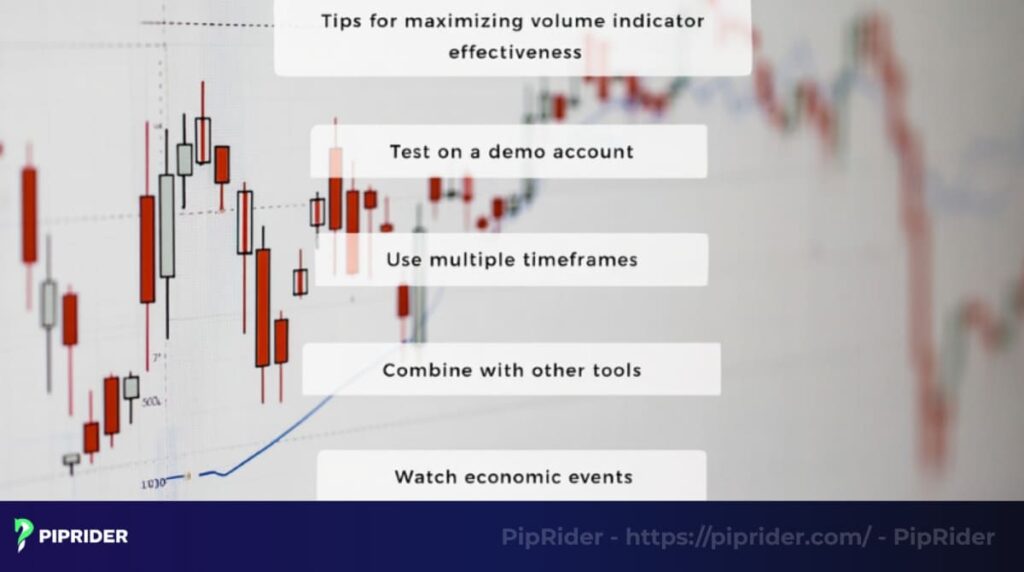
Here’s how to sharpen your trading game.
- Test on a demo account: Practice with indicators like OBV or VWAP in a risk-free demo environment first. This builds confidence before you trade with real money. This step saves traders from costly mistakes.
- Use multiple timeframes: Check volume signals on both short (1–5 minute) and longer (H1+) charts to filter out noise. For example, scalping works better on short timeframes, while trends need H1 or higher.
- Combine with other tools: Pair volume indicators with RSI, MACD, TSI (True Strength Index) or candlestick patterns for stronger signals. This reduces the chance of acting on false moves.
- Watch economic events: High-impact news like non-farm payrolls can spike volume, affecting indicators. Check an economic calendar to stay prepared.
10. Frequently Asked Questions about Forex Volume indicators
Got questions about the best forex volume indicators? This section answers common queries to help you understand and use these tools effectively. Let’s clear up the confusion with straightforward answers.
14. Conclusion
The best forex volume indicators, like OBV, MFI, VWAP, CMF, and KVO, are powerful tools for smarter trading. They help you confirm trends, spot reversals, and time entries with confidence. Pairing these indicators with disciplined risk management makes a huge difference in avoiding bad trades.
At Pip Rider, our blog offers practical guides like this to help you navigate forex trading. Check out our technical indicators list for more tools or the “For Beginner” section if you’re just starting out.
Infographic Section
-
Top Forex Volume Indicators Comparison -
Volume Divergence -
3 Volume Strategies by Trading Style


