
Have you ever trusted a Bollinger Band breakout, only to watch the price spike and immediately reverse? That volatility “noise” is exactly why many experienced trend traders eventually switch to the Keltner Channel.
Think of the Keltner Channel as a smoother, more disciplined alternative to Bollinger Bands. Because it uses Average True Range (ATR) rather than standard deviation, it excels at filtering out the fakeouts that trap most traders. This guide goes beyond definitions: we will compare these two tools head-to-head and hand you the exact, rule-based strategies you need to ride trends with confidence in 2026.
Key Takeaways
- The Keltner Channel uses the Average True Range (ATR) for its calculation, making it a smoother and often less noisy trading indicator than the standard deviation-based Bollinger Bands.
- Its primary strength is in identifying and following stable trends. This makes it a powerful visual aid for determining the market’s trend direction.
- The most reliable methods involve trading trend-following breakouts (with volume confirmation) or buying pullbacks to the middle EMA line.
- Never use it in isolation. Always confirm Keltner Channel signals with a second tool, such as the RSI, MACD, or a volume indicator, to increase accuracy.
1. What is the Keltner Channel?
The Keltner Channel is an envelope-style, volatility-based indicator that wraps around the price on your chart. Its width expands or contracts based on market volatility, and its primary job is to help you identify the trend direction and spot potential trading opportunities.
The Keltner Channel indicator was introduced by grain trader Chester Keltner in his 1960 book How to Make Money in Commodities (Keltner, 1960). It was later refined by trader Linda Bradford Raschke, who popularized the modern version using the Exponential Moving Average (EMA) and the Average True Range (ATR) (Raschke, 1995).
Core components:
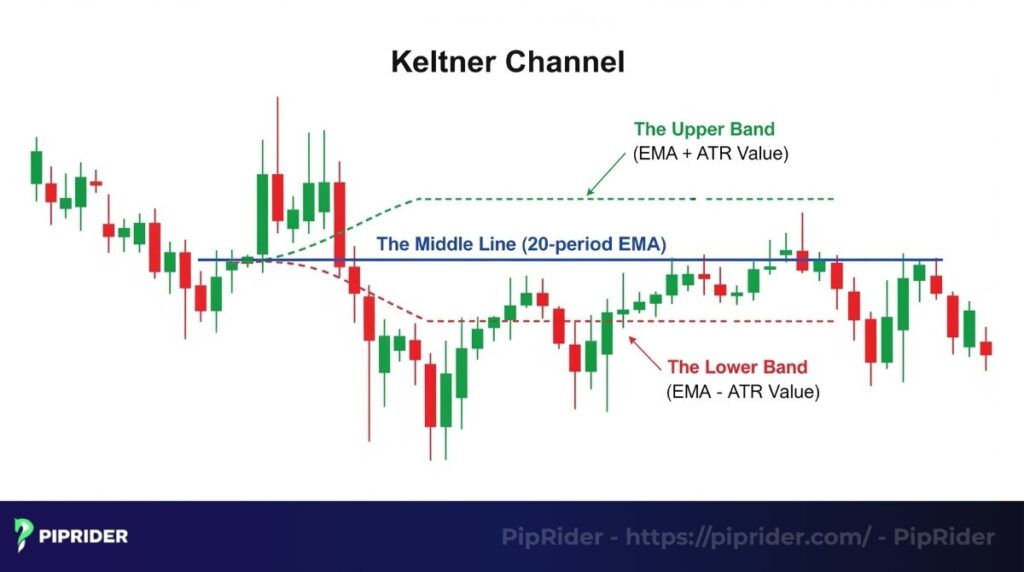
- The Middle Line: An Exponential Moving Average (EMA) of the price, typically with a 20-period setting. This acts as the baseline for the trend.
- The Upper Band: The line is plotted by adding a specific ATR-based value to the middle line (EMA).
- The Lower Band: This line is plotted by subtracting that same ATR-based value from the middle line (EMA). The use of ATR is what makes it unique, as it measures true volatility.
This indicator provides a dynamic map of the market’s “normal” price range. The bands often function as shifting areas of support and resistance. Price action consistently in the upper half confirms an uptrend, while movement in the lower half signals a downtrend, making it an invaluable visual guide.
2. How the Keltner Channel works and its formula
The mechanics of the Keltner Channel are straightforward yet powerful. It constructs a dynamic envelope around price action by fusing two distinct market forces: Trend (via the EMA) and Volatility (via the ATR).
This combination allows the channel to adapt instantly—turning up or down with the trend, and expanding or contracting based on market activity.
2.1. The core components explained
The Central Trend Line: Exponential Moving Average (EMA)
The “spine” of this indicator is the 20-period EMA. Unlike a simple moving average (SMA) which treats all data equally, the EMA applies more weight to the most recent prices.
- Why it matters: This weighting allows the Keltner Channel to react faster to trend changes, giving you earlier signals than older, lagging indicators.
The Volatility Engine: Average True Range (ATR)
The ATR is what sets this tool apart from Bollinger Bands. Instead of using standard deviation (which creates an elastic, rubber-band effect), the ATR measures the “true” volatility by calculating the absolute range of price movement, including price gaps from the previous close.
- High ATR: The channel widens, indicating a volatile market where you need wider stops.
- Low ATR: The channel contracts, indicating a quiet market or “squeeze” potential.
2.2. The formula for the three lines
Putting it all together, the Keltner Channel plots three lines on your chart based on these simple formulas:
Middle Line = EMA (typically 20 periods)
Upper Band = EMA + (ATR Multiplier × ATR)
Lower Band = EMA − (ATR Multiplier × ATR)
2.3. The Industry Standard Settings
While you can tweak the settings, it is crucial to start with the baseline used by institutional analysts to ensure you are seeing the same market map as everyone else.
⚙️ Default Configuration (Modern Version)
- Middle Line (Basis): 20-period EMA (Exponential Moving Average)
- ATR Period: 10 (or 20)
- Multiplier: 2.0
Source: According to technical analysis resources like StockCharts, this combination of EMA and ATR offers the best balance between trend sensitivity and noise filtering (StockCharts, n.d.).
2.4. Important distinction: Original vs. Modern Keltner
If you read older trading books, you might find a different formula. This often causes confusion for beginners. Here is the nuance you need to know to avoid “formula fights” in forums:
- The Original (1960): Invented by Chester Keltner in his book How To Make Money in Commodities. It used a 10-day Simple Moving Average (SMA) and calculated bands using the High-Low range. It is generally slower and less responsive to recent price action.
- The Modern (1980s): Refined by famous trader Linda Bradford Raschke. She introduced the Exponential Moving Average (EMA) and the Average True Range (ATR).
💡 Why it matters: Almost all modern charting platforms (TradingView, MT4/5) use Linda Raschke’s modern version by default because the EMA responds faster to price changes, and the ATR captures volatility more accurately than the simple High-Low range.
3. How to use Keltner Channel in trading
To effectively use the Keltner Channel, traders must analyze the channel’s slope and the price’s interaction with the bands. Functioning as dynamic support and resistance zones, the indicator helps distinguish between a strong trend and a ranging market. The following strategies outline how to translate these visual cues into objective trading decisions.
3.1. Identifying price trends (trend following)
The most intuitive way to use the Keltner Channel is by observing its overall direction. The direction of the entire indicator acts as your visual guide to the trend.
- Uptrend: If the whole Keltner Channel is smoothly angled upwards, and the price is mostly “walking” along the upper band or staying in the top half of the channel, you are in a clear uptrend.
- Downtrend: If the Keltner Channel is pointing downwards and the price is hugging the lower band or staying in the bottom half, it’s a strong downtrend.
A clean, angled channel provides immediate visual confirmation that you are trading in alignment with the dominant market momentum.
3.2. Trading breakouts
Trading breakouts is where the Keltner Channel often outperforms Bollinger Bands. Because it uses ATR, its breakouts tend to be more reliable.
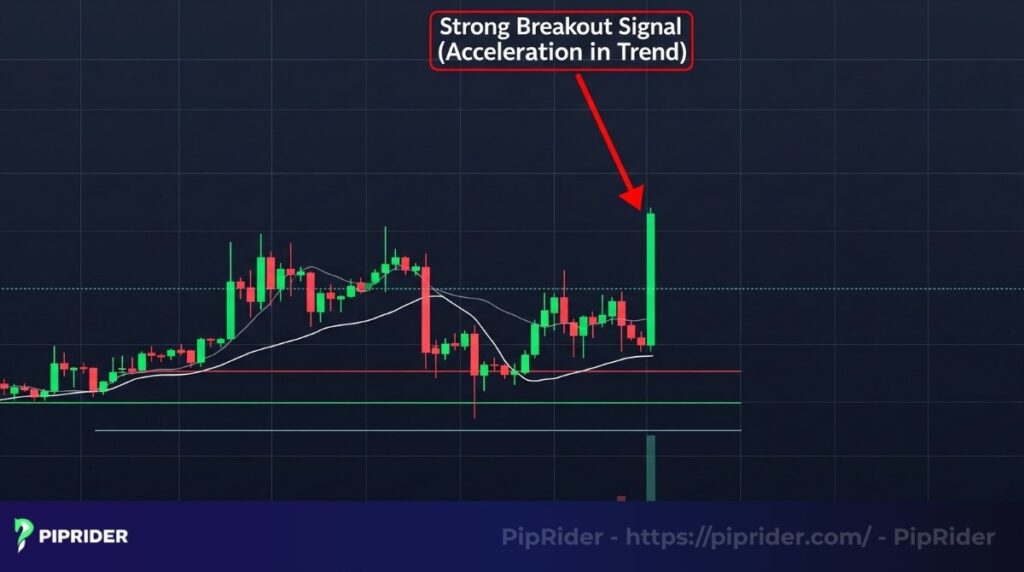
- The signal: A breakout occurs when a candle closes decisively outside of the upper or lower band. A mere wick poking out isn’t enough; we always wait for the full candle body to close outside the line. This confirms real momentum is behind the move.
- How to use it: When we see a strong candle close above the upper band in an uptrend, it signals that the trend is not just continuing but accelerating. This can be a powerful entry signal to jump on board.
3.3. Trading pullbacks to the EMA
Trading pullbacks to the EMA is a more conservative and higher-probability approach. Instead of chasing breakouts, you wait for the price to come back to you.
The setup: In a clear uptrend (channel pointing up), you wait patiently for the price to pull back and touch the middle line (the 20 EMA). This line acts like a magnet or a “home base” for the price.
The entry: The touch of the EMA isn’t the signal itself. The signal is seeing a bullish reaction right at the EMA, like a pin bar or an engulfing candle. This tells you that buyers have stepped in at the average price, and the trend is likely to resume. This is a great area for entry point.
3.4. Filtering noise in a sideways market
Recognizing when to stay on the sidelines is as crucial as identifying a good trade.
The sign: When the Keltner Channel becomes flat and narrow, it’s screaming at you that the market has no clear direction.
Advice: This is your cue to stay out. Trying to trade breakouts is a recipe for getting chopped up by small, meaningless moves. The indicator is doing its job by saving you from low-quality setups.
3.5. Combining with RSI or MACD for extra confirmation
Never rely on just one indicator. The strategy becomes robust when you get confirmation from a different type of tool, like a momentum oscillator.
Confirmation for strong moves: Before entering a push above the upper band, glance at your RSI. Is it strong but not yet extremely overbought? This can add confidence that the move has room to run.
Pullback confirmation: When the price pulls back to the EMA in an uptrend, look at your MACD. Do you see the MACD histogram ticking back up or the signal lines preparing for a bullish cross? This is powerful confirmation that momentum is returning in the direction of the main trend.
4. What is the difference between Keltner Channel vs. Bollinger Bands?
While visually similar as price envelope indicators, Keltner Channels and Bollinger Bands operate on distinct mathematical principles. This comparison clarifies their unique mechanisms and specific use cases, helping you select the appropriate tool for your trading objectives.
4.1. The critical difference: ATR vs. standard deviation
The fundamental divergence between the two indicators stems from their volatility calculation methods. This mathematical difference dictates how sensitively each indicator reacts to price spikes and market noise.
- Bollinger Bands: Bollinger Bands are calculated using Standard Deviation, which measures the variance of price from the mean. Because this formula weights outliers heavily, the bands are highly reactive. A sudden price spike causes immediate expansion, making this tool effective for identifying volatility extremes and “squeeze” setups.
- Keltner Channel: The Keltner Channel utilizes the Average True Range (ATR). By averaging the high-low range over a set period, this calculation inherently smooths out data. Consequently, the bands remain stable during minor price spikes, providing a clearer visualization of the sustained trend direction rather than momentary volatility.
Here is a simple, visual comparison table that summarizes the key differences between the two indicators.
| Feature | Keltner Channel | Bollinger Bands |
|---|---|---|
| Calculation Base | Average True Range (ATR) | Standard Deviation (Std Dev) |
| Band Behavior | Smoother, steady. Ignores minor spikes. | Dynamic, aggressive. Expands/contracts sharply. |
| Primary Strength | Filtering noise & riding trends. | Detecting volatility explosions (The Squeeze). |
| Best Strategy | Trend Pullbacks & Breakouts. | Mean Reversion & Volatility Squeeze. |
| Weakness | Slower reaction to sudden volatility. | Prone to fakeouts in strong trends. |
| Our Verdict | 🏆 Best for Trend Clarity | ⚡ Best for Volatility Play |
4.2. When traders prefer to use the Keltner Channel
The Keltner Channel is the optimal choice for trend-following strategies that require smooth price visualization. It outperforms in these specific scenarios:
- Trend Following: Its primary strength lies in visual smoothness. The bands remain steady during minor corrections, allowing traders to hold positions longer without being shaken out by intraday volatility spikes.
- Pullback Entries: The central EMA line acts as a reliable dynamic support/resistance level. In a strong trend, price action respects this average more consistently than it does a simple moving average.
- Filtering False Signals: By using ATR, the indicator filters out “market noise.” It ignores insignificant price wicks that might trigger a false breakout signal on other volatility indicators.
4.3. When Bollinger Bands might be a better choice
Bollinger Bands are best suited for volatility-based strategies, specifically for catching sudden breakouts or reversals. Use them in these market conditions:
- Volatility Breakouts (The Squeeze): Bollinger Bands excel at identifying periods of extreme contraction (low volatility). This visual “squeeze” is a unique precursor to explosive price moves that Keltner Channels may not highlight as dramatically.
- Mean Reversion (Range Trading): Due to their high reactivity to standard deviation, the outer bands act as elastic boundaries. In a sideways market, a touch of the outer Bollinger Band serves as a potent overbought/oversold signal, suggesting a high probability of reversion to the mean.
4.4. The “TTM Squeeze” Concept: Combining KC and BB for Explosive Moves
You don’t have to choose between the two. In fact, one of the most famous trading strategies of modern times involves combining them. This concept, popularized by trader John Carter (2018) in his book Mastering the Trade (often called the “TTM Squeeze”), uses both indicators to identify periods where the market is building up energy for a massive move.
How to identify the “Squeeze”
Imagine holding a beach ball underwater; the deeper you push it, the faster it shoots up when released. This strategy works the same way.
- The Setup (Energy Build-up): You wait for a period of extremely low volatility. On the chart, the dynamic Bollinger Bands will contract so much that they go completely INSIDE the smoother Keltner Channel bands. This visual cue tells you the market is “squeezing” and energy is coiling up.
- The Trigger (Energy Release): You watch for the moment the Bollinger Bands expand and “pop out” of the Keltner Channel, accompanied by a strong price candle in that direction. This signals that the squeeze has “fired,” and a potentially explosive trend is beginning.
Figure: Visualizing the Squeeze. When the volatile outer bands (Bollinger) move inside the steady inner bands (Keltner), a big move is imminent.
💡Want to master this specific setup? This technique is deep enough for its own guide. Read our detailed breakdown on what is the TTM Squeeze indicator and how to trade it step-by-step.
5. Popular trading methods with the Keltner Channel
Effective trading requires adapting to different market phases. Because the Keltner Channel combines trend direction (EMA) with volatility (ATR), it is versatile enough to execute strategies for both trend continuation and market reversals. This section outlines three systematic, rule-based strategies designed to capture high-probability setups while maintaining strict risk management.
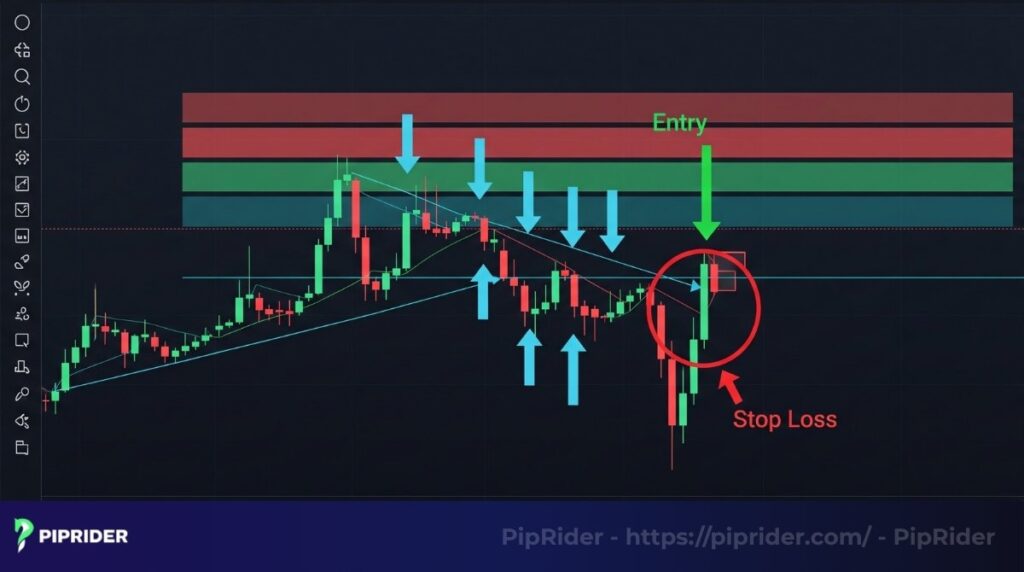
5.1. The Trend Continuation Breakout Strategy
The trend continuation breakout strategy is an aggressive approach designed to catch a trend that is not just continuing but accelerating with force.
The logic: In a strong trend, a decisive close outside the channel isn’t a sign of reversal. Instead, it often signals a burst of momentum and that the “herd” is jumping in. We use this to ride the wave.
The trading rules:
- Trend Filter: The Keltner Channel must be clearly angled up (for buy) or down (for sell). Do not trade if flat.
- Entry Trigger: Wait for a full candle body to CLOSE completely outside the Band.
- Validation (Volume Rule): The breakout must be supported by “smart money.”
- For Stocks: Look for a spike in Real Volume.
- For Forex: Since there is no central exchange, look for a spike in Tick Volume or confirm that the ATR bands are widening (volatility expansion).
- Stop Loss (Invalidation): Place SL just below the Low (for Buy) or above the High (for Sell) of the breakout candle. If price reverses and engulfs this candle, the setup has failed.
- Take Profit (Exit): Use a Trailing Stop along the Middle EMA line. Exit when a candle closes back inside.
⚠️ Important Note for Forex Traders
Since Spot Forex has no centralized exchange, trading platforms only show Tick Volume (frequency of price changes), not true volume. While useful, it can be misleading.
Instead of relying solely on volume, prioritize Momentum. Ensure your RSI is rising (above 50) or the MACD histogram is expanding in the direction of the breakout to confirm “Smart Money” is backing the move.
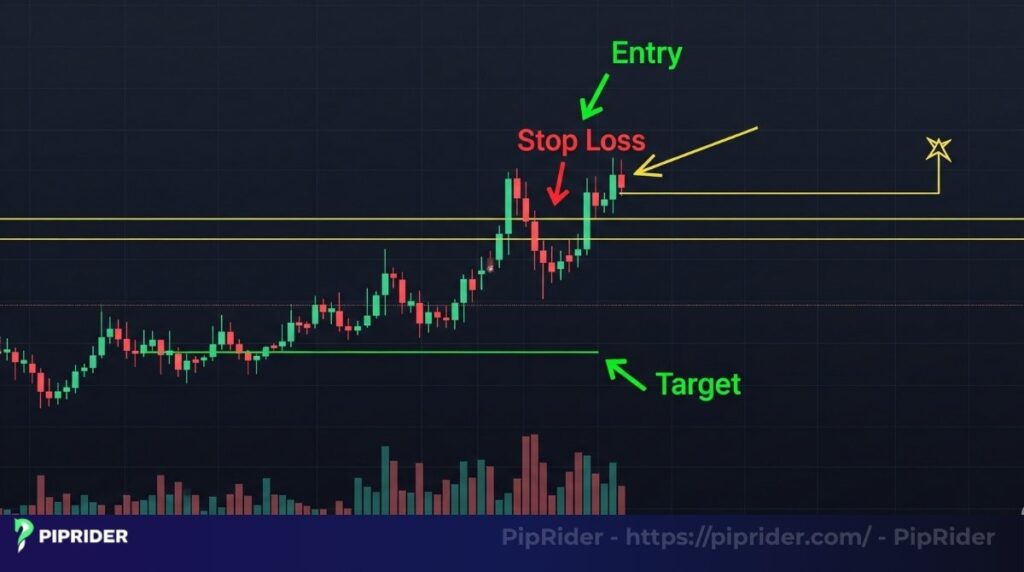
5.2. The EMA Pullback (or Mean Reversion) Strategy
The EMA pullback strategy is our favorite because it’s more conservative and often provides a better risk-to-reward ratio. You aren’t chasing the price; you’re letting it come back to a logical area of value.
The logic: The chart shows that a healthy trend doesn’t move in a straight line. It ebbs and flows. It often pulls back to its average price (the EMA) before continuing. This pullback is viewed as a value opportunity, a chance to enter the trend at a more favorable price.
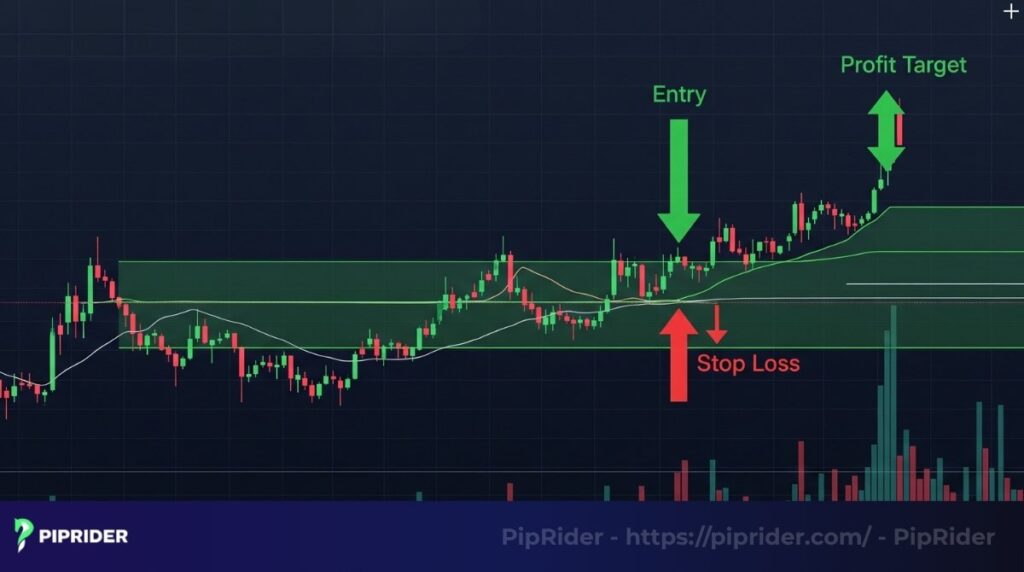
The trading rules:
- Trend Filter: Identify a strong slope. Price should be pulling back against the trend.
- Entry Trigger: Price touches the Middle EMA (20) and forms a Bullish Rejection Candle (like a Pin Bar or Engulfing). Enter immediately on the close of that candle.
- Stop Loss (Invalidation): Place hard SL 3-5 pips below the Low of the rejection candle.
- Take Profit (Exit):
- Target 1: The Upper Band (Conservative).
- Target 2: Move SL to breakeven and trail the rest along the EMA.
5.3. The Sideways Market Reversal Strategy
While the Keltner Channel is best in trends, you can use it in ranging market conditions, but you must be disciplined.
The logic: Based on the chart, when the Keltner Channel is flat, the outer bands represent overextended areas where the price can be considered overbought or oversold. The strategy operates on the expectation that the price will move back toward its average (the middle EMA).
The trading rules:
- Market Condition: The Keltner Channel must be flat and horizontal.
- Entry Trigger: Price hits the Upper/Lower Band but fails to break out, forming a Reversal Candle (e.g., Shooting Star) that closes back inside the channel.
- Stop Loss (Invalidation): Place SL just above the High of the rejection candle.
- Take Profit (Exit): Strictly at the Middle EMA line. Do not be greedy aiming for the other side.
6. The pros and cons of the Keltner Channel
No indicator is perfect, and the Keltner Channel is no exception. Understanding its strengths and weaknesses is what separates a smart trader from one who just blindly applies a tool. Here’s a realistic breakdown.
6.1. The advantages (the good stuff)
Traders value the Keltner Channel for several key strengths that can enhance their market analysis:
- Effective noise filtering: This is its biggest strength. Because it uses the ATR, the Keltner Channel doesn’t overreact to every little price spike. This results in fewer false signals and a much cleaner view of the market, which honestly does wonders for your trading psychology.
- Smooth trend following: The smooth, steady nature of the bands makes identifying and following a trend incredibly intuitive. You can visually see the strength and trend direction without the chaotic expansions and contractions you might see elsewhere.
- Simple interpretation: The logic is straightforward. For instance, an uptrend is clearly defined when the price holds above the middle line while the Keltner Channel itself is angled upward. There are no complex calculations or multiple lines to decipher, making it very beginner-friendly.
6.2. The disadvantages (the reality check)
However, like any technical tool, it has limitations that traders must be aware of to avoid common pitfalls:
- Delayed reaction to market volatility: The same ATR-based calculation that makes the Keltner Channel smooth can also cause it to be slow to react to sudden bursts of volatility, potentially causing you to miss the start of a strong move.
- The absolute need for confirmation: This is non-negotiable. The Keltner Channel is a team player, not a solo star, and relying on it alone for trading decisions is a significant mistake. A signal, for example, needs to be confirmed by a surge in trading volume.
6.3. When you SHOULD and SHOULD NOT use it
Here’s our simple rulebook for applying it:
You SHOULD use it when:
- The market is in a clear, established trend (either up or down).
- You want to trade conservative pullback strategies.
- Your primary goal is to filter out market noise and avoid getting faked out.
You SHOULD NOT use it when:
- The market is moving sideways with choppy, unpredictable price movements.
- You are trying to trade very low-volatility, “dead” markets where the price is barely moving.
- You are trying to scalp news-driven events that cause massive, sudden volatility spikes. Other tools are better suited for that specific job.
7. Common mistakes to avoid when using the Keltner Channel
Let’s talk about mistakes. We’ve made every single one of these when we were starting out, and they are the fastest way to lose confidence in a perfectly good indicator. Avoiding these traps is just as important as learning the strategies.
7.1. Using it in isolation without confirmation
You see the price touch the upper band, and you immediately sell, without any other signal.The reality: Think of the Keltner Channel as a map showing potential areas of interest, not as a GPS that tells you exactly when and where to enter. It shows you where the interesting support and resistance levels are, but it doesn’t tell you when to act. This is especially true in market conditions where price can remain overbought or oversold for extended periods.
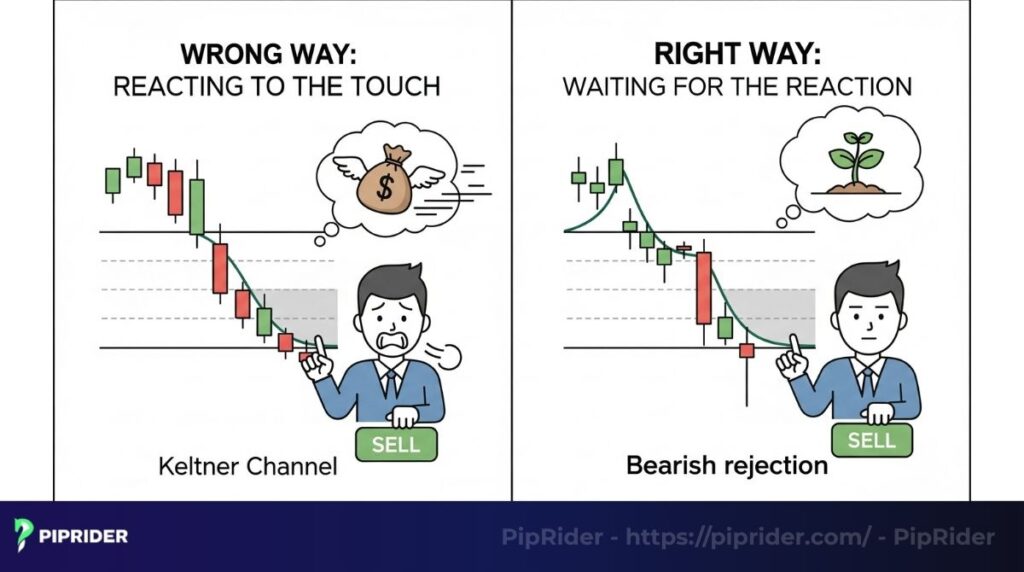
How to avoid it: Make it a rule to always seek a secondary confirmation. A signal needs to be confirmed by Volume. A reversal or pullback signal requires validation from a price action candle (like a pin bar) or an oscillator like the RSI.
7.2. Trying to force a trend in a sideways market
You see the price push out of a flat, narrow Keltner Channel and you jump in, expecting a big trend to start, only to get stopped moments later.
The reality: When the Keltner Channel is flat, it’s telling you the market is in equilibrium and has no desire to trend. Trying to use a trend-following method here is like trying to sail a boat with no wind.
How to avoid it: When the Keltner Channel goes flat, your mindset must change. Either stay out of the market entirely or switch to a short-term, mean-reversion strategy, targeting the middle EMA line instead of a big move.
7.3. Assuming it’s the same as Bollinger Bands
Because they look similar, many traders apply Bollinger Bands strategies directly to the Keltner Channel, such as looking for a “Squeeze” in the same way.
The reality: They are cousins, not twins. They are calculated differently (ATR vs. Standard Deviation) and behave differently. The Keltner Channel is smoother and better for trends, while the BB are more reactive and better for volatility spikes.
How to avoid it: Treat them as two separate tools in your toolbox. Know why you are choosing one over the other for specific market conditions.
7.4. Over-complicating the settings
A new trader will endlessly tweak the EMA period, ATR period, and multiplier, trying to find a “perfect” combination that never loses. The search for perfect customization is often a trap.
The reality: This leads to curve-fitting and a complete lack of consistency. You end up with settings that worked perfectly for last week’s price action but fail in the live market.
How to avoid it: Start with and master the default settings (20, 10, 2). There is no magic number. A profitable method comes from consistent execution, not from finding secret parameters. A useful technique for testing is backtesting.It all boils down to this single piece of advice we wish we had learned sooner:
“A simple tool that you understand deeply is far more effective than a complex one whose nature you don’t grasp.”
8. FAQs – Frequently Asked Questions
Here are some quick answers to the most common questions traders have about the Keltner Channel.
9. Conclusion: Is the Keltner Channel worth a spot on your charts?
If you value clarity over chaos, the Keltner Channel is an essential upgrade to your charts. By using ATR to filter out volatility “noise,” it provides a distinct visual advantage for identifying the dominant trend without getting distracted by minor fluctuations.
However, remember the golden rule of technical analysis: Confluence is key.
Never trade the lines in isolation. To build a robust trading system, always pair the Keltner Channel with a momentum oscillator like RSI or MACD to validate your entries. When you combine trend direction with momentum confirmation, you shift the odds in your favor.
Ready to refine your strategy further? Explore more advanced guides and tools in the Piprider Learn Forex library.


