
Failed breakouts frequently occur when price movements are not supported by the necessary trading volume. The On-Balance Volume OBV indicator is a momentum tool designed to measure cumulative buying and selling pressure within an asset. By tracking this volume flow, OBV helps traders verify the conviction behind a price trend.
This guide provides a direct analysis of the OBV calculation and presents practical strategies for trend confirmation and identifying unreliable price signals.
Key Takeaways
- On Balance Volume uses trading activity to measure buying/selling pressure and anticipate price movements.
- Its core principle is that volume precedes price, so a major change in this indicator can signal an upcoming price move.
- Most powerful signals are trend confirmation and disagreements with price.
- A number from this tool is irrelevant; only its direction and trend matter.
- This indicator should be used as a confirmation tool to validate price action and breakouts, not as a standalone signal.
- Crucial for Forex: Since the Spot FX market is decentralized, OBV relies on “tick volume” (a proxy for activity) rather than actual traded volume. While highly correlated, be aware that signals can vary slightly between brokers.
⚠️ Important: OBV in Forex & The Data Reality
Before applying OBV to currency pairs, traders must understand a critical distinction. Unlike the centralized stock market, Spot Forex is decentralized, meaning there is no single exchange to record the total volume of contracts traded.
- The Proxy Solution: Forex platforms substitute real volume with “Tick Volume”—a count of how many times the price moves up or down per bar.
- Is it reliable? Research suggests that tick volume is highly correlated with actual transaction flow, making it a valid proxy for analysis. However, be aware that this data is broker-dependent. A volume spike on one broker’s feed might appear slightly different on another, so always stick to one reliable data source for your analysis.
1. What is the On Balance Volume OBV indicator?
The On Balance Volume (OBV) is a cumulative momentum indicator that tracks the net flow of trading volume into or out of a financial asset. It provides a visualized representation of the total cumulative buying and selling pressure over a specified period.
The OBV indicator was developed by legendary analyst Joseph Granville in his 1963 book, “Granville’s New Key to Stock Market Profits.” He was one of the first to truly popularize the idea of tracking volume flow as a leading indicator of price (Investopedia, n.d.).
Granville’s core belief was simple yet profound: volume is the fuel that drives the market. A price move that occurs on low transaction levels is suspect and may not have the strength to continue. Conversely, a price move backed by a surge in trading volume is a sign of strong conviction.
The calculation is straightforward: the indicator maintains a cumulative total, adding a day’s activity on up days and subtracting a day’s activity on down days, producing a single line that represents overall buying and selling pressure (StockCharts, n.d.).
2. The On Balance Volume Formula
OBV’s formula is simple, built on a straightforward logic that anyone can grasp, yet provides profound insight.
2.1. The Core Logic
The indicator works by keeping a running total of market activity based on one simple set of rules. Unlike the Accumulation Distribution Indicator, which factors in the intraday High and Low to assess buying pressure, OBV focuses strictly on the closing price to determine conviction:
- Bullish Candle: If the current closing price is higher than the previous close, the entire volume (ticks) for that period is added to the running total.
- Bearish Candle: If the current closing price is lower than the previous close, sellers are in control, so we subtract the volume from the total.
- Flat Candle: If the closing price is unchanged, the OBV line remains flat (volume is ignored).
2.2. The OBV Formula
Based on that logic, the On Balance Volume formula can be written like this:
If Current Close > Previous Close:
OBV = Previous OBV + Current Tick Volume
If Current Close < Previous Close:
OBV = Previous OBV – Current Tick Volume
If Current Close = Previous Close:
OBV = Previous OBV
The OBV line on a chart is simply the result of this calculation being repeated, day after day, creating a cumulative total.
2.3. A Simple Example
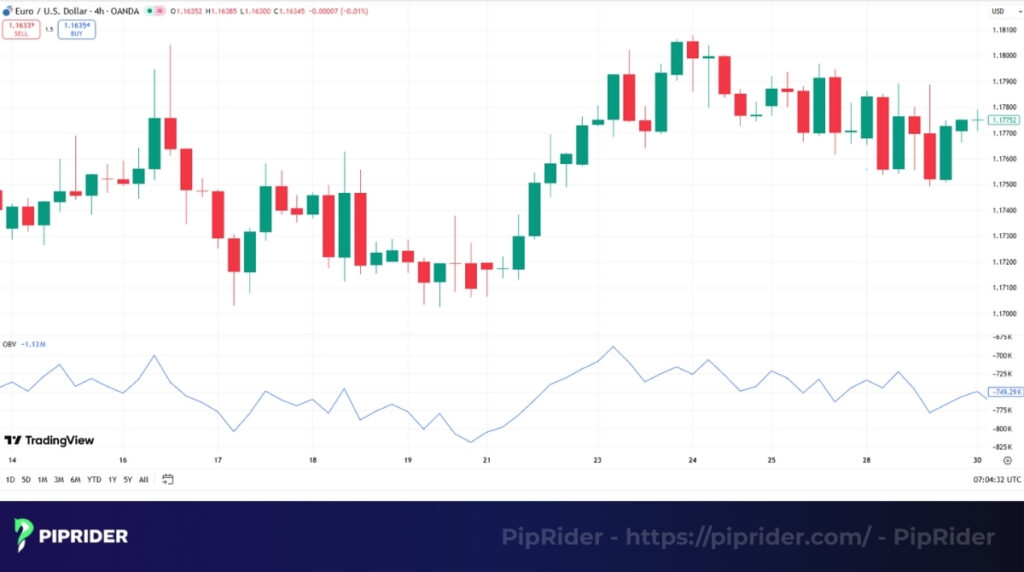
Let’s see how this works on a currency pair like EUR/USD. In Forex, instead of “shares traded,” we use Tick Volume (the number of price changes) as a proxy for activity.
Let’s assume a starting OBV value of 50,000.
| Period (H1) | Closing Price | Trend vs Prev | Tick Volume | Calculation | Resulting OBV |
| Start | 1.0850 | – | – | (Starting Baseline) | 50,000 |
| Candle 1 | 1.0875 | Up | 3,500 | 50,000 + 3,500 | 53,500 |
| Candle 2 | 1.0860 | Down | 2,000 | 53,500 – 2,000 | 51,500 |
| Candle 3 | 1.0860 | Unchanged | 1,500 | 51,500 (Ignore) | 51,500 |
| Candle 4 | 1.0900 | Up | 5,000 | 51,500 + 5,000 | 56,500 |
Interpretation: The final number (56,500) is arbitrary. What matters is the trajectory. Even though price dipped in Candle 2, the strong buying volume in Candle 4 pushed the OBV to a new high, confirming that bullish pressure is dominant on this pair.
3. How to Read and Analyze OBV Signals
Here, the On Balance Volume indicator transitions from a simple line on a chart to a powerful analytical tool. Remember, the line’s actual numerical value is meaningless. Its direction relative to price action is the only thing that matters.
Mastering this volume flow analysis will also help you understand How to Read Accumulation Distribution Indicator, as both tools share the same foundational principles of supply and demand.
3.1. Trend Confirmation: A Basic Check
This is the most straightforward way to use the indicator, and it should become a constant habit. A trader is simply checking to see if volume agrees with the volume-price trend.
- Bullish Confirmation: For a healthy uptrend, both the price chart and the line should create a series of higher highs and higher lows. This alignment indicates that increasing activity is fueling the price increase, signaling a robust and sustainable trend.
- Bearish Confirmation: Conversely, a strong downtrend is confirmed when both price and On Balance Volume are simultaneously forming lower lows and lower highs.
If the indicator isn’t confirming the trend, it’s an immediate red flag that something is wrong under the surface, a key insight into market dynamics.
3.2. Divergences: The Most Powerful OBV Signal
Divergences occur when the indicator’s direction disagrees with the price’s direction. This is often an early warning of a potential reversal.
💡 Pro Tip:
If you find spotting these divergences difficult on a raw line, the Chaikin Oscillator is a derivative tool specifically designed to highlight them visually).
- Bearish Divergence (a sell signal): happens when price pushes to a new high, but the line fails to make a new high. This signals a significant discrepancy. It tells a trader that even though price looks strong, the volume behind the move is weak, suggesting the move lacks broad participation and may be losing momentum.
- Bullish Divergence (a buy signal): forms when the price chart prints a new low, while the line simultaneously carves out a higher low. This is a very positive sign, suggesting sellers are becoming exhausted and buyers are quietly accumulating positions, even as price is falling.
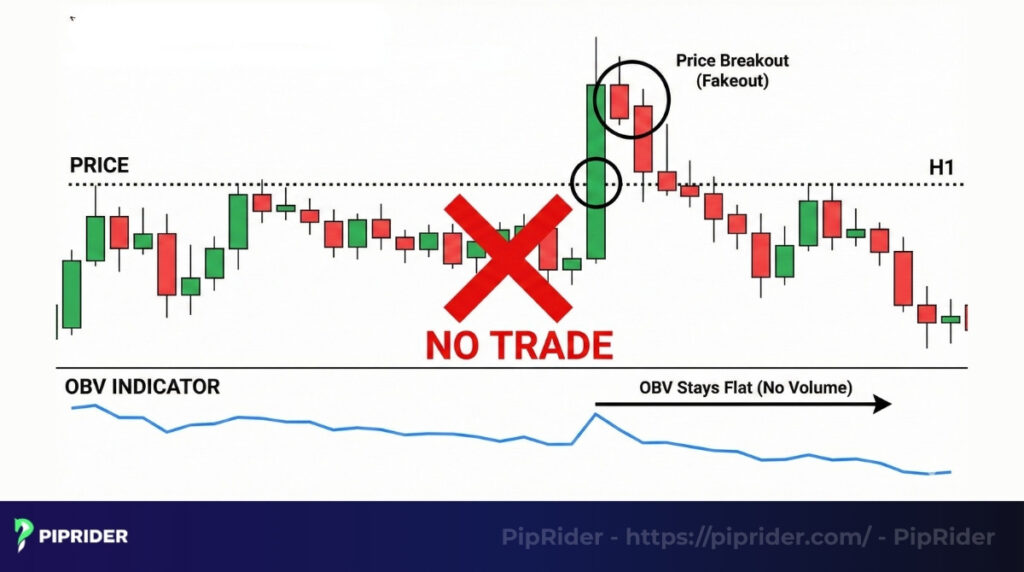
3.3. Breakout Confirmation: Separating Real Moves from Fakeouts
The price dramatically breaks a key resistance level, traders jump in with a buy order, and then it immediately reverses.
The OBV indicator is an effective mechanism for filtering these scenarios. For a breakout to be considered genuine and sustainable, it must be supported by a significant increase in cumulative volume.
The Confirmation Signal:
- Before trading a price breakout, look at the On Balance Volume. Has the line already broken out of its own corresponding trendline or resistance level?
- When the line breaks out ahead of or concurrently with the price, it strongly suggests genuine buying activity is powering the move.
- However, if the price breaks out while OBV remains stagnant or declines, it serves as a major warning sign of a potential fakeout.
4. Four OBV Trading Strategies for the Forex Market
A signal is just an observation; a strategy is a complete plan with rules for entry, exit, and risk management. Here are four simple yet effective ways to incorporate the On Balance Volume indicator into trading.
4.1. The OBV Trend-Following Strategy
Trend-following is the most foundational of all on balance volume trading strategies. It’s designed to ensure a trader is always on the side of dominant volume pressure.
Traders can use the line’s trend as the primary directional filter. If the line is in an uptrend, only look for buy opportunities. If the line is trending down, exclusively search for selling opportunities.
The Rules for a Buy Trade:
- Identify the trend: Traders must first confirm that the line itself is in a distinct uptrend, creating higher highs and higher lows.
- Wait for a pullback: Observe as the market makes a temporary dip, creating a better entry point.
- Entry: Enter a buy trade when the value starts to resume its uptrend, as long as the OBV’s uptrend remains intact.
- Stop loss: Should be positioned underneath the most recent swing low.
Exit Rules:
- Take Profit: Target the most recent swing highs (for buys) or swing lows (for sells) based on price structure.
- Trailing Stop: Trail your stop loss behind each newly formed higher low to lock in profits as the trend continues.
- OBV Exit: Manually close the trade immediately if the OBV line breaks its own trendline support.
4.2. The OBV Divergence Reversal Strategy
This reversal strategy can identify potential trend reversals at an early stage by leveraging its most powerful signal.
A disagreement between price and the indicator is a powerful sign that a trend is exhausted. This strategy aims to enter a trade as the old trend dies and a new one begins.
The Rules for a Bearish Reversal (sell trade):
- Spot the sell pattern: The value must make a new high while the indicator makes a lower high.
- Confirm on chart: This is crucial. Wait for the market itself to show weakness, such as a break of a key support level or a down-trending candle pattern like an evening star.
- Entry: Only take a sell position after the chart has validated the reversal signal.
- Stop loss: Place the stop loss just beyond the recent peak.
Exit Rules:
- Take Profit: Since reversals can be short-lived, target the nearest key Support or Resistance level.
- Risk Management: Move your stop loss to breakeven as soon as the price creates its first new higher high (for buys) or lower low (for sells).
- OBV Exit: Exit if the OBV line fails to follow the price reversal and resumes its original direction (negating the divergence).
4.3. The OBV and Moving Average Combo Strategy
The OBV and Moving Average Combo strategy combines the indicator’s volume analysis with classic trend analysis of a moving average to create a powerful confluence.
Use a moving average to define the primary trend. Then, consult On Balance Volume to validate the strength of the activity behind that trend.
The Rules for a Buy Trade:
- Trend filter: The market must be trading above a 50 EMA.
- Volume confirmation: The indicator’s line must also be in an uptrend, confirming that volume supports the bullish move.
- Entry: Find a buy entry on a pullback to the 50 EMA, but only if the line remains in its uptrend.
Exit Rules:
- Take Profit: Use an open target logic. Allow profits to run as long as price remains on the correct side of the 50 EMA.
- Trailing Stop: Treat the 50 EMA as a dynamic stop loss, trailing your exit just below (for buys) or above (for sells) the moving average line.
- OBV Exit: Close the position if price continues to trend but the OBV line flattens or moves sideways (indicating volume is drying up).
4.4. The OBV Breakout Confirmation Strategy
The breakout confirmation strategy is designed specifically to help minimize the risk of false breakouts. A true price breakout must be supported by a breakout in volume. If trading activity doesn’t participate, the move is likely a trap.

The Rules for a Bullish Breakout:
- Identify: First, identify a key resistance level on your price chart. Draw a similar resistance line on the OBV chart.
- Wait for the OBV breach: Ideally, you want to see the OBV line cross its own resistance ahead of price. This is a leading indicator that buying activity is building up under the surface.
- Entry: You can then enter a buy trade once the price follows through and decisively breaks its corresponding resistance.
- Stop loss: Place your stop loss below the breached level.
Exit Rules:
- Take Profit: Use the “Measured Move” technique: project a target distance equal to the height of the consolidation range prior to the breakout.
- Trailing Stop: Breakouts are volatile. Use a tight trailing stop (e.g., ATR or previous candle high/low) to secure quick gains.
- OBV Exit: Exit immediately if the price breaks out but the OBV line fails to break its corresponding resistance level (Signaling a False Breakout).
5. How to Set Up the OBV Indicator (TradingView & MT4/MT5)
One of the best things about this technical indicator is that, unlike some custom tools, it comes as a standard, built-in tool on nearly every trading platform.
5.1. Setting up OBV on TradingView
For TradingView users, the process is incredibly streamlined.
- Open Indicators: On your chart, click the “Indicators” tab in the top toolbar.
- Search: Type “On Balance Volume” or simply “OBV” in the search bar.
- Select: Choose the version listed under “Technicals” (this is the official built-in version).
- Customize: Once added, hover over the indicator line and click the Gear icon (Settings) to adjust the line color or thickness for better visibility against your background.
5.2. Setting up OBV on MT4 and MT5
Getting it onto your MetaTrader chart is also a simple process that takes less than a minute. The steps are virtually identical for both platforms.
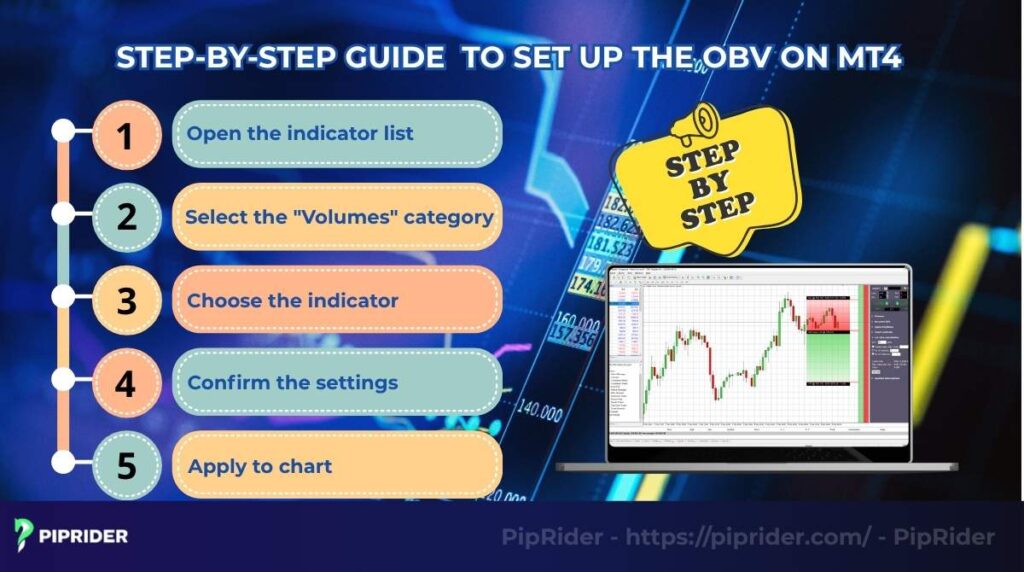
- Open the indicator list: From the main menu, navigate to Insert > Indicators.
- Select the Category: Hover over the Volumes sub-category.
- Choose the indicator: Click on On Balance Volume.
- Confirm the settings: A window will pop up. Since OBV has no period settings, simply go to the “Colors” tab to adjust the line style if needed, then click OK.
6. The Limitations of the OBV Indicator
No tool in a trader’s kit is perfect, and the On Balance Volume indicator certainly has its own set of limitations. Understanding where it can fail you is just as important as knowing its strengths. Ignoring them can lead to costly mistakes.
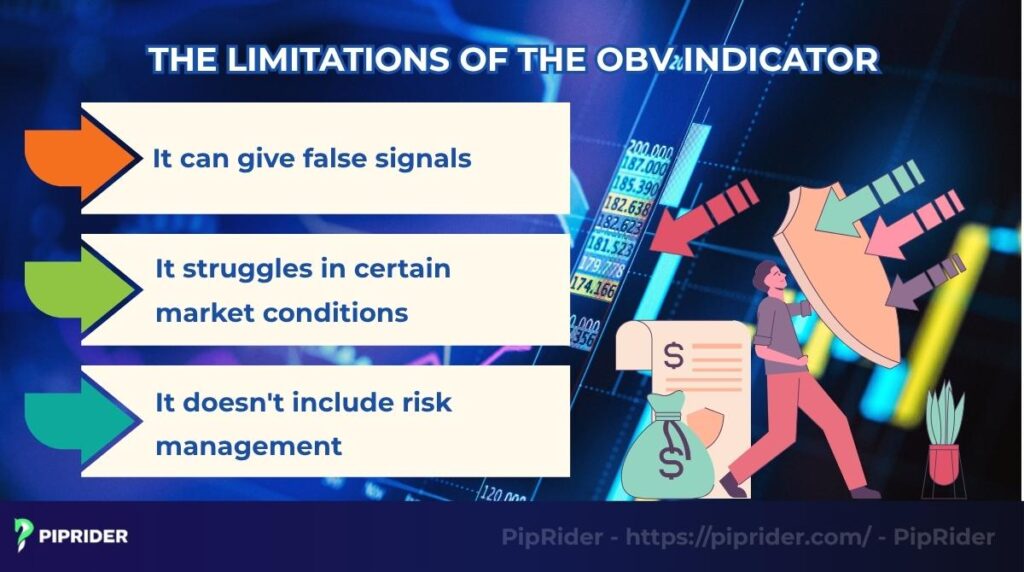
6.1. It Can Give False Signals & Data Discrepancies
The indicator’s calculation is very simple, and this can sometimes be a weakness. A single, massive spike in volume during a news event can throw the line way off, distorting the trend.
The Forex Reality: Furthermore, remember that tick volume is broker-dependent. Since the Forex market is decentralized, the OBV line may look slightly different on different platforms. A breakout signal on one broker might not exist on another, so always use a reliable data feed.
6.2. It Struggles in Certain Market Conditions
The indicator is designed to analyze trends and the volume driving them. Therefore, it tends to lose its predictive value in very low-volume, sideways, or choppy markets.
In these conditions, the line will often just wiggle back and forth without any clear direction. Do not use OBV signals during consolidation.
6.3. It Doesn’t Include Risk Management
The OBV can give a powerful hint about what might happen next (buying or selling pressure), but it tells a trader nothing about where to place a stop loss or when to take profit.
Tip: OBV serves only as a secondary confirmation tool. Core trade parameters (Entry, SL, TP) must be determined by price action analysis or key support/resistance levels.
7. Frequently asked questions about OBV Indicator
Here are some quick, straight-to-the-point answers to questions retail investors see traders ask most often about the On Balance Volume indicator.
8. Conclusion
The On Balance Volume (OBV) is a key volume indicator used to validate the sustainability of price movements by tracking cumulative buying and selling pressure. Its primary utility is trend confirmation, and it must always be combined with structured price action analysis to improve trade reliability and filter out false signals.
The knowledge you’ve gained today is a crucial step in learning to read the market more deeply. To continue building on this foundation, we invite you to follow us here at Piprider and explore our comprehensive Learn Forex category.
Infographic Section
-
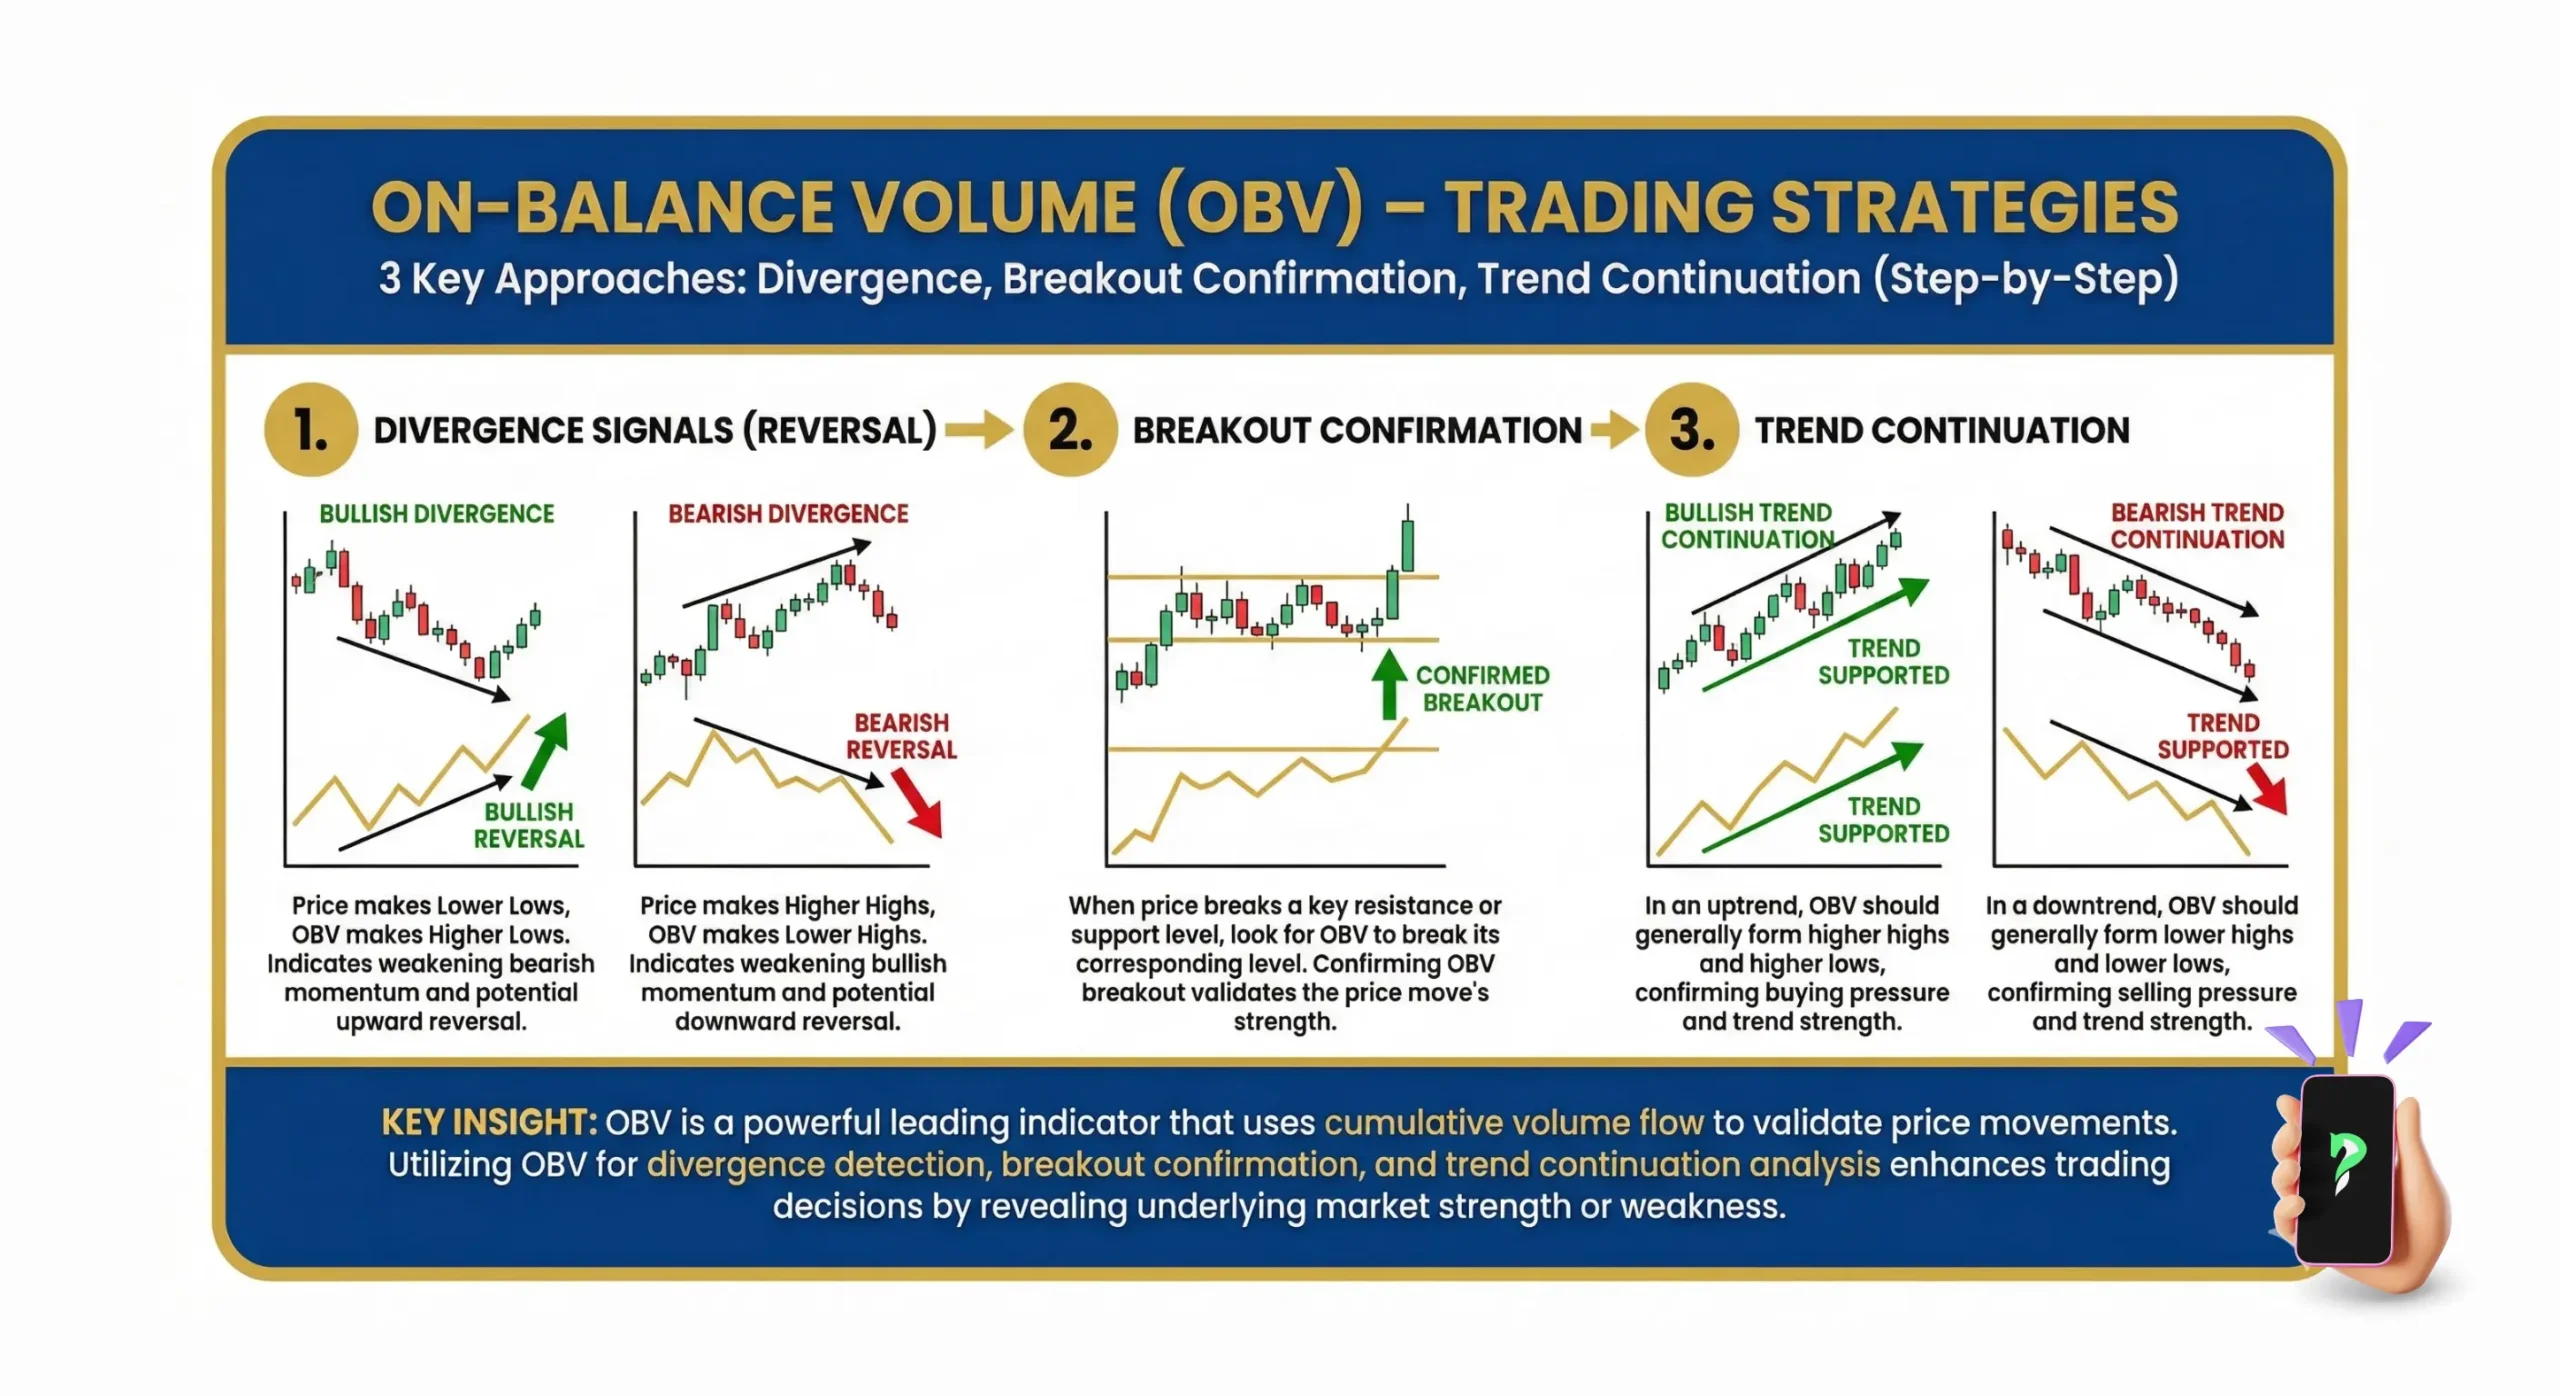
3 key approaches -
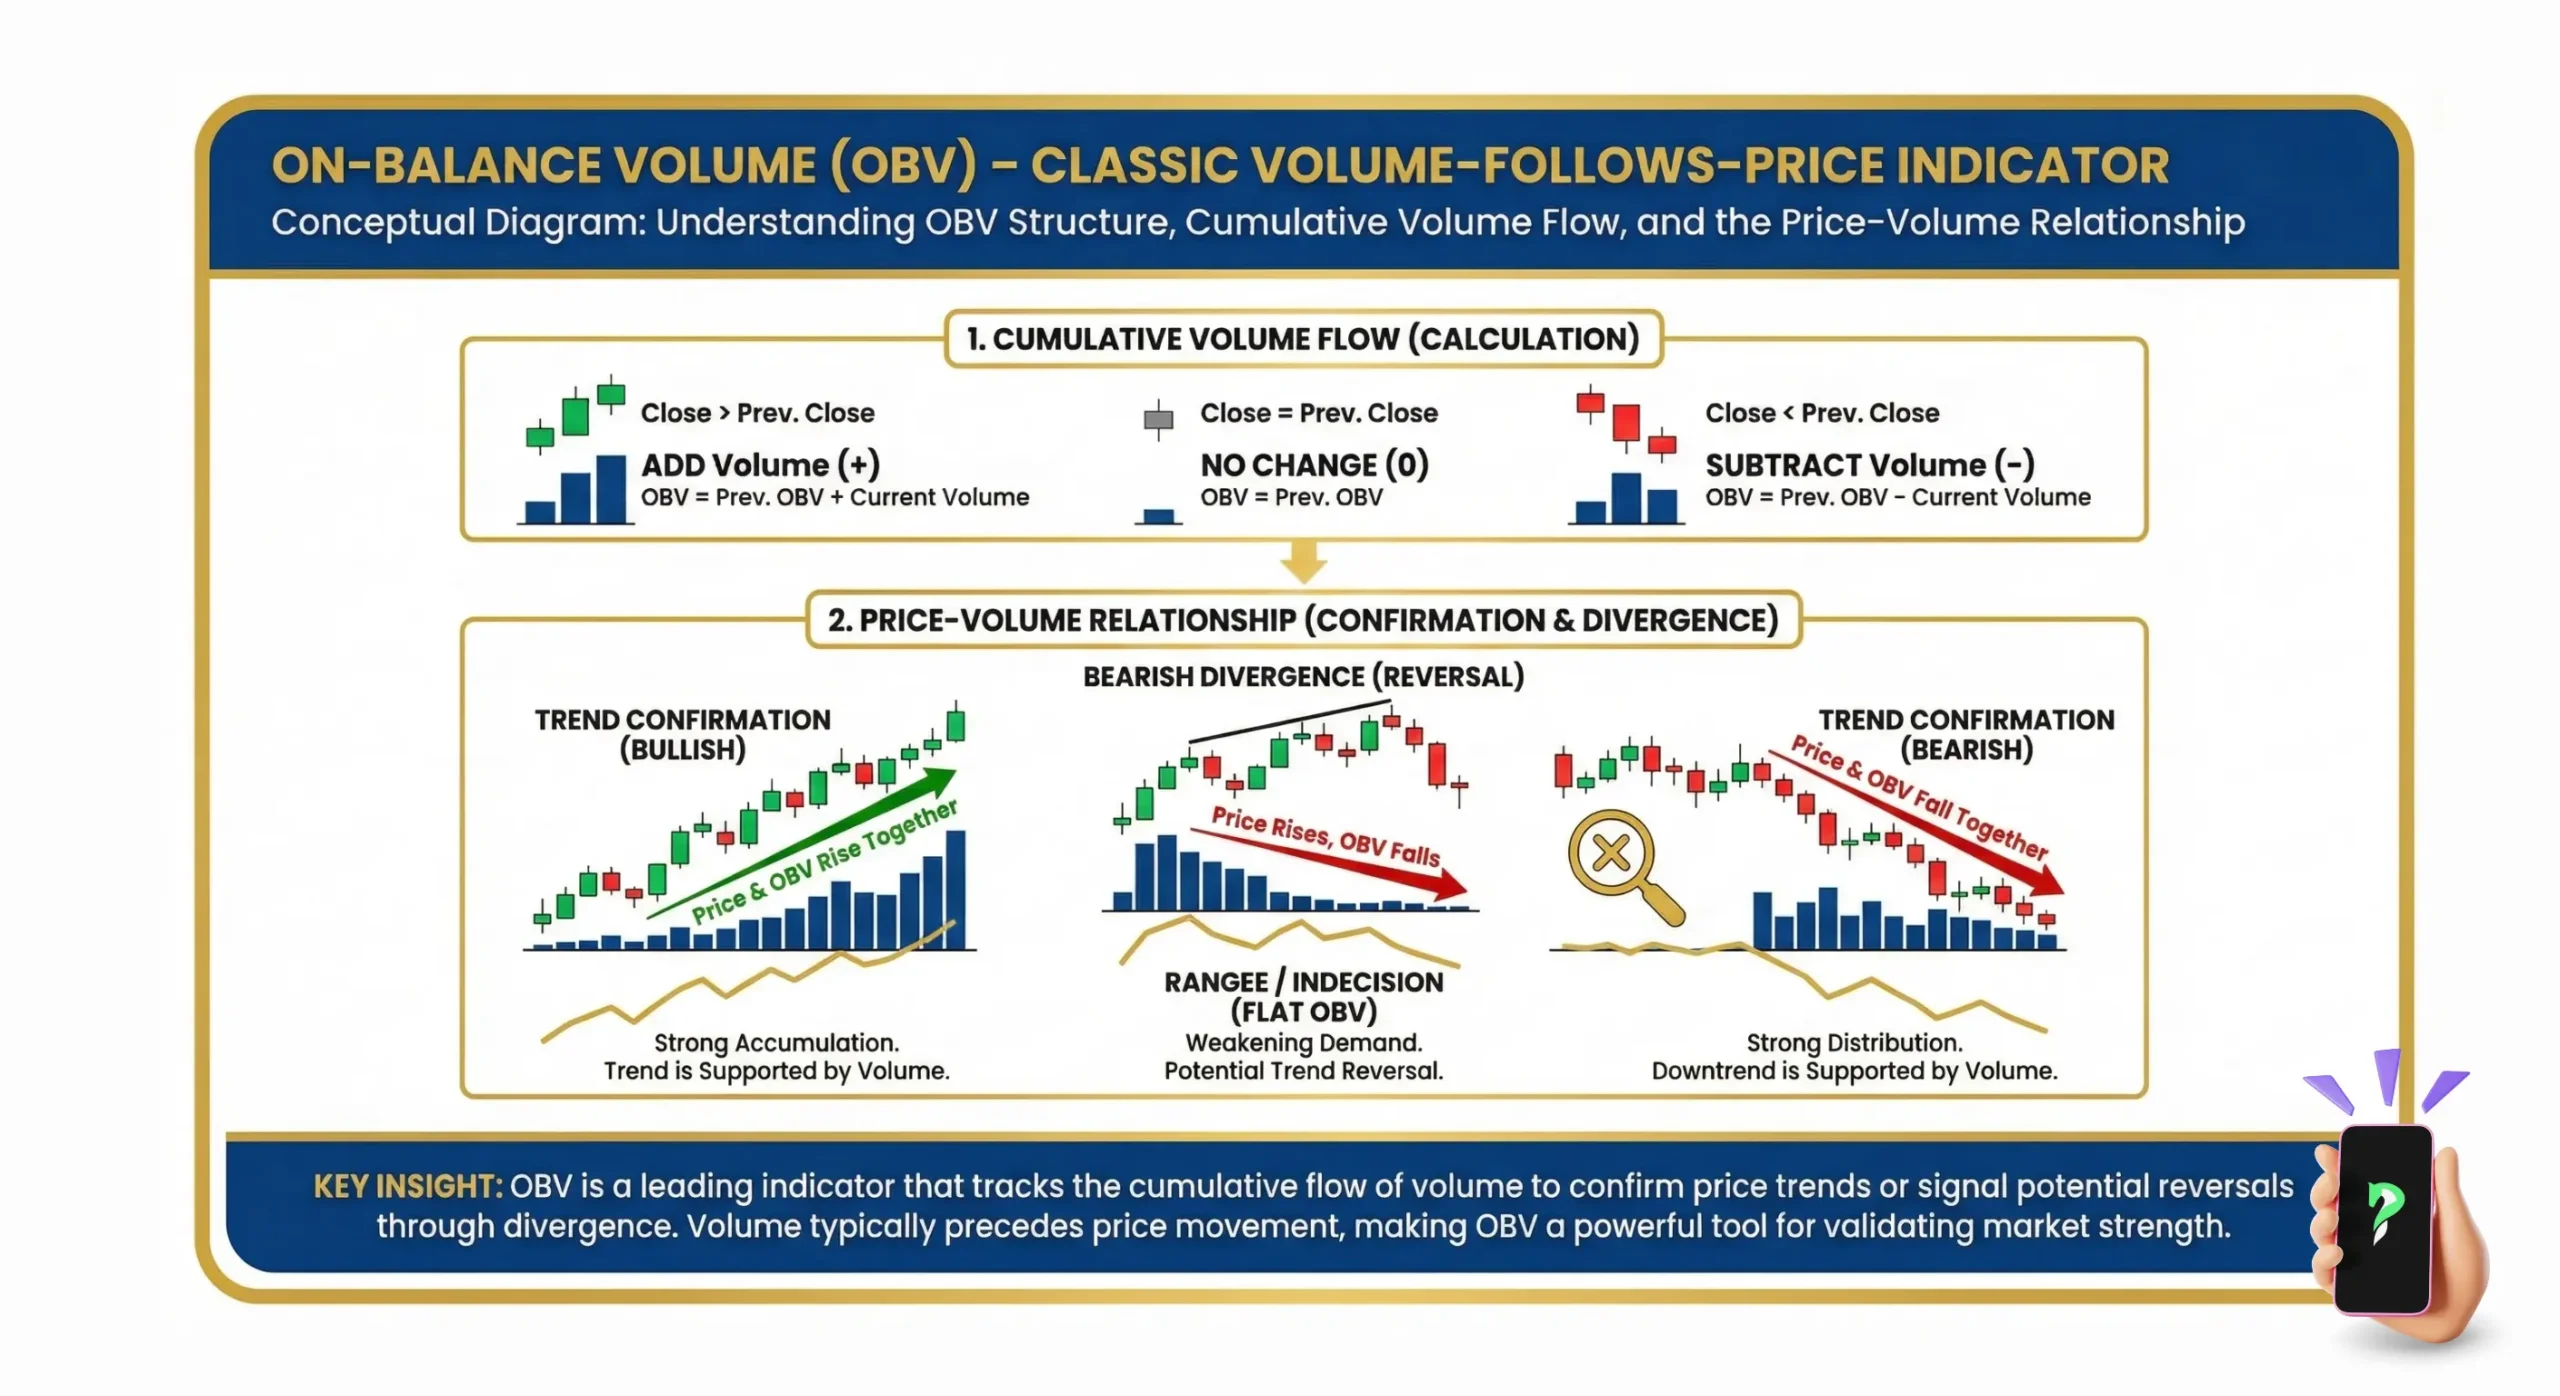
conceptual diagram -
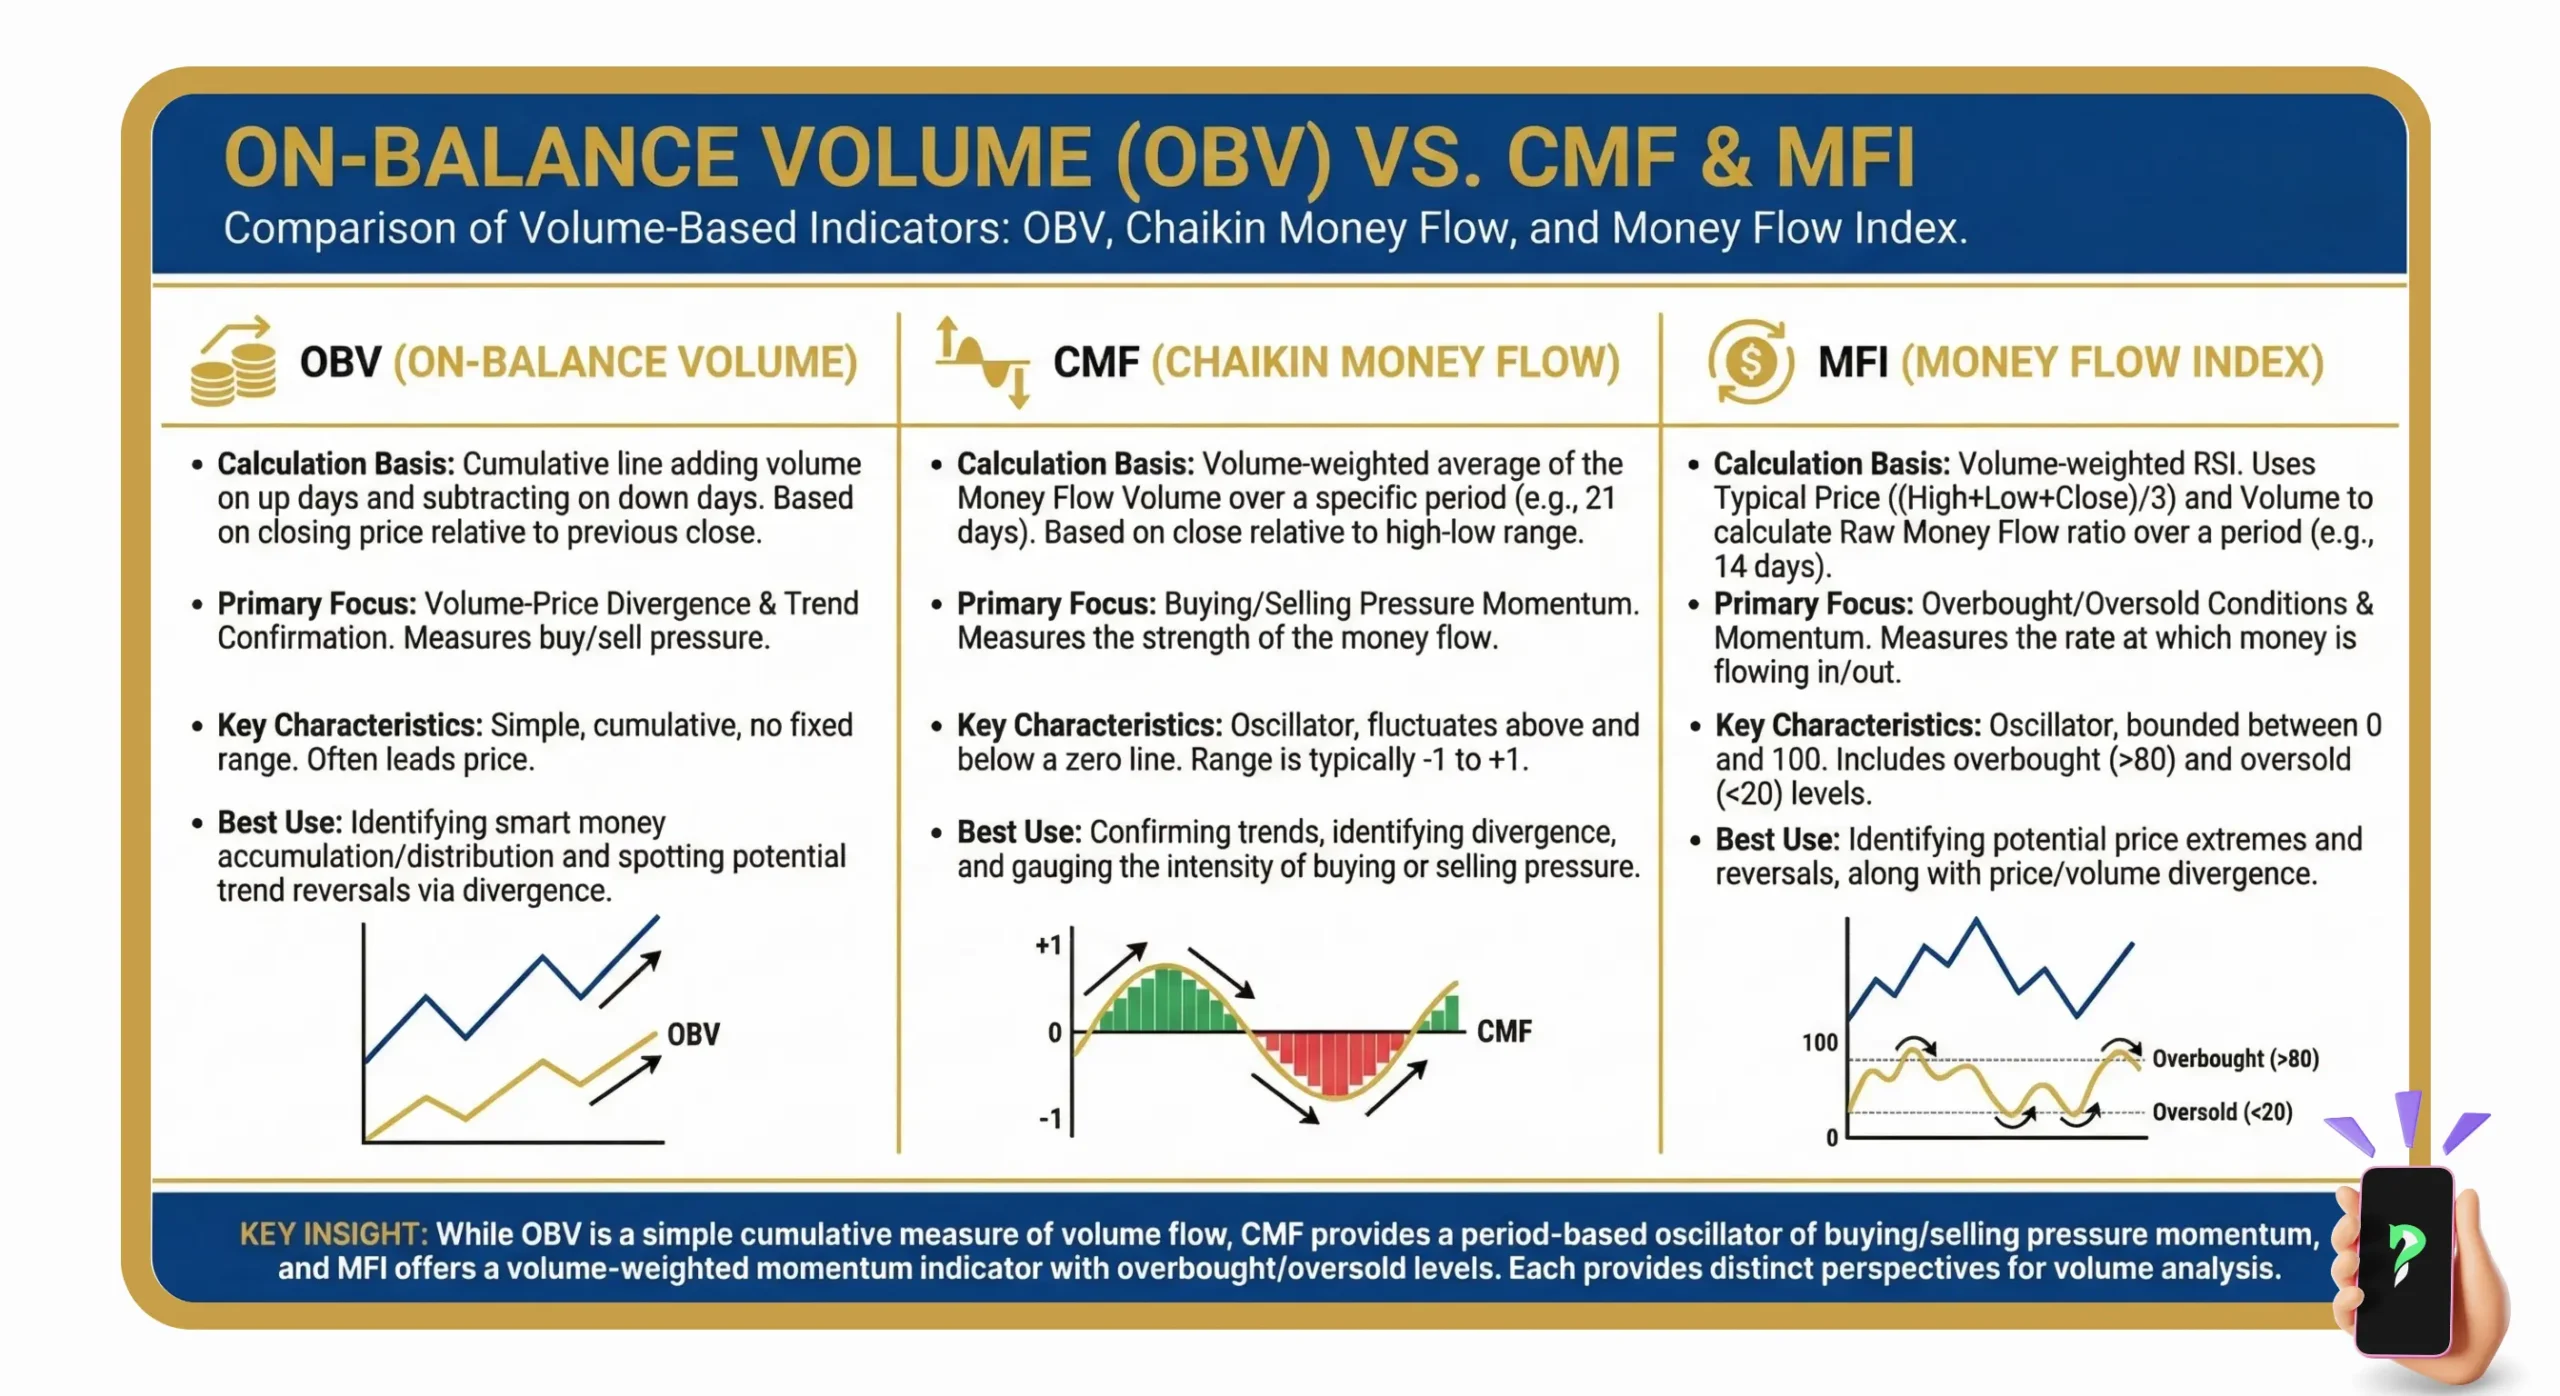
comparision of volume-based indicators


