
Single candlestick patterns are the foundational language of technical analysis. They capture the emotional battle between buyers and sellers within a single trading period, offering clear and immediate insights into market sentiment. Mastering these simple, one-candle formations, such as the Hammer and Doji, is the first step toward reading price action effectively on any candlestick chart.
This guide serves as a comprehensive hub for 9 powerful single patterns, providing the rules, context, and actionable strategies needed for confident trading.
Key Takeaways
- Building blocks: Single patterns are the primary units of price action, offering instant insights into shifting market conviction.
- Dual signals: They signal either potential trend reversals (e.g., Hammer, Shooting Star) or trend continuations (e.g., Marubozu).
- Visual sentiment: A candle’s shape—the ratio of its body to its wicks—reveals whether buyers or sellers dominated the session.
- Context over isolation: Single patterns are prone to whipsaws. Use volume confirmation when reliable (stocks/futures); in spot FX, prioritize price structure, confirmation candles, and higher timeframe (HTF) alignment.
- Risk management: Every pattern defines a clear “failure point,” making them ideal for setting precise, tight Stop Loss levels.
1. What Are Single Candlestick Patterns?
Single Candlestick Patterns are formations consisting of one individual candlestick that provides direct insight into market action over a specific timeframe. They display the relationship between the open, high, low, and closing prices.
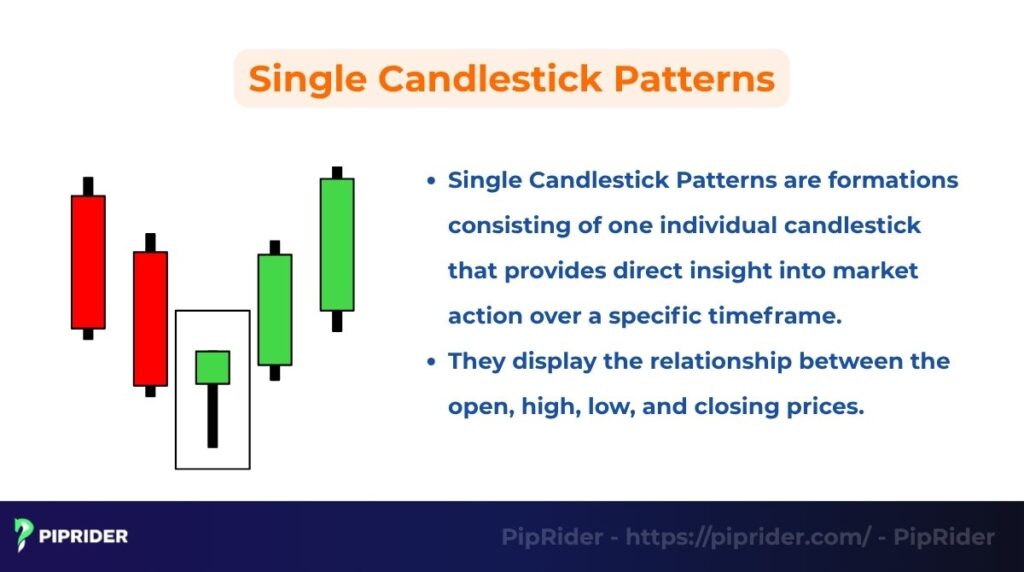
The color and shape of the single candle, specifically the size of its body versus its shadows, tell the story of the market’s internal battle. Understanding these basic building blocks is the starting point for all advanced price action analysis. Single patterns are crucial for technical analysts because they immediately signal shifts in momentum and sentiment. They help traders spot key moments in the trading session.
A single candle can indicate potential trend reversals, strong continuations of the current trend, periods of market indecision, or high volatility. The shape reflects whether buyers (bulls) or sellers (bears) dominated that specific time period. While some single-candle reversal setups, specifically the Hammer and Shooting Star are commonly called pin bars, the term does not apply to all single patterns (such as the Doji or Marubozu).
Single vs. Multi-Candlestick Patterns
The key difference lies in the number of periods required to generate a signal.
- Single Candlestick Patterns: Derive their signal entirely from one trading period (e.g., one day, one hour). They offer speed and simplicity for immediate execution.
- Multi-Candlestick Patterns: (Like the Engulfing or Harami) require two or more consecutive candles to complete the formation. They offer higher confirmation but take longer to appear on the chart.
2. What Does a Single Candlestick Pattern Indicate?
Interpreting single patterns requires understanding that their significance is never universal; it depends entirely on where and how they appear on the chart. They are immediate visual cues that tell traders three critical pieces of information about the market’s current state:
- Market psychology and momentum: The pattern’s shape directly reflects the battle between bulls and bears. Long wicks signal high conviction but failed attempts. In contrast, a long body signals decisive momentum and stronger participation, whereas small bodies (like a Doji) indicate market indecision or a stalemate between supply and demand.
- Trend context and signals: The candle’s meaning relies entirely on its position within the current price trend. A pattern near support/resistance may signal a reversal, whereas one appearing mid-trend (e.g., Marubozu) confirms the current momentum and signals continuation.
- Strategic confirmation: Due to their simplicity, single candles are prone to false signals. Traders should confirm the signal’s validity using external tools like volume and higher timeframe (HTF) alignment. While high volume confirms conviction in centralized markets (stocks/futures), in spot FX, volume is often a proxy (tick volume), so treat it as supportive evidence and prioritize price structure and confirmation closes.
Read more:
Cup And Handle Pattern: Definition, Strategies & Target
Triple Top Pattern: Definition, Formation & How to Trade It
3. Most Common Single Candlestick Patterns
While hundreds of candlestick variations exist, only a handful of single patterns deliver consistent, high-probability signals. Recognizing these fundamental structures is essential for successful trading, as they serve as immediate indicators of momentum shifts.
Summary of Single Candlestick Patterns
| Pattern | Shape Rule (Wick/Body) | Signal | Valid Context | Confirmation | SL Anchor |
|---|---|---|---|---|---|
| Hammer | Lower shadow ≥ 2x body | Bullish Reversal | Bottom of downtrend | Bullish close above body | Below lower wick |
| Shooting Star | Upper shadow ≥ 2x body | Bearish Reversal | Top of uptrend | Bearish close below body | Above upper wick |
| Doji | Open ≈ Close | Indecision | After sustained move | Next candle’s direction | Outside wick high/low |
| Spinning Top | Small body, equal wicks | Indecision | During a trend | Next candle breakout | Outside wick high/low |
| Marubozu | Long body, no wicks | Continuation | Breakouts/Trendmid | Follow-through candle | Opening of Marubozu |
| Hanging Man | Lower shadow ≥ 2x body | Bearish Reversal | Top of uptrend | Bearish close below body | Above the high |
| Inverted Hammer | Upper shadow ≥ 2x body | Bullish Reversal | Bottom of downtrend | Bullish close above wick | Below the low |
| Gravestone Doji | No body, long upper wick | Bearish Reversal | Top of uptrend | Bearish close below open | Above upper wick |
| Belt Hold | Opening has no wick | Continuation | Existing trend | Trend alignment | Pattern opening |
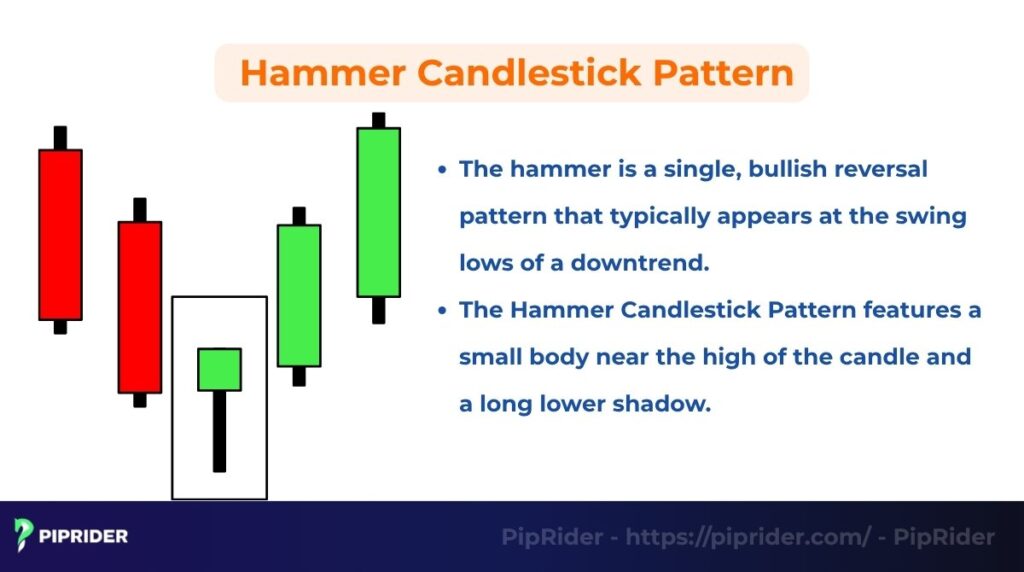
3.1. Hammer Candlestick Pattern
The Hammer is a bullish reversal pattern appearing at the end of a downtrend. It features a small body at the top and a long lower shadow (at least twice the body’s length), showing that buyers successfully rejected lower prices.
Pros & Cons
- Pros: Offers early reversal signals with a tight, well-defined Stop Loss at the low of the shadow.
- Cons: Often generates false signals in sideways markets.
- Confirmation: Do not trade on the Hammer alone. It is validated by a strong bullish confirmation candle and alignment with key support structures.
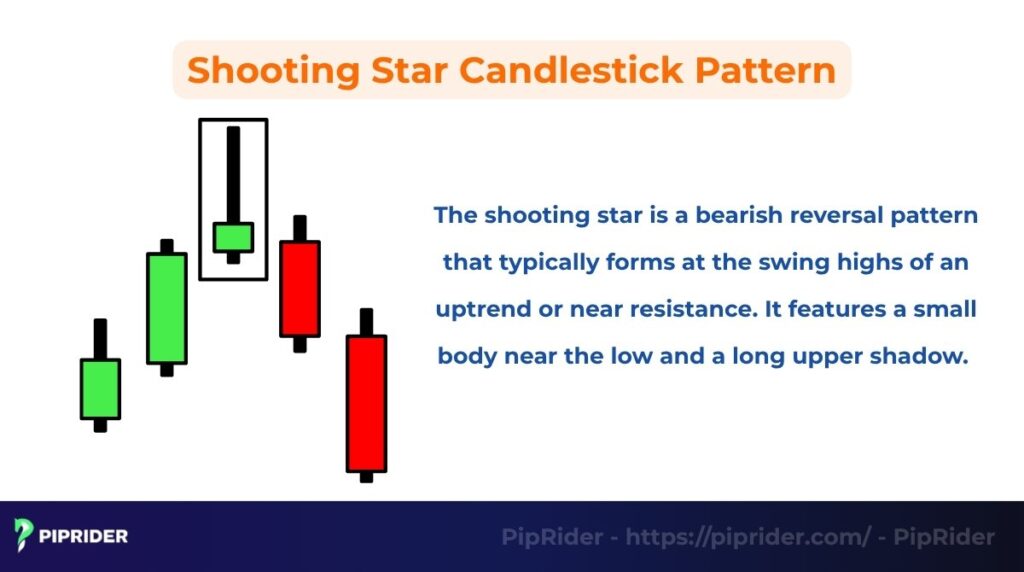
3.2. Shooting Star Candlestick Pattern
The shooting star is a bearish reversal pattern forming at the peak of an uptrend. It has a small body at the bottom and a long upper shadow, signaling that buyers were unable to sustain higher prices as sellers took control.
The upper shadow must be at least twice the length of the real body. This shows buyers were rejected at the high, as sellers immediately overwhelmed them and forced the price back down before the close.
Pros & Cons
- Pros: Provides early warning of trend exhaustion with a precise Stop Loss at the wick’s high.
- Cons: Only reliable after a clear price advance; requires a bearish follow-through candle.
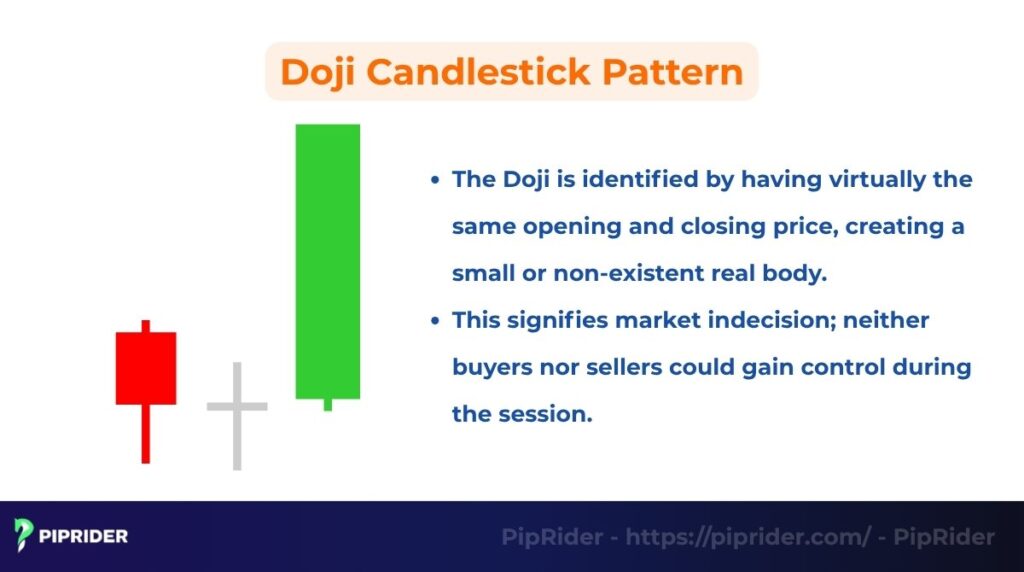
3.3. Doji Candlestick Pattern
A Doji forms when the opening and closing prices are almost identical, resulting in a cross-like shape. It represents a total stalemate between buyers and sellers, signaling market indecision (CME Group, n.d.).
Pros & Cons
- Pros: Excellent for identifying trend exhaustion after long rallies or declines.
- Cons: Low predictive power in choppy markets; requires strong confirmation from the next candle.
- Variants: Standard, Long-Legged, Dragonfly, and Gravestone.
Explore our comprehensive guide to the Long-Legged Doji
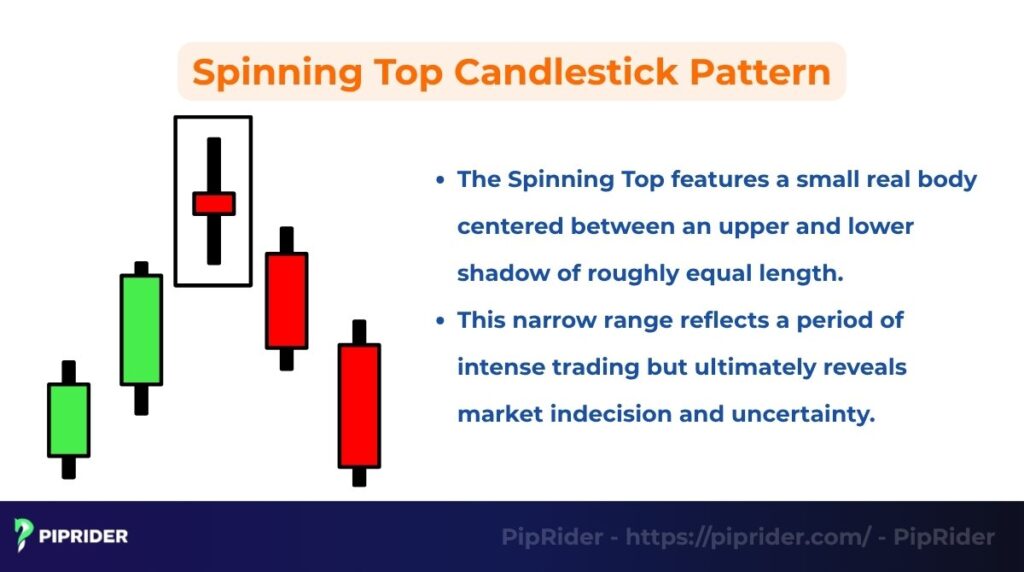
3.4. Spinning Top Candlestick Pattern
Featuring a small body between equal upper and lower shadows, the Spinning Top indicates that both bulls and bears fought aggressively but neither side could gain the upper hand.
Bulls and bears battled aggressively throughout the trading session, but neither side could sustain control. The close landed very near the open, suggesting a stalemate and potential trend exhaustion.
Pros & Cons
- Pros: Acts as a “pause” signal, warning traders to tighten stops.
- Cons: Very low predictive power on its own; essentially signifies a temporary market “wait-and-see” mode.
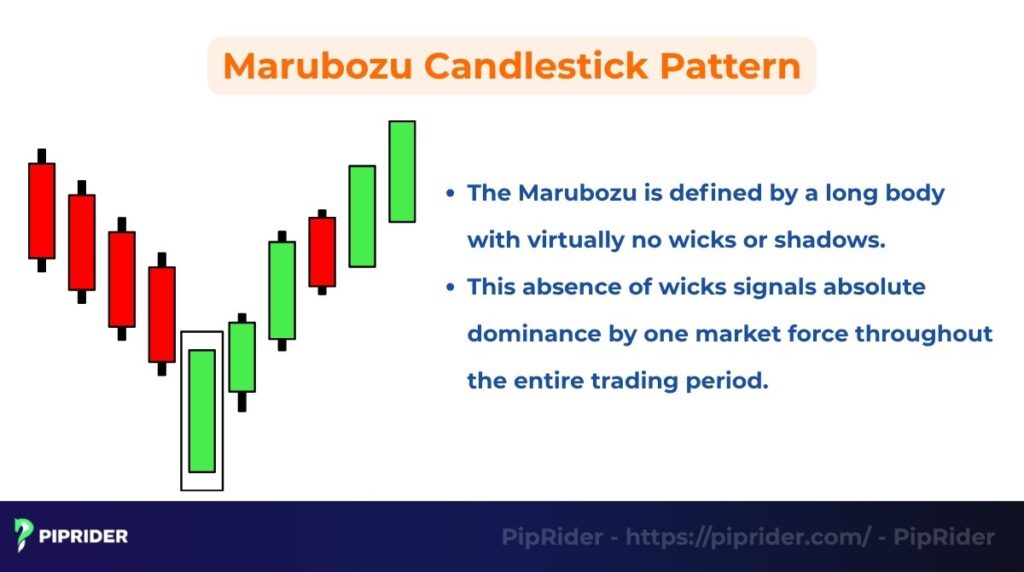
3.5. Marubozu Candlestick Pattern
The Marubozu is a long-bodied candle with no wicks, signaling absolute dominance. A Bullish Marubozu (open at low, close at high) confirms strong buying conviction, while a Bearish Marubozu confirms selling dominance.
- Bullish Marubozu: It signals strong trend continuation or a powerful breakout as buyers maintained complete control.
- Bearish Marubozu: It signals powerful trend continuation or a decisive breakdown as sellers maintained complete control.
Pros & Cons
- Pros: The clearest signal of momentum; ideal for confirming breakouts.
- Cons: Due to the large body, the Stop Loss distance can be wide, requiring careful position sizing.
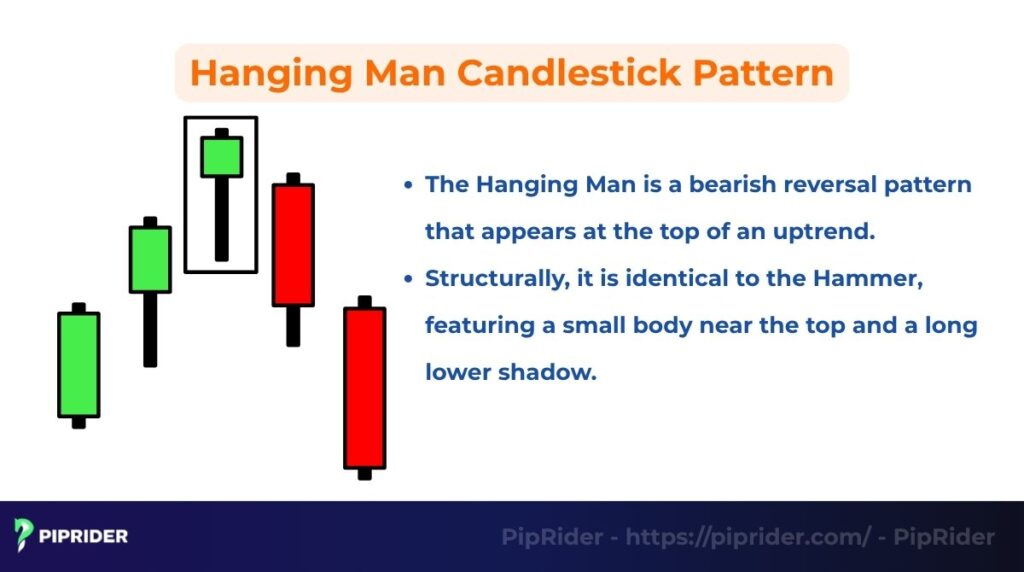
3.6. Hanging Man Candlestick Pattern
Structurally identical to the Hammer but appearing at the top of an uptrend, the Hanging Man warns that selling pressure is beginning to emerge in a mature rally.
The long lower shadow shows that sellers were able to push the price down significantly during the session. It is only reliable if it appears after a clear advance and is confirmed by a strong bearish candle in the following period, signaling reversal.
Pros & Cons
- Pros: Early warning of a potential trend top.
- Cons: Requires mandatory bearish confirmation (a close below the pattern’s body) as the candle itself still closes near the top.
3.7. Inverted Hammer Candlestick Pattern
Appearing at the bottom of a downtrend, this pattern features a long upper shadow. It shows that buyers are beginning to test higher prices, even if they couldn’t hold them by the close.
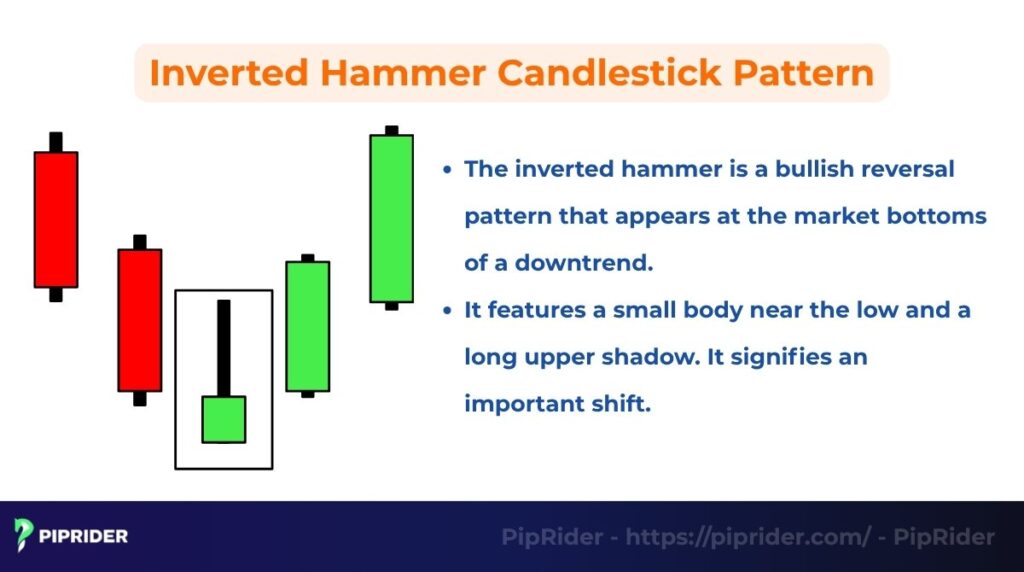
The long upper shadow shows that buyers attempted to push the price higher but were rejected by sellers. However, this appearance after a decline signals a potential shift in momentum and returning buyer aggression.
The effective entry point is confirmed when the subsequent candle closes above the high of the inverted hammer. This signals that the earlier resistance (the high of the shadow) has been successfully overcome.
Pros & Cons
- Pros: Signals returning buyer aggression after a long decline.
- Cons: Weak signal that generates frequent head-fakes; entry should only occur once the upper shadow high is broken.
3.8. Gravestone Doji Pattern
The Gravestone Doji is a specific bearish reversal pattern that typically appears at the market tops of an uptrend. A bearish variant of the Doji where the open, low, and close are at the same level. The long upper shadow represents a major rejection of higher prices at an uptrend’s peak.
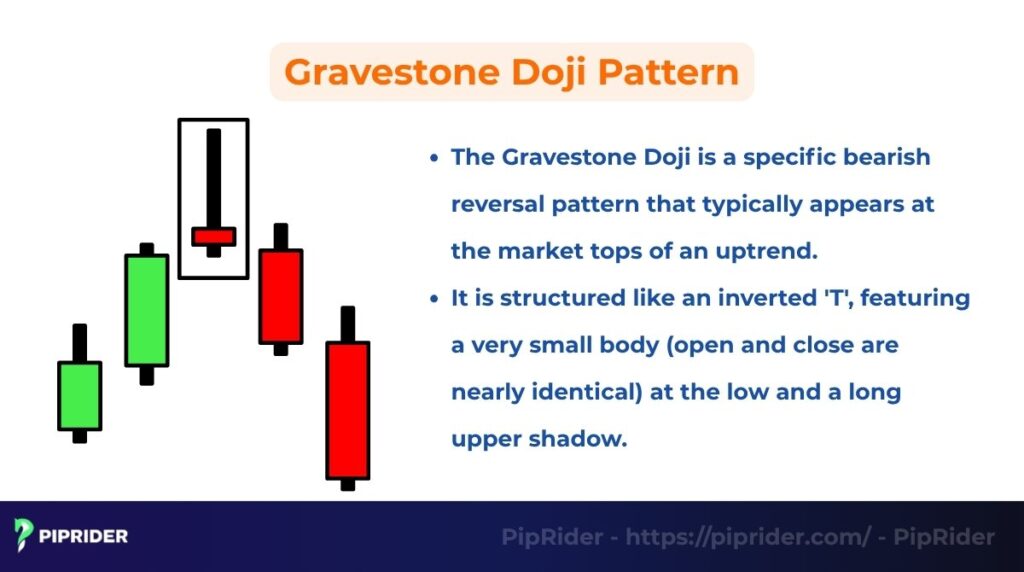
This shows that buyers drove the price up sharply, but sellers ultimately rejected the higher prices and forced the close back down to the open. This strong rejection of the highs is a critical warning of trend exhaustion and a potential reversal.
Pros & Cons
- Pros: Highly effective at identifying imminent reversals at major resistance levels.
- Cons: Significance is zero in sideways markets; requires a bearish close on the following candle.
3.9. Belt Hold Candlestick Pattern
A continuation pattern where the candle opens at its absolute high (bearish) or low (bullish) and trends strongly in one direction. It shows immediate commitment from the first trade of the session.
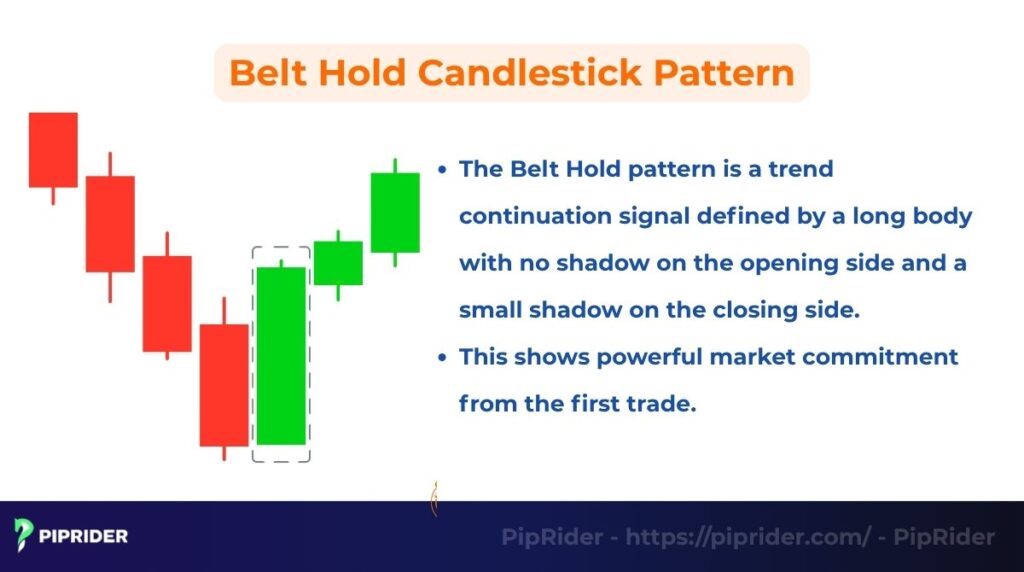
- Bullish Belt Hold: It confirms the sustained strength of an existing uptrend.
- Bearish Belt Hold: It confirms the strength of an existing downtrend as sellers maintained control.
Pros & Cons
- Pros: High-conviction signal for riding existing trends.
- Cons: Unreliable if the underlying market structure is weak; watch for volume spikes to confirm strength.
Read more:
Evening Star Pattern: A-Z Guide to Spotting Bearish Reversals
4. How to Read a Single Candlestick in Technical Analysis
Interpreting these patterns effectively requires traders to combine the visual signal with broader market context to understand the role of buying and selling pressure in forex trading and filter out low-probability setups. You must evaluate the signal based on three critical contextual layers:
- Analyze position (Trend Context): A single candle’s meaning is irrelevant without trend context. A reversal pattern (like a Hammer) is only valid when it appears at a major swing high or swing low; ignore it if it appears mid-trend or within a choppy, sideways range.
- Confirm with volume and structure: Confirmation is essential for high-probability setups. A signal is significantly more reliable when backed by increased activity. In centralized markets (stocks/futures), high volume confirms stronger participation. In spot FX, volume is often a proxy (tick volume), so treat it as supportive evidence and prioritize alignment with Market Structure (Support and Resistance).
- Multi-Timeframe confirmation (MTF): Avoid trading against the dominant direction of the market. Use MTF analysis where the higher timeframe defines the main trend, and the lower timeframe is used solely for precise entry timing. A single pattern is much more powerful when it aligns with the “big picture” trend.
5. How to Trade Using Single Candlestick Patterns
Once you’ve identified and confirmed a high-probability single pattern, the next step is applying precise trade mechanics. Trading success relies not just on spotting the signal but on defining clear, objective rules for entry, stop loss, and profit targets.
5.1. Entry and Exit Strategy
5.1.1. Determining the Entry Point
The primary rule is to wait for confirmation. For a reversal pattern (like the Hammer or Shooting Star), avoid entering blindly. Instead, use one of two modes:
- Entry A (Aggressive): Enter on the close of the confirmation candle (the candle immediately following the signal) if it closes beyond the high or low of the pattern.
- Entry B (Safer/Conservative): Use the Breakout + Retest method. Wait for the price to break the level defined by the pattern and then return to “retest” that level as new support or resistance before entering.
For a continuation candlestick pattern like the Marubozu, entry is typically taken at the close of the signal candle. While high volume is a strong confirmation in stocks, in spot FX, prioritize the candle’s close relative to market structure.
5.1.2. Effective Stop Loss and Take Profit Placement
The structural nature of single patterns provides an inherent point of failure for placing the Stop Loss (SL).
- Stop Loss: Place the SL just outside the tail or shadow of the signal candle. Pro Tip: Always add a small buffer (e.g., a few pips or a fraction of the ATR) so that market noise or “stop hunts” don’t invalidate a correct trade idea prematurely.
- Take Profit: Your target should be the next major Support or Resistance level.
- Risk Management: Do not force a trade. Only select setups where the distance to the next S/R level provides a minimum 1:2 Risk-to-Reward (R:R) ratio. If the target is too close, skip the setup or look for a better entry on a lower timeframe.
5.2. Combining with Indicators
To filter out market traps, single candlestick patterns should be validated by key technical indicators:
- RSI (Relative Strength Index): Confirms reversal patterns by identifying exhaustion. A bullish signal is stronger if the price is oversold (RSI < 30), while a bearish signal gains probability if the price is overbought (RSI > 70).
- Moving Averages (MA): Act as dynamic Support/Resistance. A high-conviction signal occurs when a pattern bounces off or breaks cleanly through a key MA, such as the 50-period or 200-period.
- MACD (Moving Average Convergence Divergence): Confirms momentum shifts. Look for MACD divergence (where price and indicator move in opposite directions) to validate a reversal pattern.
5.3. Backtesting and Example Chart
Backtesting is the process of applying your strategy to historical data to determine its reliability. Before risking real capital, track the performance of these patterns across various market conditions to understand their specific failure rates.
Practical Example: Hammer & Marubozu
Imagine a strong downtrend reaches a major Support level.
- Hammer Signal: A Hammer forms precisely at this Support level, signaling a potential floor.
- Confirmation: The very next candle is a Bullish Marubozu that closes above the Hammer’s high, confirming a shift in sentiment.
- Trade Action: Entry is taken at the close of the Marubozu (or on a retest of the Support level). The SL is placed just below the absolute low of the Hammer shadow plus a small buffer, securing a high-probability trade with defined risk.
6. Importance of Single Candlestick Patterns in TecAhnical Analysis
Single candlestick patterns are essential because they provide immediate, actionable insights that form the basis of effective price action strategies. Their significance lies in three key areas:
- Market sentiment Insight: Single candles provide the clearest visual data on the psychological balance between buying and selling pressure. A quick glance reveals if fear (selling) or greed (buying) dominated the trading session (CME Group, n.d.).
- Early Trend Reversal Detection: Patterns like the Hammer or Doji are often the first warning signs that a trend is exhausting itself. Recognizing these allows traders to position themselves for a reversal earlier than relying on slower, lagging indicators.
- Defined risk parameters: These patterns form the core language of price action. They define precise, objective entry and exit points, allowing traders to use the candle’s structure for an accurate Stop Loss—ideally with a small buffer to account for market noise (Babypips, n.d.-a).
7. Pros and Cons of Single Candlestick Patterns
While single candlestick patterns are invaluable tools, they come with inherent limitations that traders must manage through strict discipline.
Advantages (Pros):
- Simplicity: They are easy to identify, making them ideal for beginners learning to read market conviction.
- Immediacy: Signals are instant and apply across all asset classes and timeframes.
- Flexibility: They serve as the foundational building blocks for more complex multi-candle analysis.
Disadvantages (Cons):
- Market noise: They are prone to “head fakes” when traded in isolation, especially on lower timeframes.
- Context dependency: A pattern is only significant if it occurs at a key level of Support or Resistance (Mitchell, 2022).
- Confirmation required: They should not be traded blindly. Reliable setups require supplementary confirmation from price structure, confirmation candles, or volume—treating volume as a proxy in decentralized markets like spot FX (Babypips, n.d.-b).
8. Frequently asked questions about single candlestick patterns
9. Conclusion
Single Candlestick Patterns are the indispensable foundation of price action, providing immediate visual insights for early reversal and continuation warnings. Whether identifying a Hammer at a market bottom (Babypips, n.d.-a) or a Marubozu during a breakout (Mitchell, 2022), these patterns reveal the raw emotional battle between buyers and sellers.
Success demands strict discipline: never trade these patterns in isolation. Always confirm signals using market structure and price action follow-through before execution. Most importantly, practice stringent risk management by using the pattern’s structure to define a precise Stop Loss with an appropriate buffer.
To continue building your trading patterns knowledge, follow Piprider. Explore more advanced strategies in our Analysis section and find reliable platforms in our Broker Reviews section.


