
One of the most common frustrations in trading is watching a perfect market entry setup fail. A trader might enter a position only to see momentum vanish, or get stopped out by a violent, unexpected price swing. Both issues stem from the same root cause: a sudden shift in volatility.
Understanding a market’s rhythm, its volatility and behavioral shifts is as crucial as knowing its direction. For this, the Standard Deviation indicator is one of the most reliable tools in a trader’s arsenal. It doesn’t predict trends; instead, it provides a mathematical lens to gauge the intensity of price dispersion, helping you identify whether the current movement is a standard fluctuation or an abnormal surge.
Key Takeaways
- The Standard Deviation is a statistical tool that measures the size of recent price movements to gauge market volatility.
- A high reading signifies large price swings, while a low reading indicates a quiet, consolidating market.
- The indicator provides no directional trading signals; it only measures the intensity of price movement.
- A key strategy is anticipating breakouts after a period of extremely low standard deviation.
- This tool is the mathematical foundation for other crucial volatility tools, most notably the Bollinger Bands.
1. What Is The Standard Deviation Indicator?
In technical analysis, the Standard Deviation is a powerful statistical measure from the field of descriptive statistics designed to quantify the degree of price dispersion. In simple terms, the indicator shows how spread out recent price fluctuations are from their average.
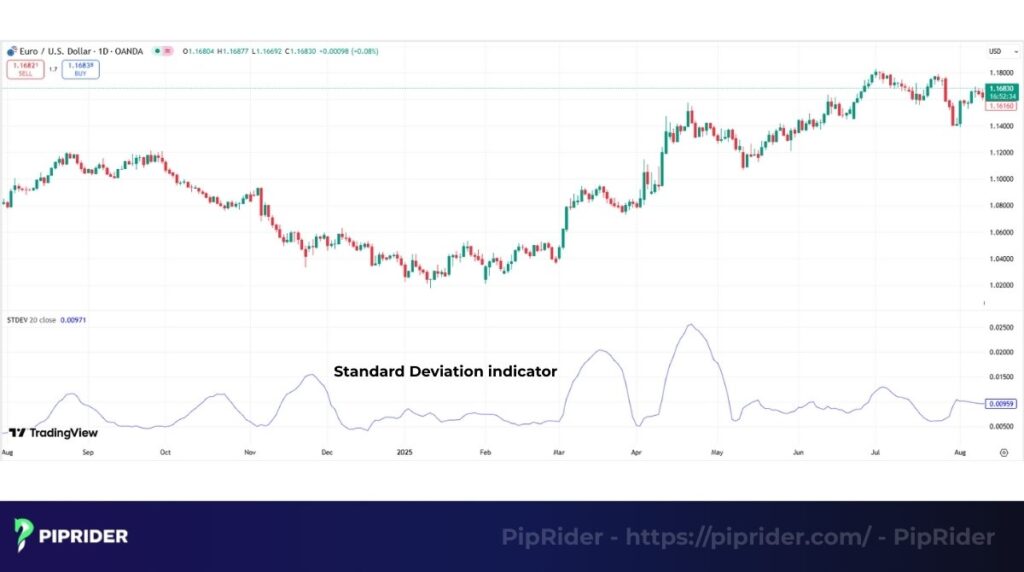
The concept itself is borrowed directly from the world of statistics but has been adapted for trading as a pure measure of market volatility. The indicator’s purpose is not to indicate if a trend is up or down. Instead, the tool answers a different, equally important question: “Is the market currently calm and quiet, or is it wild and chaotic?”
- When the indicator shows a low value, this signifies that the price is consolidating within a tight band around its average, a characteristic of a sideways market.
- A high Standard Deviation value means the price has been making large swings, far from its average. A high reading could indicate a robust, healthy trend, but it might also signify a final point of exhaustion right before a potential reversal.
This knowledge helps traders adapt their strategies. For example, attempting to use a trend-following strategy when the Standard Deviation indicator is flat is a recipe for frustration. Conversely, knowing when volatility is high helps traders determine when to widen their stop losses for proper risk management to avoid being shaken out by noise.
2. How To Calculate The Standard Deviation Indicator?
The formula for Standard Deviation is where many traders get intimidated. However, understanding the logic behind the Standard Deviation indicator formula is surprisingly simple. Manual calculation is never necessary, but knowing the steps a software takes provides a much deeper appreciation for what the indicator is actually revealing.
2.1. The Standard Deviation Formula
In trading platforms like MT4 or TradingView, the indicator doesn’t just look at a static set of numbers; it processes a rolling window of price data. The formula is applied to the difference between each candle’s closing price and the Simple Moving Average (SMA).
StdDev = SQRT( SUM( (Close – SMA(Close, N))2, N ) / N )
Where:
- σ = Standard Deviation
- Σ = Sum of x = Each value in the data set (e.g., each closing price)
- μ = The mean value (average) of the data set
- N = The total number of data points (the period)
2.2. The Calculation Process In Five Simple Steps
Let’s translate that formula into a clear, step-by-step process. The procedure is exactly what charting software does in a fraction of a second.
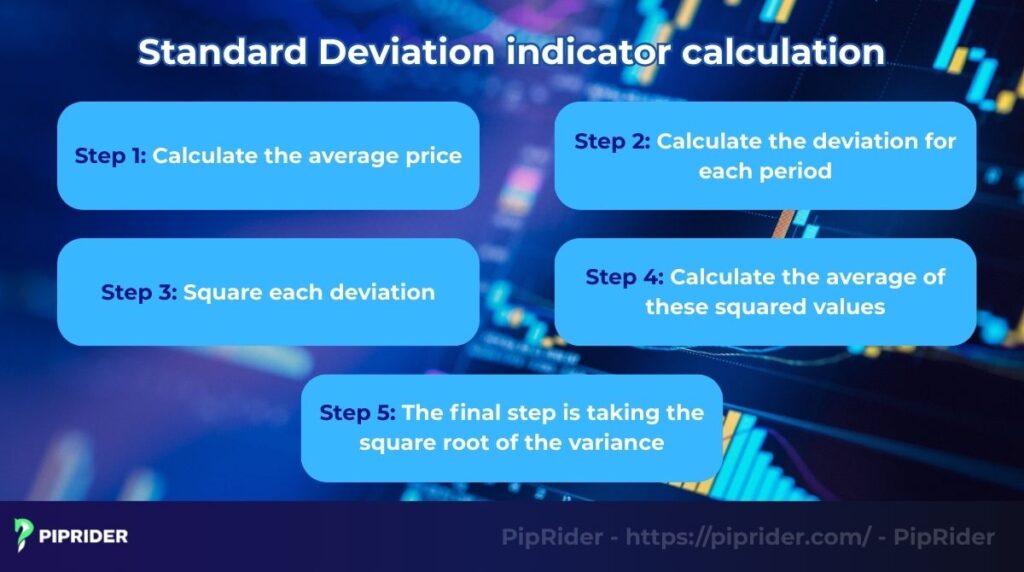
- Calculate the SMA: The software first determines the Simple Moving Average (typically 20 periods) of the Close prices. This serves as the “mean” ($\mu$).
- Find the Deviation: For each candle in the period, it subtracts the SMA value from the actual Closing price.
- Square the Results: Each deviation is squared to eliminate negative values and highlight larger price swings.
- Sum and Average: It adds these squared values and divides them by $N$ (the number of periods), resulting in the Variance.
- Square Root: Taking the square root of the variance gives us the Standard Deviation value displayed on your chart.
2.3. A Practical Example
Let’s say a 5-period setting is used for simplicity, and the last 5 closing prices were: 1.10, 1.12, 1.11, 1.13, 1.14.
- Mean value (μ): (1.10 + 1.12 + 1.11 + 1.13 + 1.14) / 5 = 1.12
- Deviations (x – μ): -0.02, 0, -0.01, +0.01, +0.02
- Squared Deviations (x – μ)²: 0.0004, 0, 0.0001, 0.0001, 0.0004
- Variance (Average of Step 3): (0.0004 + 0 + 0.0001 + 0.0001 + 0.0004) / 5 = 0.0002
- Standard Deviation (√Variance): √0.0002 ≈ 0.014
The resulting value of 0.014 is the Standard Deviation, representing the typical distance of the recent prices from their average.
3. Interpreting Standard Deviation Values
Now that the calculation is clear, let’s focus on the most important part: how to read the Standard Deviation indicator. The actual number produced by the indicator is less important than what that number reveals about the market’s current personality.
3.1. The Meaning Of High And Low Values
The value of the indicator reflects the market’s “energy” level:
- Low Standard Deviation: Indicates a period of consolidation or “calm.” Price action is efficient and stays close to the mean. For traders, this is a signal to prepare for an imminent expansion, as markets rarely stay quiet for long.
- High Standard Deviation: Indicates extreme activity. While this often accompanies a strong, healthy trend, a parabolic spike in the indicator often points to “climactic” behavior where price moves too far, too fast, often leading to a mean reversion or a temporary pause.
The key insight is that volatility is cyclical. Periods of low volatility are almost always followed by periods of high volatility, and vice versa.
3.2. The Mathematical Foundation of Bollinger Bands
The most famous application of the Standard Deviation in trading is the Bollinger Bands®. John Bollinger created his namesake bands by placing a “shell” around a 20-period SMA, set at a distance of two standard deviations (2σ).
- The 95% Rule: According to the Normal Distribution (the 68-95-99.7 rule), approximately 95% of all price action should stay within these two standard deviations.
- Significance of “Outliers”: When the Standard Deviation indicator spikes, the Bollinger Bands expand. If price touches or breaks outside the bands, it is a statistically significant event—representing an extreme deviation from the average that often leads to a “Mean Reversion” (returning to the SMA).
A Note on Market Reality (The Precision Disclaimer): While the 68-95-99.7 rule provides a vital mathematical guideline, traders must understand that financial markets do not always follow a perfect “Normal Distribution.” Price action frequently exhibits “fat tails” (kurtosis), meaning extreme market moves occur more often than standard statistical models would predict. Therefore, these percentages should be treated as high-probability zones rather than absolute boundaries.
By monitoring the Standard Deviation indicator separately, traders can see the “expansion” and “contraction” cycles of the bands more clearly in a dedicated oscillator format.
3.3. Standard Deviation vs. ATR: Which One to Use?
While both tools measure volatility, they do so from different mathematical angles. Understanding this distinction is key to choosing the right filter for your strategy.
- Average True Range (ATR): Measures the absolute “size” of price candles (High minus Low). It tells you how many pips or points a pair moves on average.
- Standard Deviation (SD): Measures the “dispersion” of price from its average (SMA). It tells you how “stretched” or “compressed” the market is relative to its recent history.
The Verdict: Use ATR for setting static Stop Losses based on candle size. Use Standard Deviation to identify volatility cycles (the “calm before the storm”) and potential trend exhaustion points.
4. Best Settings And Parameters For Different Trading Styles
Like most indicators, the Standard Deviation indicator can be adjusted to suit a specific trading style and timeframe. While the default settings are an excellent starting point, understanding the parameters allows for fine-tuning. The two main parameters available for adjustment are the period and the source price.
4.1. The Standard Deviation Parameters
Before looking at specific styles, a trader should understand what is actually being changed.
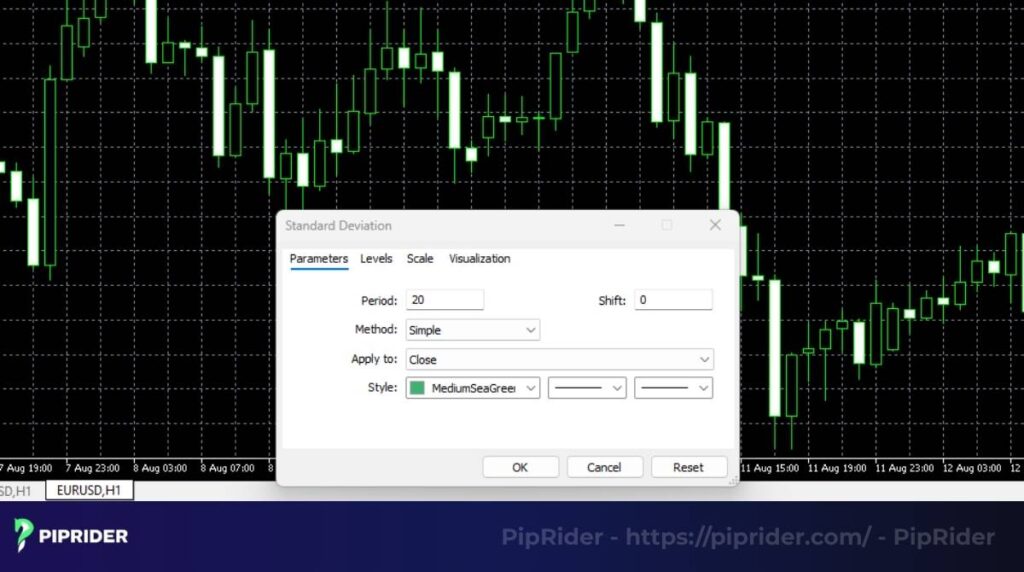
- Period: This is the lookback window for the calculation, typically set to 20 by default. A shorter period (e.g., 10) will make the indicator react more quickly to changes in volatility, while a longer period (e.g., 30) will make it smoother and slower.
- Source Price: This is the price data used in the calculation. The default is almost always the Close price of each candle, which is recommended for 99% of situations.
4.2. Recommended Settings For Your Trading Style
The key is to match the indicator’s sensitivity to the timeframe being traded. A scalper needs to see immediate shifts in volatility, while a position trader only cares about major, long-term volatility trends. The following table provides a straightforward guide for these adjustments.
| Trading Style | Recommended Period | Source Price | Timeframe Focus | Key Consideration |
| Scalping | 5 to 10 | Close | M1, M5, M15 | A shorter period is essential for scalping to see immediate volatility spikes around news or session opens. Be prepared for a lot of noise. |
| Day Trading | 20 (Standard) | Close | M15, H1 | The default 20-period setting is the perfect balance for day trading. The value is slow enough to filter out noise but fast enough to capture the day’s main volatility cycles. |
| Swing Trading | 20 to 30 | Close | H4, Daily | For swing trading, a trader can use the default or a slightly longer period like 30. This helps to ignore minor daily volatility and focus on the major weekly swings. |
| Position Trading | 50 or more | Close | Weekly, Monthly | A long-term investor might use a 50-period setting on a weekly chart to identify periods of historical market complacency (low volatility) or panic (high volatility). |
A sound piece of advice is to start with the default 20-period setting. The value is the most widely used and will give a solid, reliable reading of volatility across most market conditions and timeframes. Only after mastering its interpretation should a trader experiment with adjustments.
5. Standard Deviation In Trading Strategies
The Standard Deviation is not a standalone signal generator. Its real power emerges when used as a volatility filter within a broader trading strategy. Let’s explore two powerful strategies where the indicator plays a crucial role in improving timing and filtering out bad trades.
5.1. The Flat Breakout Strategy
This strategy is a popular way to use the Standard Deviation, based on the principle that periods of low volatility are often followed by explosive moves.
- The Goal: Identify markets that are “coiling up” like a spring before a major expansion by finding periods of extreme price compression.
- Logic: Volatility is cyclical. Periods of extremely low Standard Deviation indicate that the market is “asleep” and building energy for a significant move.
- Asset: EUR/USD (or any major currency pair)
- Timeframe: H4
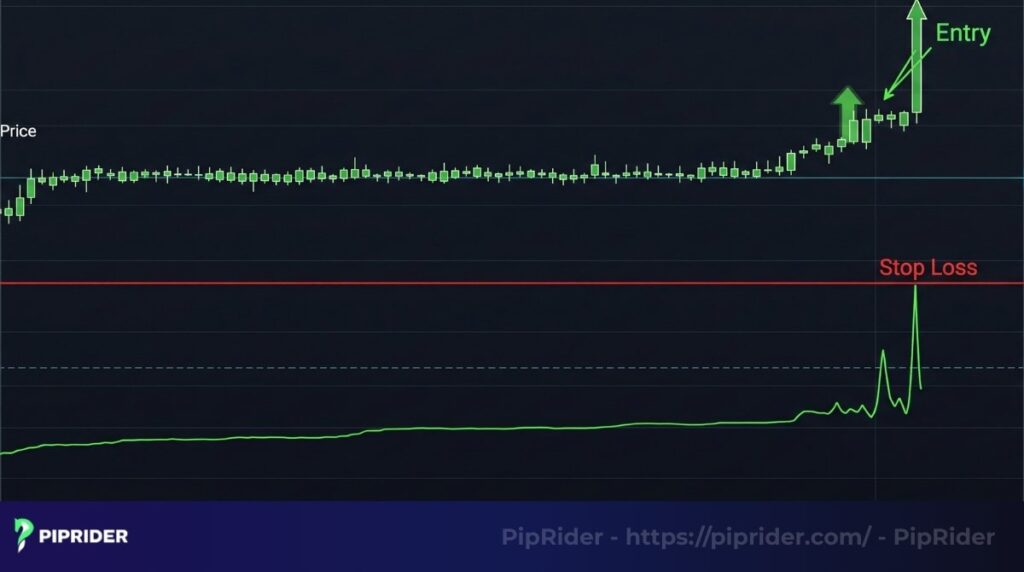
- SD State (The “Flat”): The Standard Deviation line must be at or near its historical floor (lowest 10% of its recent range), indicating a complete lack of volatility.
- Setup: Draw a clear horizontal box (support and resistance) around the consolidating price action.
- Entry: Wait for a candle to close firmly outside the established box.
- Confirmation (The “Spike”): The SD line must turn upward sharply at the same time as the breakout, confirming that real momentum is entering the market.
- Stop Loss (SL): Placed on the opposite side of the consolidation box to protect against fakeouts.
- Take Profit (TP): Target the next major psychological level or a minimum 2:1 Reward-to-Risk ratio.
Case Study (EUR/USD H4 – Breakout):
In early June 2024, the EUR/USD H4 chart showed the Standard Deviation line dropping to its historical “floor,” indicating a period of extreme price compression. While the price was confined to a tight 30-pip range, the indicator’s flat profile signaled that a breakout was imminent. As soon as a bullish candle closed above resistance and the Standard Deviation indicator spiked upward simultaneously, it confirmed the entry. This combination of price breakout and volatility surge filtered out the “fakeouts” often seen in low-volume environments. (Carew & Kamdar, 2024; Investors.com, 2024).
5.2. The Trend Reversal Strategy
The trend reversal strategy is a more contrarian approach. It aims to identify the end of a trend by spotting a point of unsustainable, climactic volatility.
- The Goal: Spotting “Volatility Climaxes” where a trend has moved too far, too fast (euphoria or panic), and is statistically likely to snap back to its mean.
- Logic: A trend often ends with a “bang” (a massive spike in volatility). According to the 95% rule, extreme deviations are unsustainable and usually lead to a mean reversion.
- Asset: S&P 500 (SPX), Gold (XAUUSD), or BTC/USD
- Timeframe: Daily
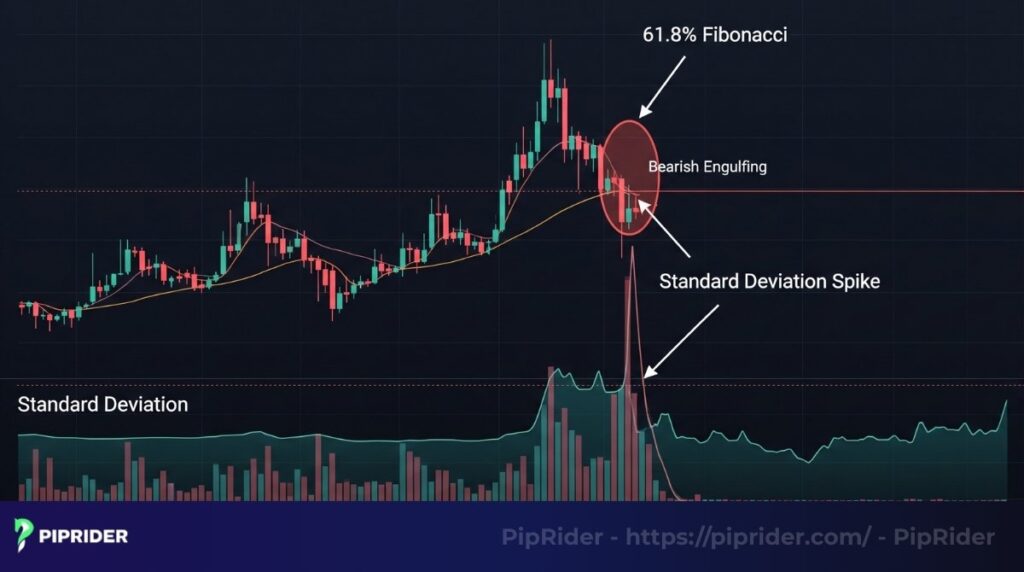
- SD State (The “Spike”): The SD indicator reaches an extreme peak, appearing visually “overextended” compared to the last 6-12 months of data.
- Setup: Price must be in a parabolic move (vertical rise or fall) away from its 20-period SMA.
- Entry: Wait for a reversal candlestick pattern (e.g., a Bearish Engulfing or Pin Bar) to form precisely when the SD begins to curve down from its peak.
- Stop Loss (SL): Placed just above the high (for shorts) or below the low (for longs) of the reversal candle.
- Take Profit (TP): The primary target is the 20-period SMA (Mean Reversion). Secondary target is the 50% Fibonacci retracement of the prior move.
Case Study (The 2020 Market Bottom):
During the panic of March 2020, the Standard Deviation on major indices like the S&P 500 surged to extreme historical levels, far exceeding its multi-year range. While this didn’t pick the exact bottom, it signaled a “volatility climax”—a state of near-panic where the price had deviated so far from its average that a mean reversion was statistically inevitable. Contrarian traders used this extreme peak as a signal to tighten stops on shorts and look for reversal patterns, identifying the exhaustion point right before the historic recovery began.
6. Advantages And Disadvantages Of The Standard Deviation
Like any technical tool, the Standard Deviation has a specific job. The indicator is excellent for its specific purpose, but being aware of its limitations is crucial for long-term success.
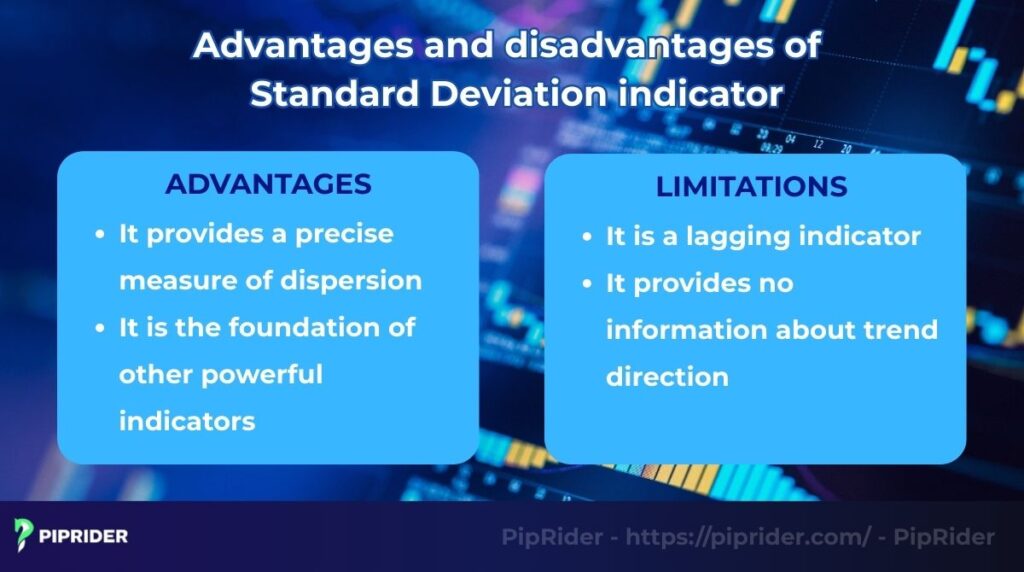
Here is a quick summary of the key advantages and limitations:
| Pros | Cons |
| Objective Volatility Gauge: Provides a precise, mathematical value for market “noise” vs. “signal” | Lagging Indicator: Since it’s based on a Moving Average, the spike in volatility often appears after the move has started |
| Cycle Identification: Excellent for spotting the transition from quiet consolidation to explosive trends | Assumption of Normality: It assumes price follows a “Normal Distribution.” In reality, markets often experience “Black Swan” events or “fat tails” that statistics alone cannot predict |
7. Frequently Asked Questions About Standard Deviation Indicator
Here are some quick, no-nonsense answers to the questions traders ask most frequently about the Standard Deviation indicator.
8. Conclusion
In the complex world of financial markets, understanding direction is only one part of the equation. The other, equally crucial part is understanding volatility. The Standard Deviation indicator is not just another line on the chart, but a tool for proactive risk assessment, serving as a direct, mathematical measure of the market’s current state of chaos or calm.
While offering no directional signals on its own, its true power lies in its role as a master context tool for robust trading systems. By learning how to use the indicator in trading, a trader can better anticipate explosive breakouts and define clear entry points and exit points.
Add the indicator to your charts, test the strategies discussed, and learn to respect the rhythm of volatility. To continue the journey, explore more guides in our best technical indicators and Learn Forex category right here on Piprider.


