
The thrusting candlestick pattern is a two-candle bearish continuation setup that forms during active downtrends. It occurs when a bullish counter-attack fails a critical structural test: the second candle penetrates the first but cannot close past its 50% midpoint. This rejection confirms that sellers have absorbed the buying pressure, making it a valuable tool for trend-followers when confirmed correctly.
This guide provides the definitive structural rules, clears the confusion regarding the thrusting pattern vs piercing line, and outlines precise, step-by-step trading strategies. Mastering this pattern is essential for traders looking to execute trend-following setups with disciplined risk management.
Key Takeaways
- The thrusting candlestick pattern is a two-candle bearish continuation setup where a bullish second candle (C2) penetrates the body of a long bearish first candle (C1) but fails to close past its 50% midpoint.
- The failure of buyers to breach the 50% level confirms the original bearish market force remains dominant, validating the bearish thrusting pattern as a signal to stay short or enter new short positions.
- Classify as Strong (shallow penetration) or Medium (deep penetration under 50%). Avoid the less reliable Reversal variant.
- Entry must be confirmed by a volume spike and alignment with major Moving Averages (MAs).
- The structural definition allows for precise, tight Stop-Loss (SL) placement, yielding a superior R:R ratio, which directly impacts trading performance.
1. What is the Thrusting Candlestick Pattern?
Much simpler than a macro chart formation like a flag pattern, the thrusting candlestick pattern is a two-candle continuation setup that signals a prevailing downtrend is preparing to resume (TrendSpider Learning Center, n.d.; LiteFinance, 2025).
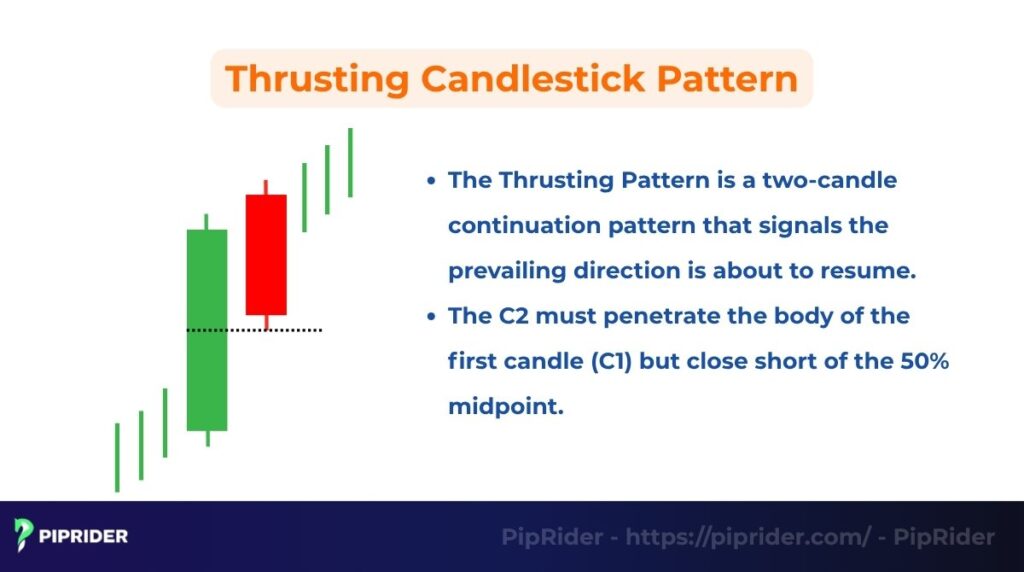
It forms when the second candle (C2) attempts a bullish counter-attack but fails a critical structural test: C2 must penetrate the real body of the first bearish candle (C1) but critically close short of the 50% midpoint.
The psychology is straightforward: the failure of the opposing force to push the price past the 50% equilibrium mark confirms they are structurally weak. Rather than a “high-conviction” standalone signal, this price action simply confirms that the dominant bearish force has absorbed the buying pressure, heavily favoring the continuation of the original downward trajectory.
Thrusting Pattern vs Piercing Line (And Other Formations)
Distinguishing the Thrusting Pattern from other two-candle formations is critical. The most common point of confusion among traders is the thrusting pattern vs piercing line, as a minor difference in the closing location of the second candle (C2) entirely changes the signal from a bearish continuation to a bullish reversal.
| Pattern | Signal Type | C2 Closing Location (vs. C1 Body) | Psychological Meaning |
|---|---|---|---|
| Thrusting Pattern | Continuation (Moderate) | Penetrates but closes strictly below the 50% midpoint. | The dominant bears maintain structural control, absorbing moderate buying pressure. |
| Piercing Line | Reversal (Strong) | Closes at or past the 50% midpoint. | Market structure is breached; control decisively shifts to the bulls. |
| In-Neck / On-Neck | Continuation (Stronger) | Closes at or very near C1’s lowest point (shallow penetration). | Buyers are extremely weak; immediate rejection by the bears. |
2. Structure of the Thrusting Pattern
The definition of the thrusting candlestick pattern is entirely reliant on the strict relationship between two consecutive candles. Because it is a continuation signal, its validity is tightly bound to its specific shape and location.

2.1. The Strict Structural Checklist (Must check ALL boxes)
To filter out market noise and false signals, a valid bearish thrusting pattern must meet every single condition below:
- The Prior Trend: A clear, established downtrend must be in progress. It cannot form in a sideways consolidation range.
- Candle 1 (The Anchor): Must be a large, decisive bearish candle moving strongly in the direction of the underlying trend. This candle provides the necessary structural range.
- Candle 2 Open (The Thrust): This bullish candle attempts to move against the prevailing trend.
- Pro Note for Different Markets: In traditional stock markets, C2 must gap down (open below the low of C1). In continuous 24/5 markets like Spot Forex or Crypto, gaps are rare, so C2 opening exactly at or very near the close of C1 is perfectly acceptable.
- The 50% Rule (Critical): C2 must penetrate the real body of C1 upwards, but it absolutely must close below the 50% midpoint of C1.
- The Location: It should appear as a mid-trend pause. If C1 or C2 is smashing directly into a major Higher Timeframe (HTF) support zone, the pattern is invalidated.
2.2. Difference between Bearish and Bullish Thrusting
While the classic thrusting pattern is heavily associated with a bearish continuation, its inverted structure can occasionally appear in uptrends. The core structural rule (the 50% midpoint test) remains the same for both, but the candle colors and directional context are inverted.
| Type | Preceding Trend | Candle 1 (Anchor) | Candle 2 (Thrust) | Signal Result |
|---|---|---|---|---|
| Bearish Thrusting (Classic) | Bearish Trend (Temporary pullback) | Long Bearish (Red/Black) | Bullish (Green/White, Closes < 50% of C1) | Bearish Continuation (Short Trade) |
| Bullish Thrusting (Inverse) | Bullish Trend (Temporary pullback) | Long Bullish (Green/White) | Bearish (Red/Black, Closes < 50% of C1) | Bullish Continuation (Long Trade) |
Note on Naming Ambiguity: The pattern name traditionally refers to the color of C2 and the preceding direction. Regardless of the variant, the resulting signal is always the continuation of the original direction, as the failure of C2 to reach the 50% mark confirms the prior momentum is intact.
3. Types of Thrusting Line Patterns Based on Penetration Depth
The strength of a bearish continuation signal is entirely dictated by how deeply the second candle (C2) penetrates the body of the anchor candle (C1). By analyzing this depth, traders can categorize the price action into three distinct structures to gauge the remaining bearish momentum.
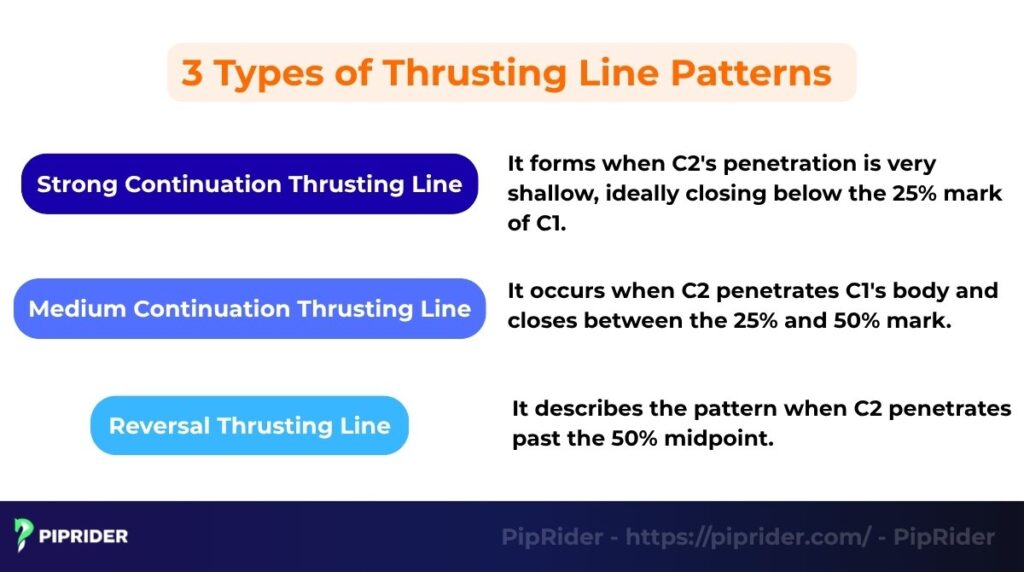
3.1. Shallow Penetration (Bordering on the “In-Neck” Pattern)
If the bullish C2’s penetration is very shallow, closing strictly within the bottom quarter (below the 25% mark) of C1’s body, it borders on what classic candlestick theory calls the In-Neck or On-Neck pattern.
- Meaning: This minimal penetration signals that the counter-trend buyers are extremely weak and were rejected instantly. Because the bulls could barely push the price up, this structure offers a very strong probabilistic edge that the dominant downtrend will resume quickly.
3.2. Standard Penetration (The True Thrusting Line)
This is the authentic and most common thrusting line. It occurs when C2 makes a legitimate “thrust” deeper into C1’s body, closing anywhere between the 25% and 49% mark (Bulkowski, 2008).
- Meaning: The deeper penetration suggests that buyers managed to muster a moderate counter-attack before stalling at the psychological 50% wall. Because the opposing force showed some structural strength, this setup heavily relies on external confirmation (like the C3 breakout candle) before you can safely execute a Short trade.
3.3. Deep Penetration (Invalidated Setup / Piercing Line)
Strictly speaking, if C2 pushes up and closes at or past the 50% midpoint of C1, it is no longer a thrusting pattern.
Meaning: This is a major structural warning. The 50% breach technically converts the setup into a strong bullish reversal signal known as the Piercing Line (Nison, 2001). Trend-following traders must instantly cancel any plans to go Short, as the bears have lost control of the equilibrium point and a reversal is likely underway.
4. The Logic and Market Context Behind the Thrusting Pattern
To trade the bearish thrusting pattern effectively, you must understand both the underlying order flow and the broader market context. Trading this setup in isolation is a recipe for false breakouts.
4.1. Pattern Psychology: The Failed Reversal
In short, the thrusting pattern represents a failed bullish reversal within a dominant downtrend. This psychological battle unfolds in three stages:
- The Setup: A strong downtrend is in place, and sellers are firmly in control (Anchor Candle C1).
- The Trap: At the open of the second candle (C2), “bottom-catchers” and aggressive buyers step in, attempting to force a market bottom.
- The Failure: Despite their efforts, the buyers lack the institutional momentum to push the price past the critical 50% midpoint of C1. The closing bell rings with the price trapped, signaling that bears are simply absorbing liquidity before pushing prices lower.
4.2. Pattern Reliability: A Call for Caution
Is the thrusting pattern reliable? Classic candlestick literature dictates that the thrusting pattern is NOT a standalone, high-strength pattern.
Confirmation is Mandatory: Because the buyers managed to penetrate the previous candle’s body, they showed some strength. Therefore, a third candle (C3) closing decisively below the low of the pattern is strictly required for entry.
4.3. Invalid Setup Checklist: When to Walk Away
Not every two-candle overlap is a thrusting pattern. To protect your capital, invalidate the setup immediately if it meets any of the following criteria:
- Closes Above the Midpoint: If C2 closes at or above the 50% mark of C1, it ceases to be a continuation pattern and becomes a Piercing Line (a bullish reversal).
- No Prior Downtrend: If the pattern forms in a sideways consolidation range or at the top of an uptrend, it is meaningless market noise.
- Candle Size is Too Small: If C1 or C2 are tiny, low-volatility candles (like Dojis), the pattern lacks the momentum required to trap opposing traders.
4.4. Confluence with Trendlines and S/R
Context is paramount. Using trendlines provides strong directional confirmation. Crucially, traders must avoid setups where C1 or C2 forms directly into a major horizontal support zone. These structural barriers often generate powerful counter-reactions that overwhelm weak continuation signals like the Thrusting pattern, leading to high-risk false breakouts.
4.5. Multi-Timeframe Analysis (MTFA)
Never trade a thrusting pattern against the dominant direction established on the higher timeframe (Daily or H4). The HTF provides the necessary structural context. Use the lower timeframe (H1 or M15) strictly for execution, as it allows traders to spot the pattern clearly and secure the tightest, most advantageous Stop Loss placement.
5. Step-by-Step Trading Strategy for the Bearish Thrusting Pattern
Trading this pattern moves beyond simple identification; it demands a precise, rule-based strategy to capitalize on the momentum while strictly controlling risk. Because the bearish thrusting pattern is a continuation signal that requires confirmation, patience is your greatest asset.
Here is the step-by-step standard operating procedure (SOP) for executing a highly disciplined Short trade:
Step 1: Filter the Market Context (The Setup)
Before looking at the individual candles, confirm the broader environment.
- Ensure the Higher Timeframe (e.g., Daily or H4) is in a clear, established downtrend.
- Check that the price is not compressing directly into a major horizontal Support zone or a significant trendline. If the path downward is blocked by structural support, abandon the setup.
Step 2: Validate the Structure & Wait for Confirmation (The Trigger)
Identify the pattern (Candle 1 is a long bearish candle; Candle 2 is bullish but strictly closes below the 50% midpoint of C1). Do not enter the trade at the close of C2.
- The Trigger: You must wait for a third confirmation candle (C3) to form. C3 must be a bearish candle that breaks and closes definitively below the lowest point of C2.
- Volume Check: In centralized markets (Stocks/Crypto), this C3 breakout should ideally be accompanied by a noticeable volume spike. In Spot Forex, where only tick volume is available, rely heavily on the momentum of the C3 close rather than strict volume bars (OANDA, n.d.).
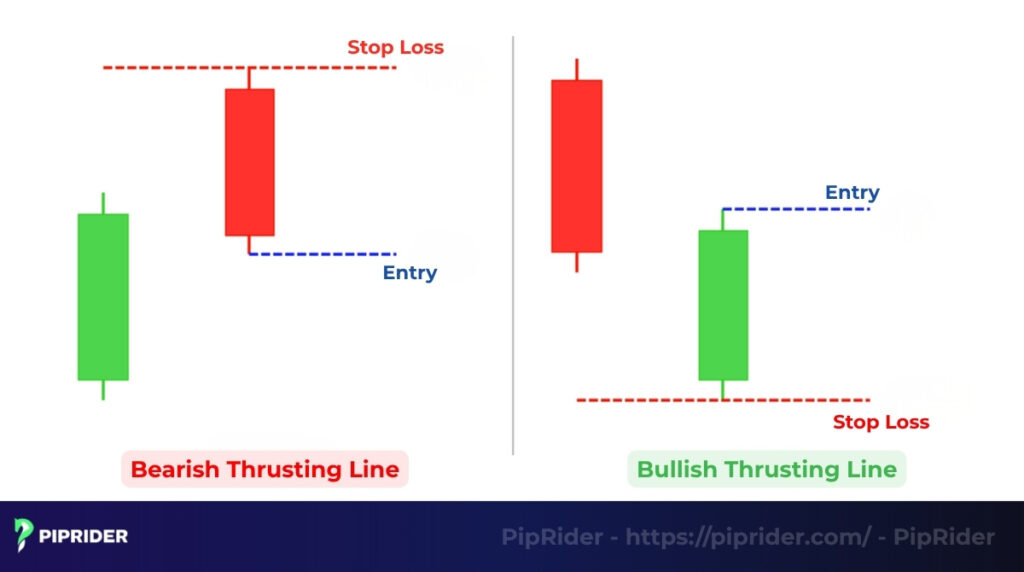
Step 3: Execution and Stop-Loss Placement (Risk Management)
Once C3 closes and confirms the continuation, it is time to execute and protect your capital.
- Entry: Execute a Short Sell order immediately at the close of C3 (or at the open of the following candle).
- Conservative Stop-Loss (Recommended): Place your Stop-Loss (SL) just above the high of Candle 1 (The Anchor). Adding a small buffer for the spread ensures you are protected, as a break above C1 means the entire bearish structure has been invalidated.
- Aggressive Stop-Loss: For a tighter risk profile, place the SL just above the high of Candle 2 (The Thrust). While this improves your Risk-to-Reward ratio, you risk being stopped out prematurely by a minor volatility wick before the trend resumes.
Step 4: Set Take-Profit Targets (The Exit)
Never take a trade without knowing your exit strategy. Ensure the distance to your primary target offers at least a 1:2 Risk-to-Reward (R:R) ratio.
- Target 1 (Structural): Place your primary Take-Profit (TP1) at the next major structural Support level identified on the higher timeframe.
- Target 2 (Measured Move): Measure the height of the anchor candle (C1) and project that distance downwards from your entry point to find a secondary momentum target. Alternatively, trail your stop-loss behind newly formed lower highs to ride the extended trend.
Trading the Inverse (Bullish Thrusting): If you spot the inverted pattern during an active uptrend (C1 is bullish, C2 is bearish but closes above the 50% midpoint), apply the exact same logic in reverse. Wait for C3 to close above the high of C2, enter Long, and place your Stop-Loss safely below the absolute low of the C1 anchor candle.
6. Example Trade Using the Thrusting Candlestick Pattern
This case study illustrates a practical short trade using the bearish thrusting pattern, focusing on the specific actions taken when the structure is confirmed. These real-world applications help solidify the rules.
The trade is observed on the GBP/USD H4 chart within a strong, confirmed downtrend (price is trending clearly below the 200-period Moving Average).
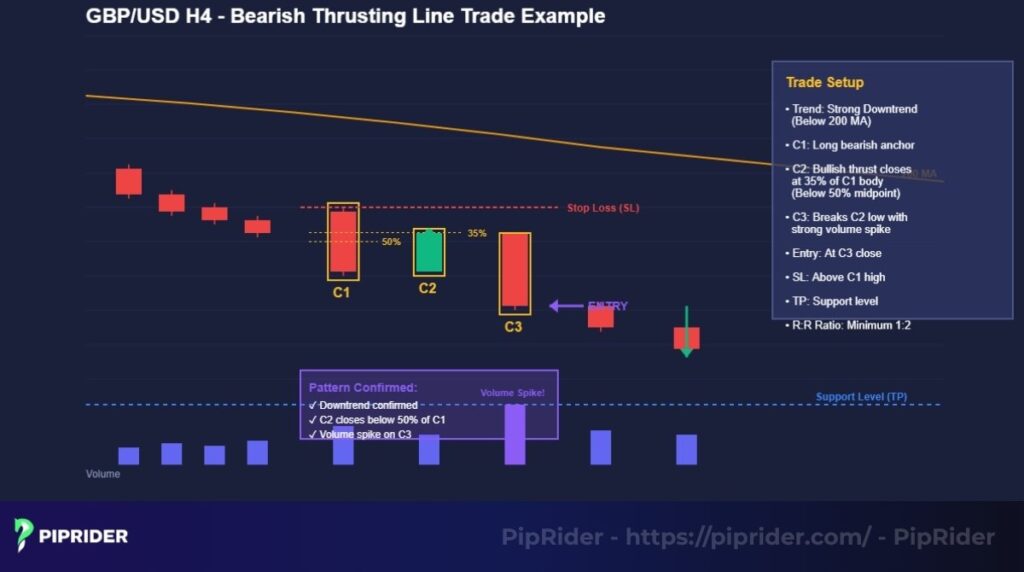
- C1 (The Anchor): A long, dominant bearish candle forms, confirming that sellers are in total control of the higher timeframe structure.
- C2 (The Thrust): The subsequent bullish candle attempts a counter-rally but decisively stalls and closes at the 35% mark of C1’s real body. This confirms the structural failure of the buyers, as they remain trapped well below the 50% midpoint barrier.
- C3 (The Trigger): The price breaks the low of C2 and closes sharply downward. Because this is a Spot Forex pair, we observe a strong expansion in bearish momentum and tick activity (rather than relying on traditional stock market volume bars). This definitive close provides the final, mandatory signal for entry.
Trade Execution:
- Entry Point: Execute a Short Sell position immediately upon the close of C3.
- Stop-Loss (SL) Placement: Place the SL tightly, just above the absolute high of C1. This extreme point defines the pattern’s structural failure boundary.
- Take-Profit (TP) Target: Set the TP at the nearest major Daily Support level, ensuring the setup yields a minimum 1:2 Risk-to-Reward (R:R) ratio.
Results and Lessons Learned
The trade moved steadily in the direction of the original downtrend, hitting the initial profit target. The strong bearish momentum on the confirmation candle (C3) proved to be the critical filtering factor for this highly disciplined setup. The ability to define the Stop-Loss precisely based on C1’s structural high allowed for exceptional risk control, capitalizing on the psychological fact that the buyers’ countermove had failed decisively.
7. Trading Tips for the Thrusting Candlestick Pattern
Successfully trading the bearish thrusting pattern depends entirely on discipline, patience, and strict adherence to risk rules. Consider these five golden rules as your final checklist before pulling the trigger:
- Avoiding False Signals (The Strict 50% Rule): Be mathematically stringent with the midpoint rule. If C2 closes even one pip at or above the 50% line of C1, the continuation signal is immediately invalidated. Furthermore, never enter early, wait for a definitive close on the breakout candle (C3), supported by either a volume spike (in Stocks/Crypto) or strong bearish tick momentum (in Forex).
- Strict Risk Management (R:R Ratio): Utilize the pattern’s clear structure to define a logical Stop-Loss (SL) just above the extreme high of the C1 anchor candle. Always aim for a minimum 1:2 Risk-to-Reward (R:R) ratio on your primary target to maintain a sustainable mathematical edge.
- When NOT to Trade (The Context Filter): Context overrides the candlestick shape. Avoid trading the pattern if it forms directly into a major horizontal Support level, or during non-trending, choppy consolidation ranges. These conditions reliably lead to whipsaws.
- Staying in the Winning Trade (Trailing Stops): Because the thrusting pattern signals a trend continuation, don’t artificially cap your profits. Consider a partial exit (scaling out) at your 1:2 R:R target, and use a Trailing Stop-Loss for the remaining position. Move your SL down behind newly formed swing highs to ride the extended macro downtrend.
- Timeframe Alignment (MTFA): The highest probability setups occur when multiple timeframes agree. If you spot a bearish thrusting pattern on the 1-Hour (H1) chart, check the 4-Hour (H4) or Daily chart to ensure the macro trend is also heavily bearish. Never trade a LTF continuation pattern against a HTF reversal.
8. Pros and Cons of the Bearish Thrusting Pattern
The thrusting pattern is a useful trend-following utility, but like any moderate-strength technical signal, understanding its exact structural strengths and inherent limitations is key to a robust, risk-averse trading strategy.
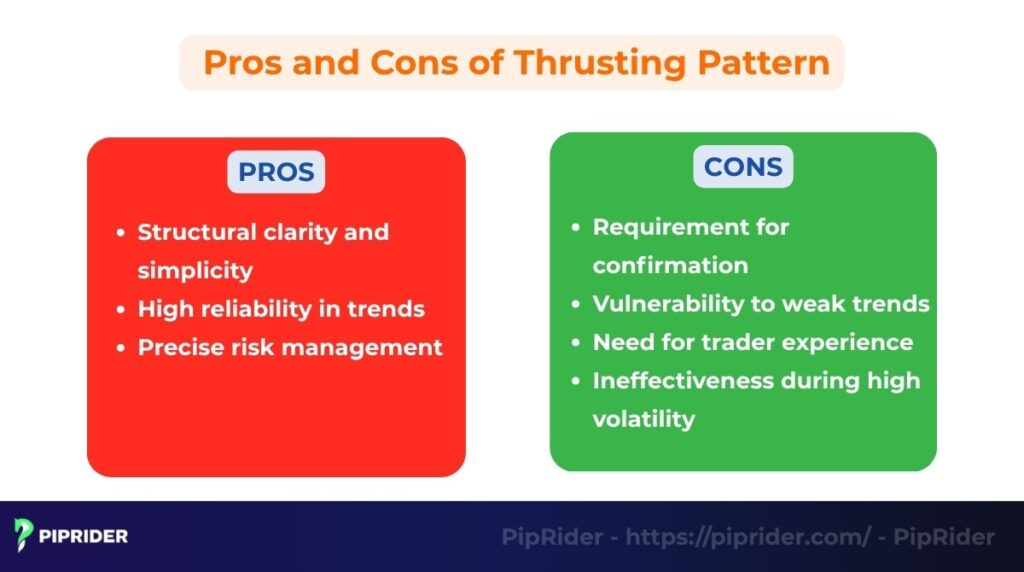
8.1. Pros (The Advantages)
While not the strongest pattern in the candlestick dictionary, it offers several clear structural and risk-management advantages for disciplined momentum traders:
- Structural Clarity and Simplicity: The pattern is mathematically easy to identify due to its strict visual boundary: the second candle (C2) must close short of the 50% midpoint of C1. This leaves little room for subjective guessing.
- Precise Risk Management: The pattern’s clear structural extremes (the absolute high of the C1 anchor candle) allow for exceptionally logical and tight Stop-Loss placement. This significantly improves your potential Risk-to-Reward (R:R) ratio.
- Clear Directional Bias: When observed within a strong, established Higher Timeframe (HTF) downtrend, it provides a logical area to “scale in” or add to existing short positions after a minor, failed pullback.
8.2. Cons (The Limitations)
Despite its precise structure, this pattern presents inherent challenges that require strict external validation and deep market context:
- Moderate Signal Strength: Unlike a massive Bearish Engulfing pattern, the thrusting line is only a moderate continuation signal. The bulls did manage to push the price up temporarily, meaning the bears are not in absolute, uncontested control.
- Mandatory Confirmation Required: It is never a standalone entry signal. It requires mandatory validation from a third breakout candle (C3), supported by either a volume spike (Stocks/Crypto) or strong tick momentum (Forex), to filter out whipsaws.
- Vulnerability to Ranging Markets: It generates numerous unreliable and false signals when the market is choppy, sideways, or consolidating. Trading this pattern without a clear prior trend is a guaranteed way to lose capital.
- Requires Psychological Discipline: Effectively differentiating it from strong reversal patterns (like the Piercing Line) and consistently obeying the strict 50% rule demands high trader discipline and experience.
9. Frequently asked questions about thrusting pattern
10. Conclusion
The Thrusting Pattern is a reliable structural tool, defined by the failure of the second candle to close past the 50% midpoint of the anchor candle. This structural failure provides a high-conviction signal for momentum traders.
Success depends on strict validation and risk control. Always confirm the pattern with a sharp Volume spike on the breakout candle. Define your Stop Loss tightly using the C1 high/low and adhere to a minimum 1:2 R:R ratio. Avoid trading any pattern that violates the 50% rule or forms at major Support/Resistance.
To explore more high-probability signals, check out the Forex Chart Patterns section at Piprider.


