
In the world of trading, the chart often feels like a battlefield of noise. You see a strong green candle and wonder, “Is this the start of a real rally, or just a bull trap?” You see prices dip and ask, “Is the trend over, or is this just a healthy pullback?”
Most standard indicators try to answer these questions by looking at price velocity or closing prices alone, but that’s only half the story. The Accumulative Swing Index (ASI) offers a different perspective. It’s designed to cut through the noise and reveal the true commitment of buyers and sellers behind the price action. Think of it not as another line on your screen, but as a lens to see the market’s underlying conviction.
Key Takeaways
- The Accumulative Swing Index (ASI) measures the true conviction of buyers and sellers using the full price range (OHLC).
- A rising or falling ASI line validates the authenticity of an existing trend and its strength.
- Its primary use is identifying divergence (ASI moving opposite to price), signaling potential trend exhaustion.
- It tracks underlying commitment rather than just velocity (like RSI), helping to filter out market noise.
- ASI works best for swing/position trading when combined with support and resistance levels.
1. What is the The Accumulative Swing Index (ASI)?
The Accumulative Swing Index (ASI) is a cumulative technical indicator used to measure the long-term trend and the true conviction behind price movements.
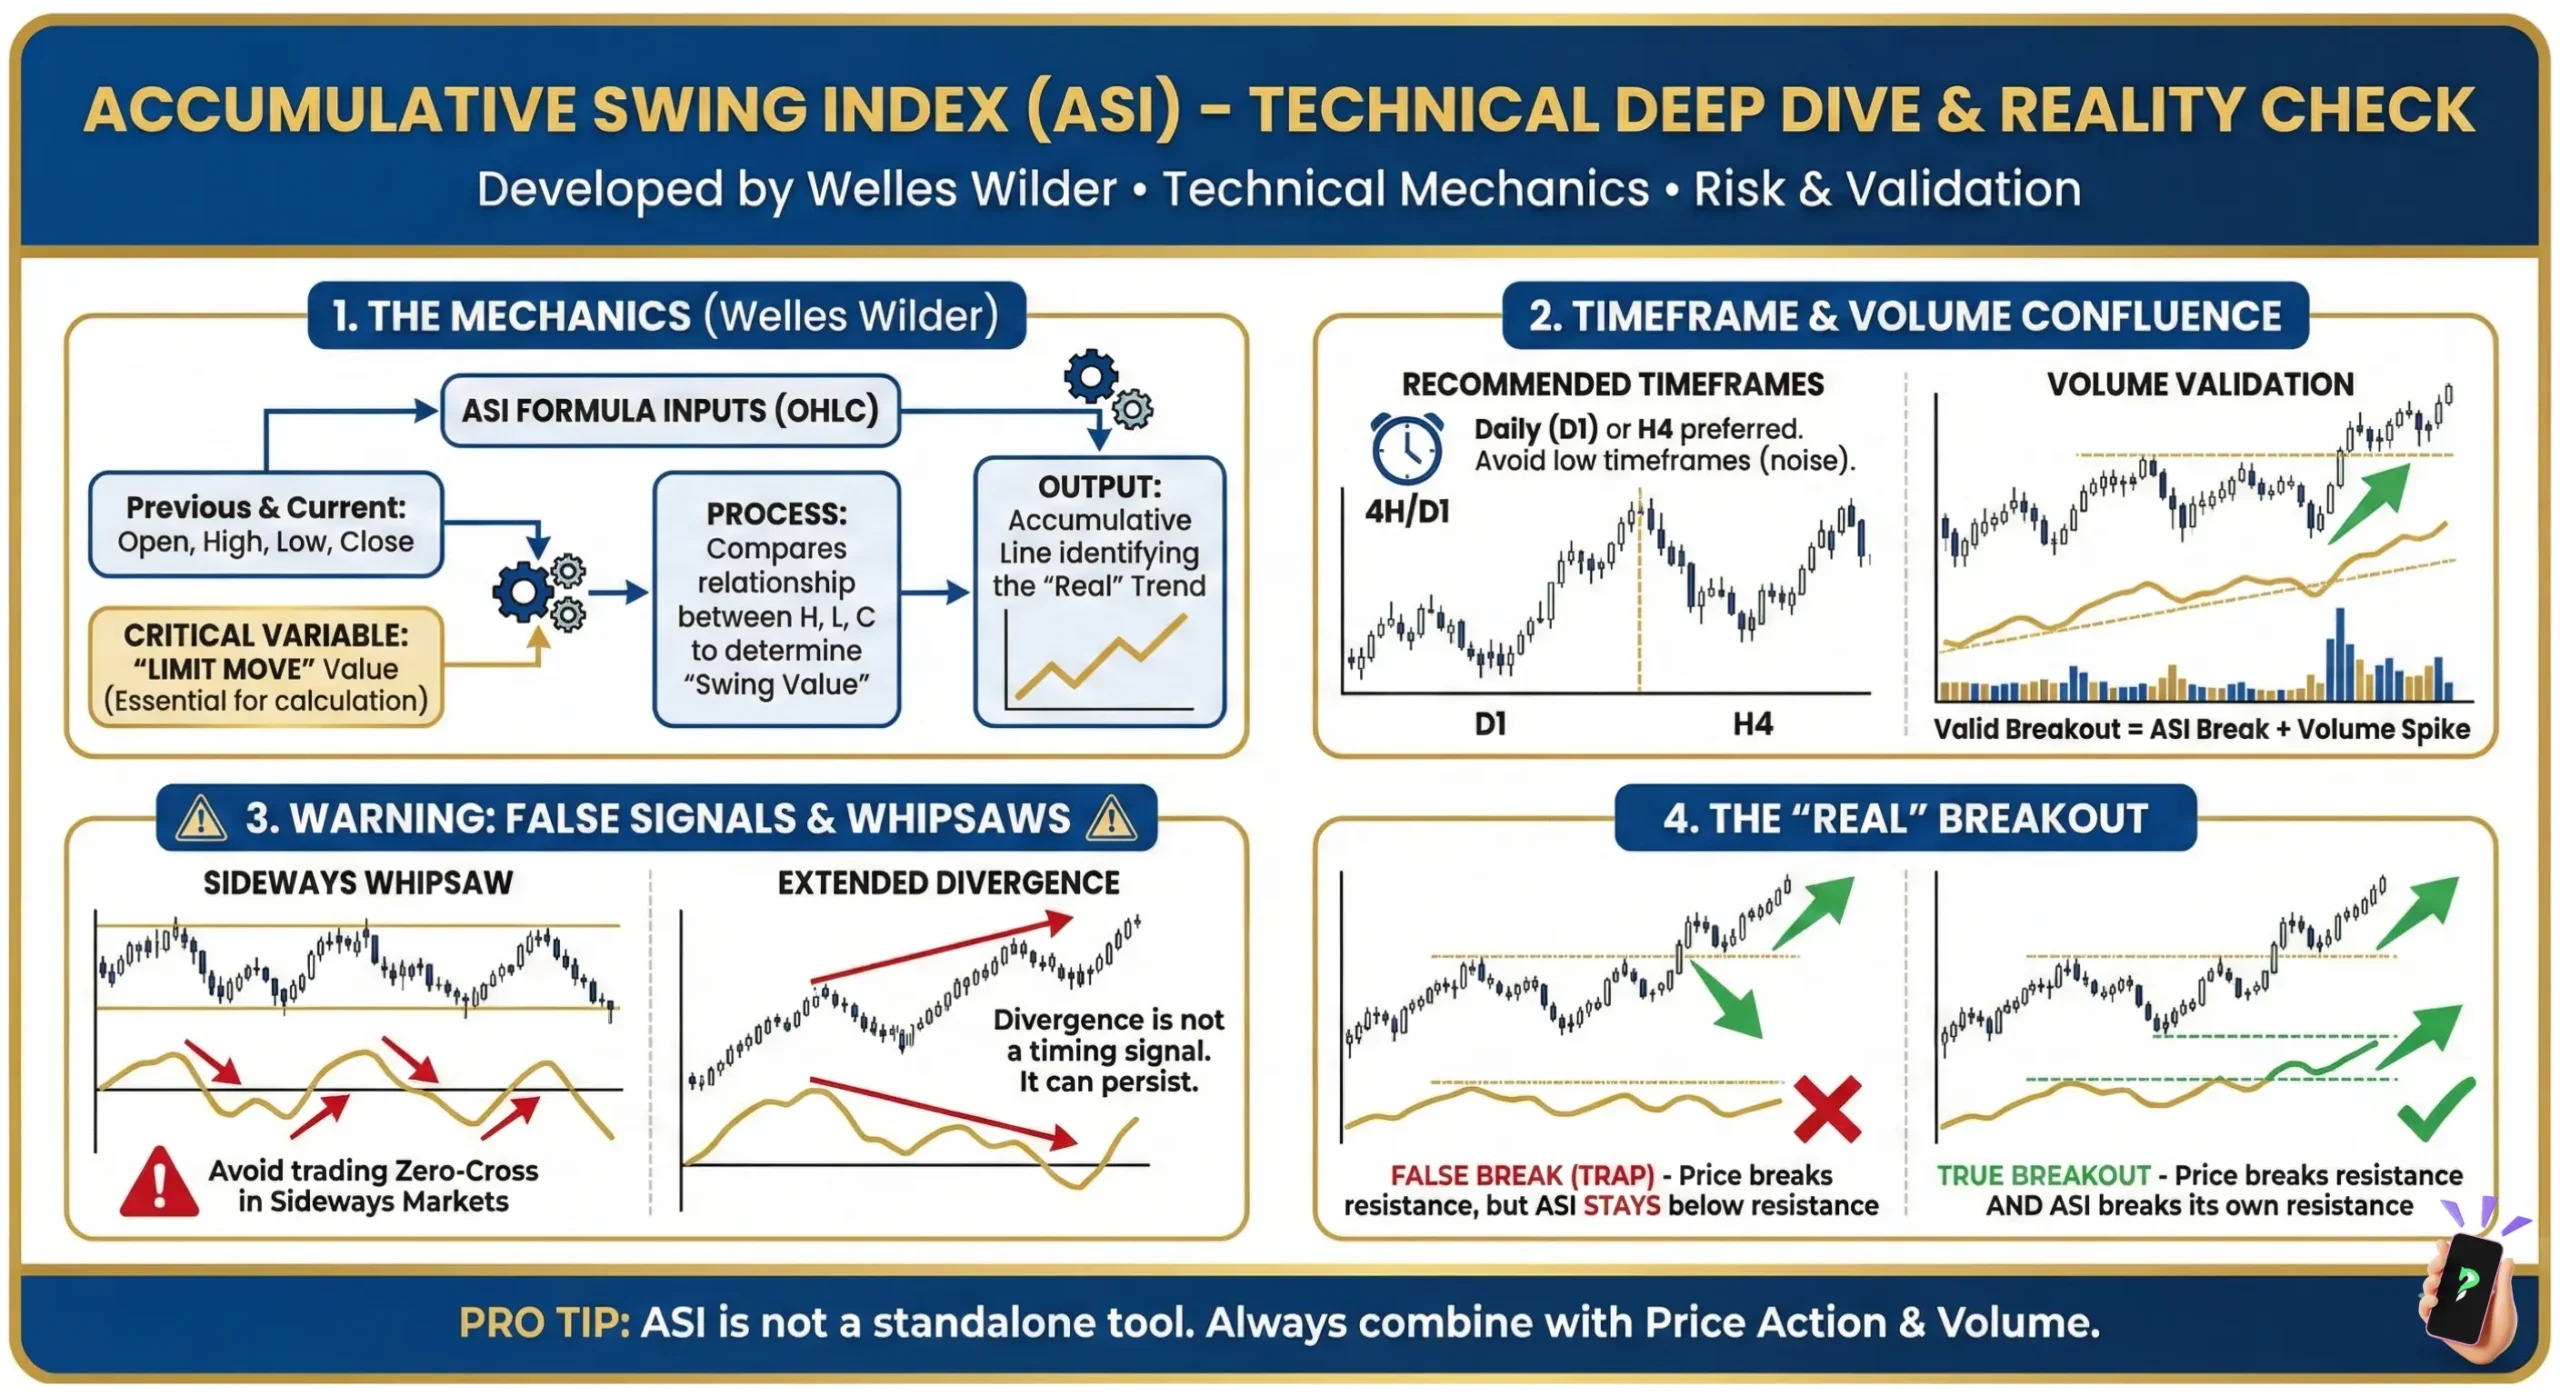
Developed by the technical analysis legend J. Welles Wilder Jr. (creator of famous indicators like the RSI and ATR), the ASI is designed to filter out short-term price noise and reveal the true buying/selling pressure. The ASI operates by meticulously analyzing and comparing the full price range (Open, High, Low, Close) of the current session against the critical price points of the preceding session.
This complex calculation ensures the ASI measures the commitment of large traders, rather than just the velocity of the price move. By accumulating these values over time, the ASI generates a single, smoother line that reflects the underlying strength of the market.
Practical Applications for Traders:
- Trend Confirmation: It helps traders reinforce their confidence in the current trend. A positive and rising ASI confirms a strong uptrend; a negative and falling ASI confirms a strong downtrend.
- Early Reversal Warning: The ASI is an especially powerful tool for spotting divergence when the price and the indicator move in opposite directions, signaling trend exhaustion and impending reversals.
2. How to calculate ASI
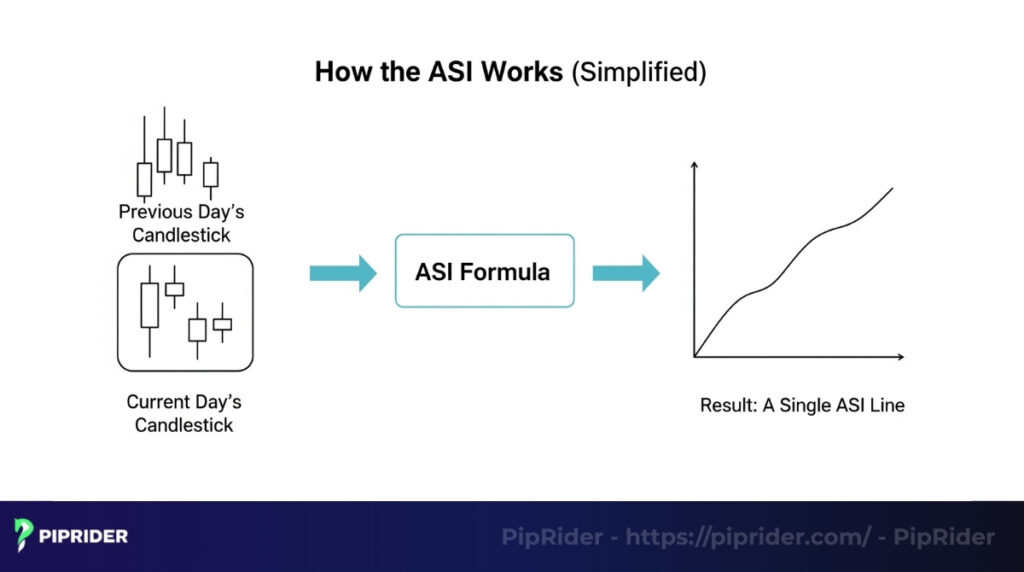
The Accumulative Swing Index (ASI) is generated through a systematic two-step process that transforms raw price data into a smooth, directional line.
Step 1: Calculating the Swing Index (SI)
The process begins by calculating the Swing Index (SI), which quantifies the buying or selling strength of a single trading session. The logic is based on determining the “real” price movement after accounting for volatility.
The full SI formula is complex, involving a comparison of the current session’s price range to the previous close:
SI = 50 * [(Cyesterday – C) + 0.5 * (Cyesterday – Oyesterday) + 0.25 * (C – O)] / R * (K / T)
- The formula incorporates a variable ‘R’ (representing the largest of three key price differences).
- Key Takeaway: The SI results in a positive or negative value that quantifies the day’s true underlying buying or selling pressure.
Step 2: Accumulating the Index (ASI)
The second step is the accumulation that transforms the raw SI data into the final, smooth ASI line seen on the chart.
The final Accumulative Swing Index is calculated by simply adding the current day’s SI value to the running total of the previous day’s ASI:
ASI = Previous Day’s ASI + Today’s Swing Index (SI)
This ongoing summation process is what filters the short-term noise, creating a long-term tally that reflects sustained momentum shifts.
3. The Swing Index (SI) vs. the Accumulative Swing Index (ASI): A critical distinction
It is essential to distinguish between the raw, per-period data and its cumulative result. While the Swing Index (SI) quantifies the buying or selling pressure for a single session, the Accumulative Swing Index (ASI) transforms this data into an actionable, long-term trend indicator. Traders plot the ASI on their charts, not the SI.
Swing Index (SI)
The Swing Index (SI) is the raw data point for a single period. It represents the “daily vote” of buying or selling pressure. If plotted directly, the SI would appear as a very jagged, erratic oscillator moving above and below a zero line. Because it is highly volatile, the SI is generally not suitable for direct visual trend analysis.
Accumulative Swing Index (ASI)
The ASI represents the cumulative, long-term tally of all previous SI values. This essential accumulation process smooths the raw SI data into a single, flowing line that is far more useful for identifying trends, divergences, and sustained momentum shifts.
| Feature | Swing Index (SI) | Accumulative Swing Index (ASI) |
| Purpose | Measures pressure for a single session (Raw data) | Measures long-term trend and conviction (Cumulative data) |
| Appearance | Jagged and erratic (Highly volatile) | Smooth and flowing (Filtered and stable) |
| Function | Represents the “daily vote” of buyers vs. sellers | Identifies trends and divergences |
| Utility | Generally not plotted by traders | The primary line plotted for analysis |
4. How to trade with ASI
Looking to leverage the Accumulative Swing Index (ASI) for better trading decisions? Let’s dive into how to effectively use ASI in your trading strategy.
4.1. Understanding the ASI Indicator
The ASI is plotted as a single line, typically below the main price chart. It aggregates “Swing Index” values, calculated based on the open, high, low, and close prices of the current and previous periods.
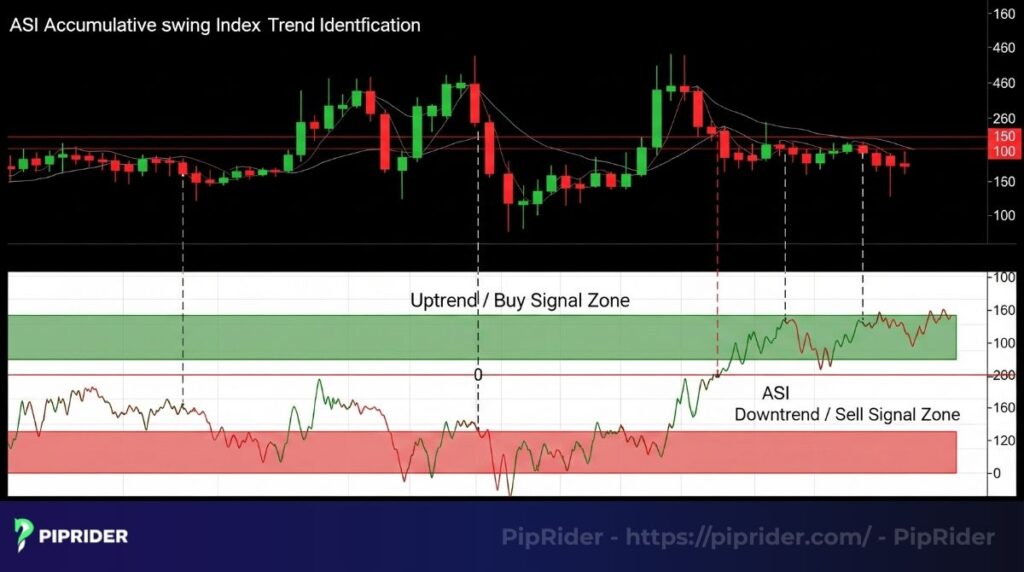
- Trend direction:
- Positive ASI values (above the zero line): Indicate an uptrend or bullish momentum.
- Negative ASI values (below the zero line): Indicate a downtrend or bearish momentum.
- Crossing the zero line: Can signal a potential trend reversal.
- Trend strength: The magnitude of the ASI value (how far it is from the zero line) suggests the strength of the trend. Larger positive values indicate a stronger uptrend, and larger negative values indicate a stronger downtrend.
4.2. Core Trading Strategies with ASI
The ASI is most effective when used as a confirmation tool rather than a standalone indicator.
- Trend identification and following:
- Buy Signal (Uptrend): When the ASI line is consistently above the zero line and rising, it confirms an uptrend. Traders might look for long entry opportunities on pullbacks or consolidation within this trend.
- Sell Signal (Downtrend): When the ASI line is consistently below the zero line and falling, it confirms a downtrend. Traders might look for short entry opportunities on rallies or consolidation within this trend.
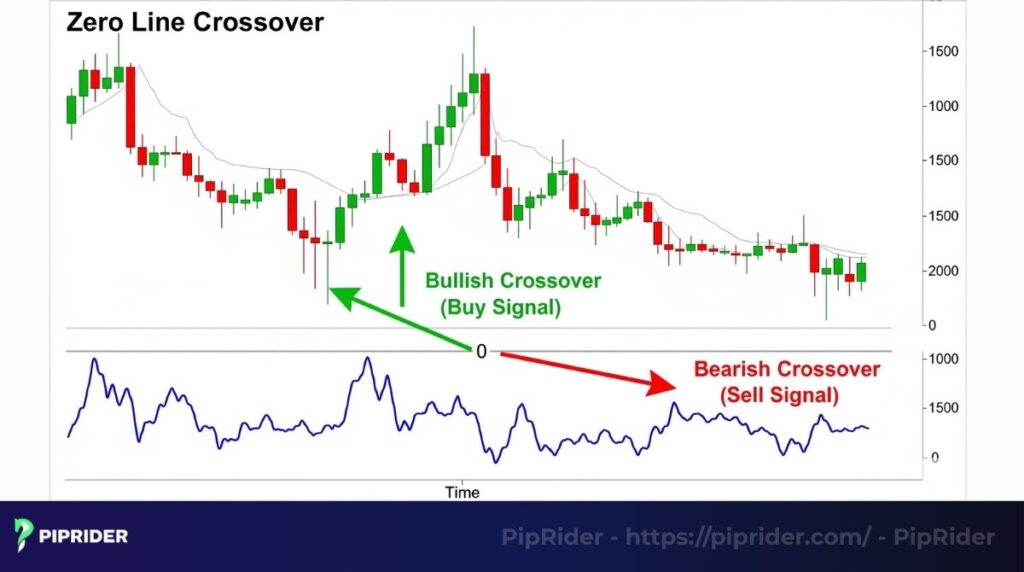
- Zero line crossover:
- Bullish crossover: When the ASI line crosses above the zero line from below, it can signal a shift to an uptrend, potentially indicating a buy signal.
- Bearish crossover: When the ASI line crosses below the zero line from above, it can signal a shift to a downtrend, potentially indicating a sell signal.
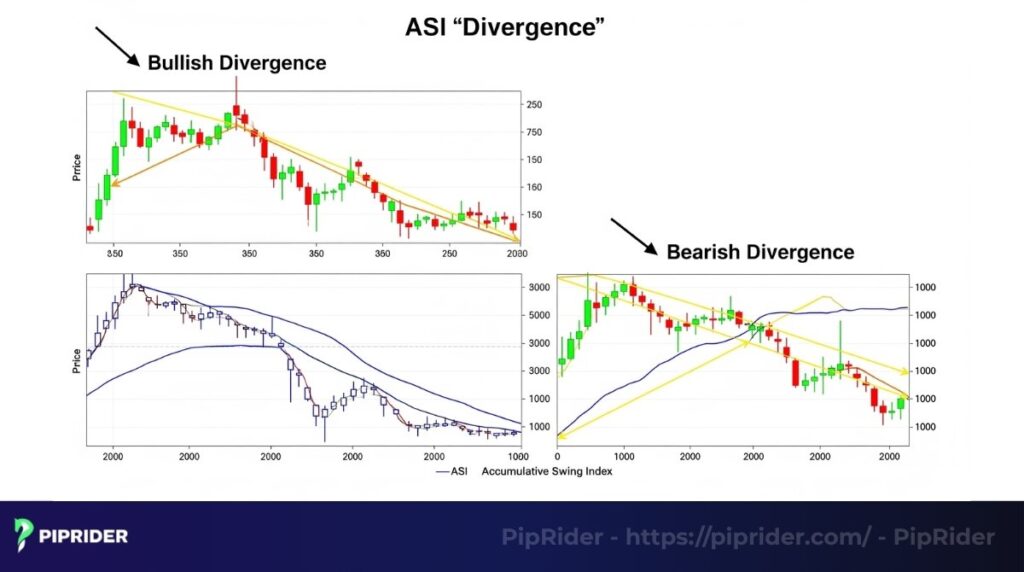
- Divergence:
- Bullish divergence: Occurs when the price makes a lower low, but the ASI makes a higher low. This suggests that the downtrend is losing momentum and a potential bullish reversal might be coming.
- Bearish divergence: Occurs when the price makes a higher high, but the ASI makes a lower high. This indicates that the uptrend is weakening, and a potential bearish reversal could be imminent. Divergence signals are strong reversal indicators.
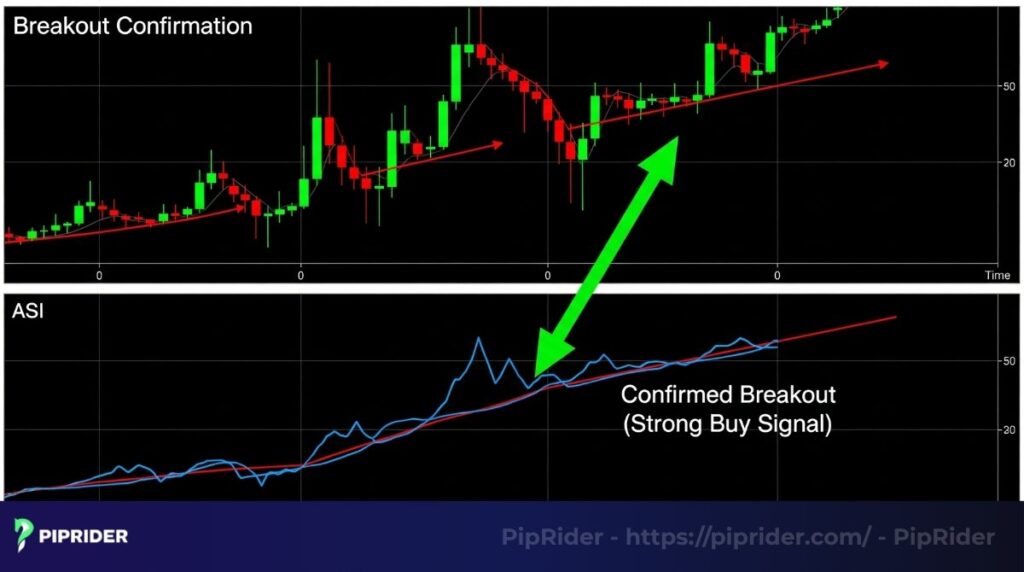
- Breakout confirmation:
- Draw trendlines directly on the ASI indicator, similar to how you draw them on price charts.
- If a trendline on the price chart is broken, look for a corresponding break in a similar trendline on the ASI. This correlation confirms the breakout’s validity and helps to avoid false signals. For instance, if price breaks above resistance and ASI also breaks above its corresponding resistance trendline, it’s a stronger buy signal.
4.3. Combining ASI with other indicators
To enhance accuracy and reduce false signals, it’s highly recommended to use ASI in conjunction with other technical analysis tools:
- Moving averages: Use moving averages (e.g., 50-period, 200-period) to confirm the overall trend. If ASI signals an uptrend, and price is above key moving averages, it strengthens the conviction.
- Support and resistance levels: Use ASI to confirm breakouts of established support and resistance levels on the price chart.
- Oscillators (e.g., RSI, Stochastic): These can help identify overbought/oversold conditions, which might align with ASI’s trend exhaustion or reversal signals. For example, if ASI shows a bearish divergence and RSI is in overbought territory, it’s a stronger sell signal.
4.4. Risk management
As with any trading strategy, solid risk management is crucial:
- Stop-loss orders: Always place stop-loss orders to limit potential losses if the trade moves against you.
- Position sizing: Determine appropriate position sizes based on your risk tolerance and account size.
- Monitor closely: Keep an eye on both the price action and the ASI indicator for any signs of trend weakening or reversal.
By understanding its signals and using it in combination with other tools, the Accumulative Swing Index can be a valuable addition to a trader’s technical analysis arsenal.
5. What are the ASI strategies?
This is where we move from theory to application. The ASI shines in three key strategic areas.
5.1. Trend confirmation: Trading with conviction
This is the most fundamental use. In a healthy uptrend, you should see both the price making higher highs and the ASI line climbing alongside it. This synergy confirms that the trend has genuine momentum behind it. If the price is grinding higher but the ASI is flat or declining, it’s a warning sign that the trend is weak and vulnerable.
5.2. Divergence: The market’s “silent warning”
This is without question the most potent application of the ASI. Divergence occurs when the price and the indicator are telling you two different things, often signaling an impending reversal.
- Bullish divergence (a potential bottom): The ASI serves as a key alert to become highly attentive as a downtrend matures.
- Real-world scenario: Imagine the S&P 500 (SPY) has been selling off for weeks. It just printed a frightening new low, and sentiment is overwhelmingly bearish. However, you notice the ASI has formed a higher low.
- The interpretation: Even though the price was pushed to a new low, the force and commitment behind that push were significantly weaker than before. This provides a compelling reason to begin scouting for a potential entry point.
- Bearish divergence (a potential top): This acts as an essential alarm bell during times of peak market optimism.
- Real-world scenario: Let’s say a high-flying tech stock like NVIDIA (NVDA) has been on a tear, hitting a new all-time high. But you check the ASI and see it has failed to make a new high, instead printing a lower high.
- The interpretation: The buying pressure is fading. While the price made one last push, the underlying momentum is gone. This is a signal that the rally may be exhausted and vulnerable to a sharp correction.
5.3. ASI trendline breaks: A leading signal for breakouts
Advanced traders often draw trendlines directly on the ASI indicator itself. Because momentum often shifts before price, the ASI can provide an early warning. If the price is still respecting its uptrend line, but the ASI breaks below its own corresponding trendline, it’s a significant red flag that the price trend may soon follow.
6. ASI vs. the usual suspects: RSI & MACD
Many traders ask, “Why use ASI when I already have RSI or MACD?” The key difference lies in what they measure:
- RSI & MACD are primarily velocity indicators. They tell you how fast and how far the price has moved recently. They are excellent for identifying overbought and oversold conditions.
- ASI is a commitment indicator. It cares less about the speed of the move and more about the conviction behind it, by analyzing the full open-high-low-close range.
Analogy: Imagine a car. RSI tells you its current speed (e.g., 100 mph). ASI tells you how hard the driver is actually pressing the gas pedal. The car might still be moving at 100 mph due to inertia, but if the ASI shows the driver has taken their foot off the gas, you know a slowdown is imminent.
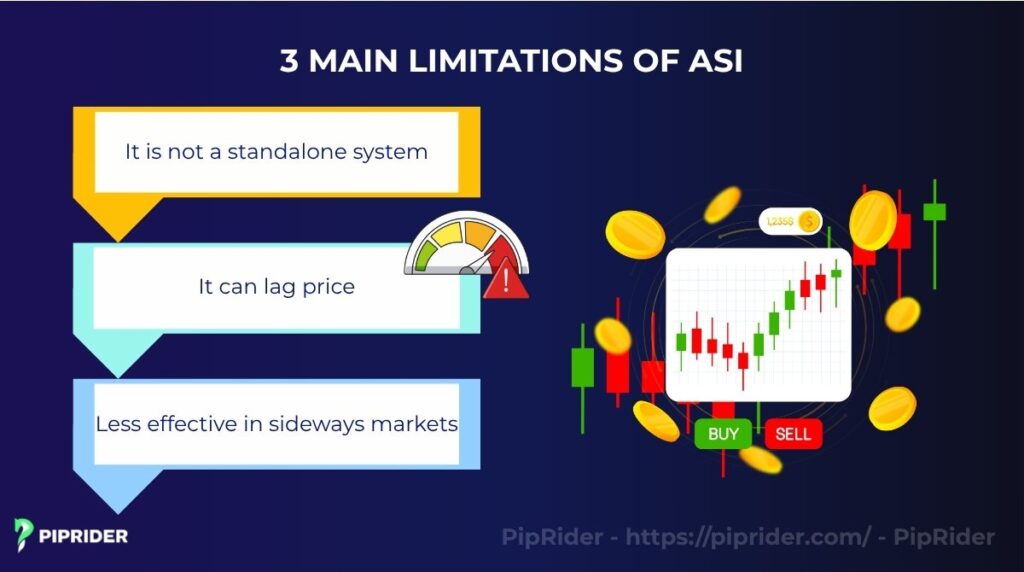
7. What are the limitations of ASI?
No indicator is a crystal ball. To apply the ASI effectively, it is crucial to respect its inherent limitations.
- It is not a standalone system: This is the golden rule. Relying solely on ASI signals is a recipe for disaster. An ASI signal becomes exponentially more powerful when confirmed by other factors, like a major support/resistance level or a key candlestick pattern.
- It can lag price: Due to its cumulative nature, the ASI can sometimes confirm a move after a significant portion of it has already occurred. It is not designed for high-frequency scalping. It’s more suited for swing and position trading on daily or 4-hour charts.
- Less effective in sideways markets: In choppy, range-bound markets where there is no clear directional pressure, the ASI line will tend to hover around zero and provide conflicting signals. It performs best when a clear trend is present.
9. Frequently asked questions about accumulative swing index
9. Conclusion: Integrating ASI into Your Trading Workflow
The Accumulative Swing Index isn’t a holy grail, but it’s an exceptional tool for gaining a deeper understanding of market dynamics. By revealing the commitment behind price swings, it allows you to confirm trends with greater confidence, spot potential reversals before the crowd, and make more informed decisions.
The best way to learn is by doing. Add the ASI to your charting platform and observe its behavior at major market turning points. By adding it to your analytical toolkit, you equip yourself with a more nuanced and powerful view of the market.
Ready to deepen your Forex expertise for beginners? Explore the full range of structured lessons and in-depth guides in Piprider. We encourage you to share your thoughts, questions, and experiences with the ASI indicator by leaving a comment below.
Infographic Section
-
Accumulative Swing Index -
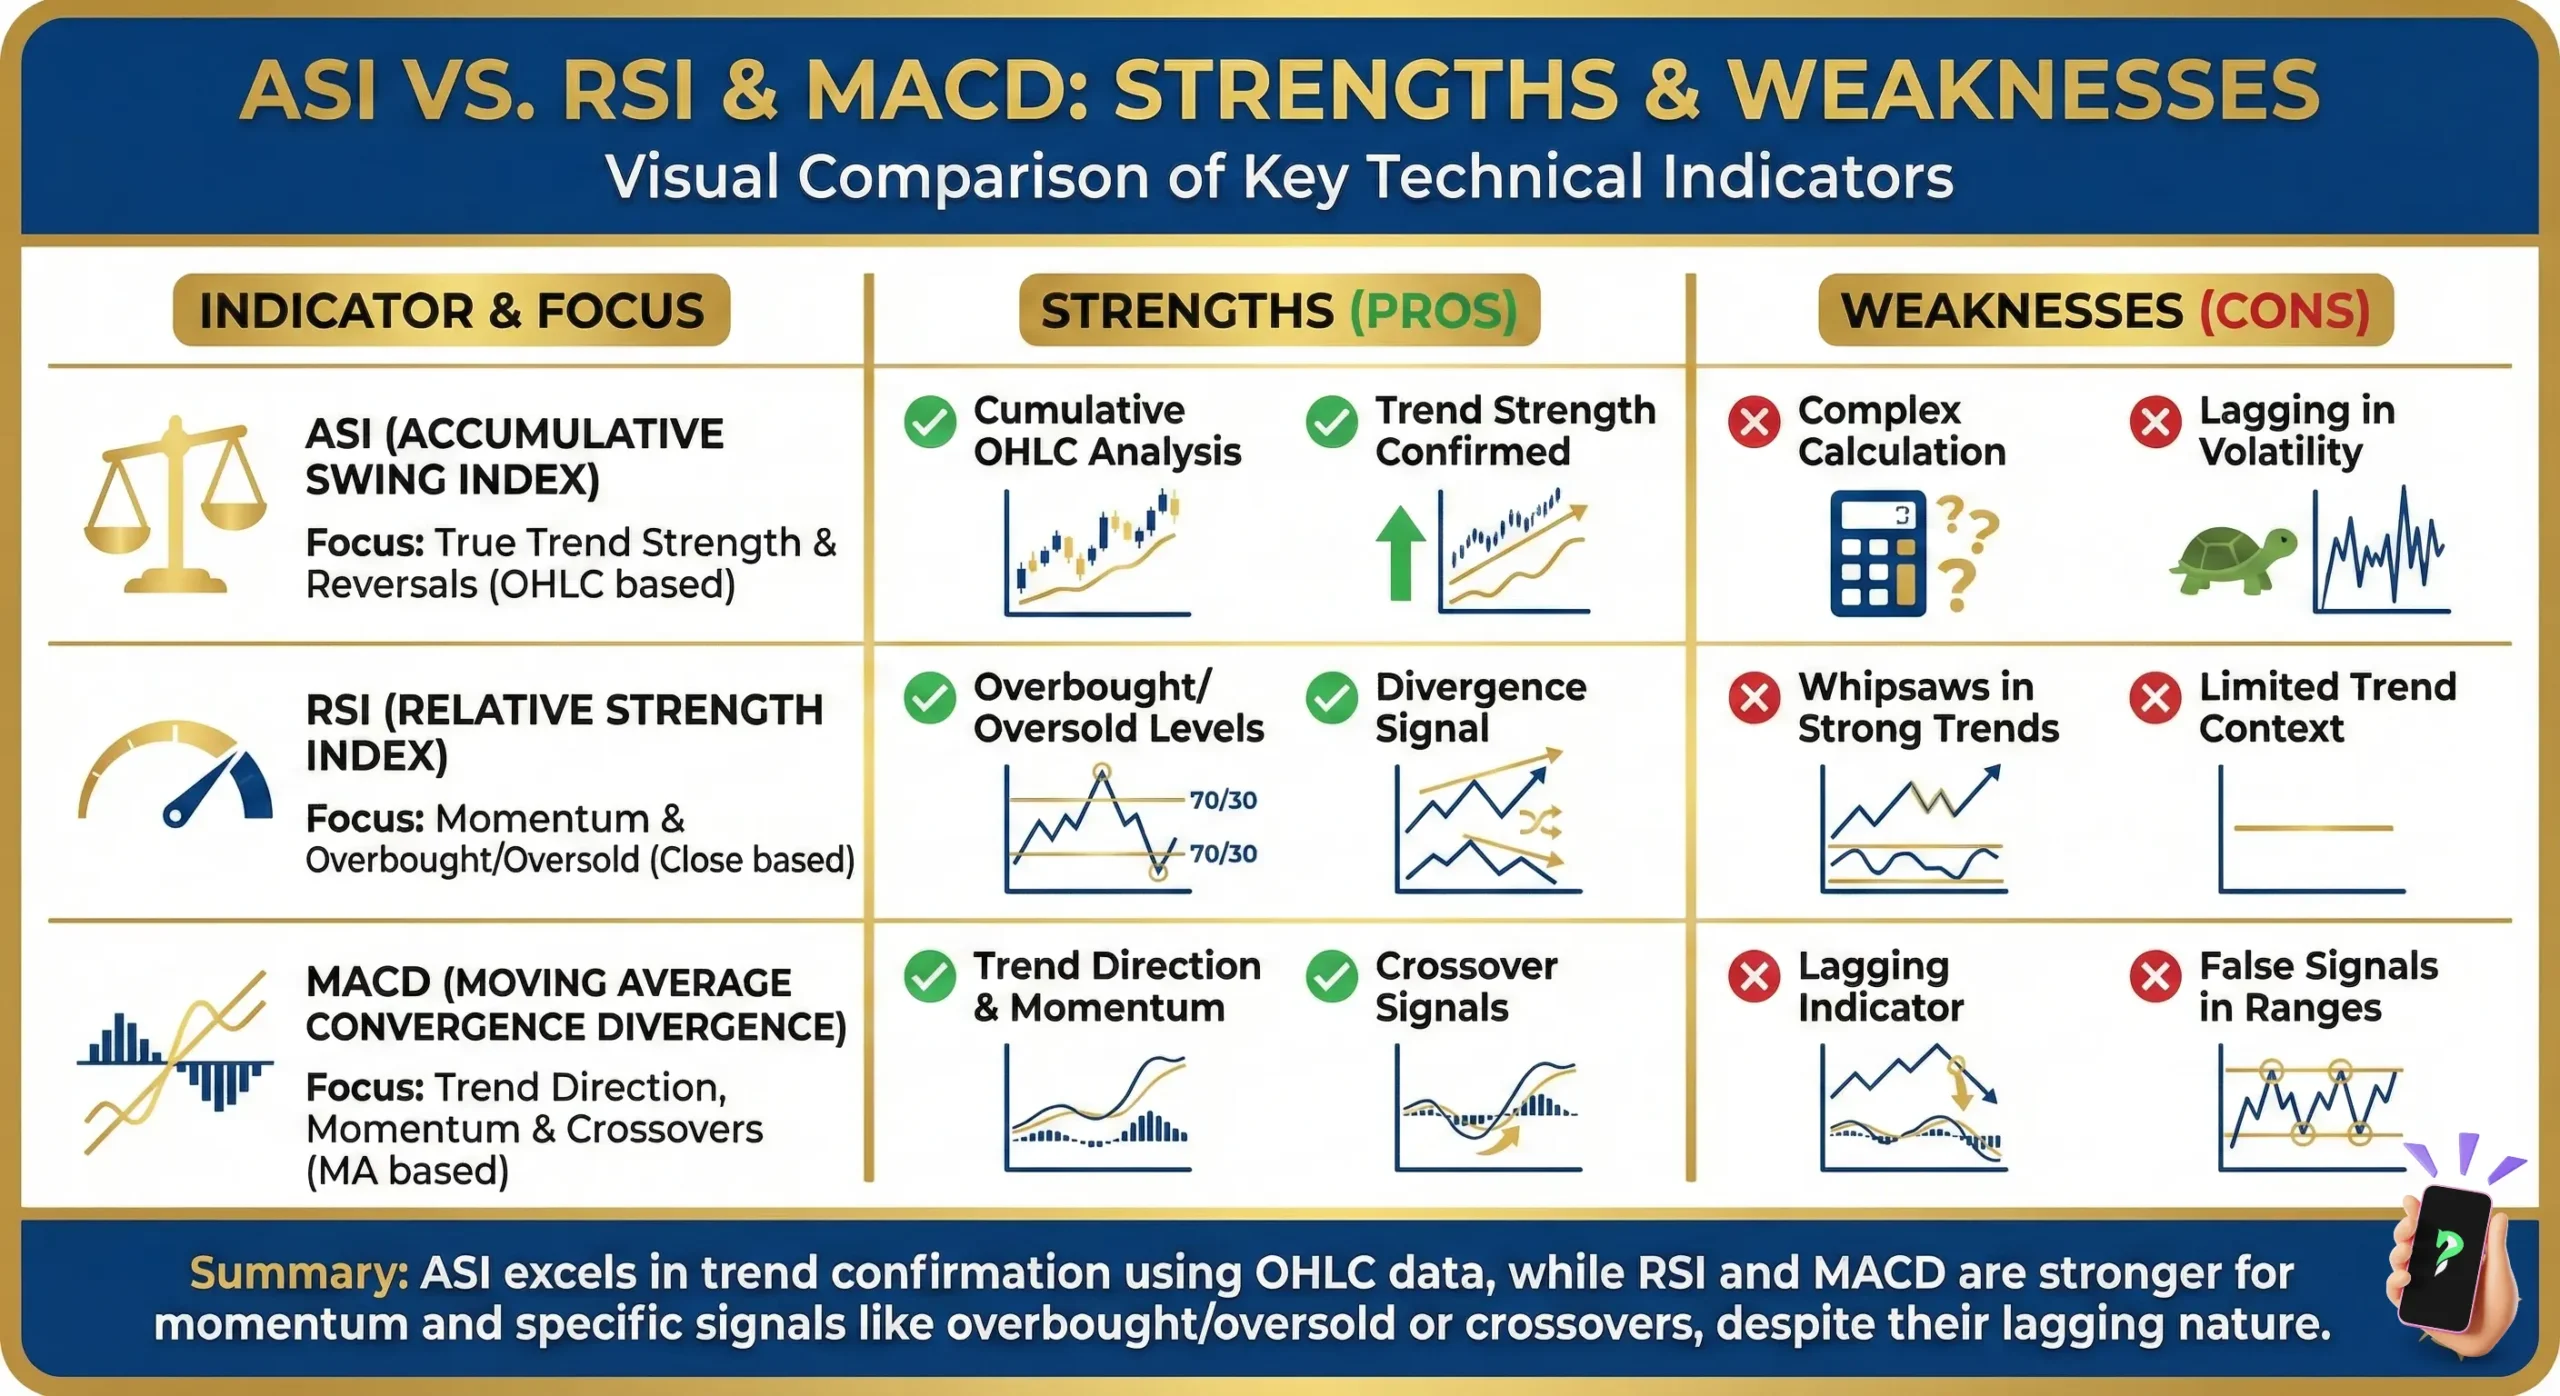
ASI Vs. RSI Vs. MACD


