
In the world of trading, the chart often feels like a battlefield of noise. You see a strong green candle and wonder, “Is this the start of a real rally, or just a bull trap?” You see prices dip and ask, “Is the trend over, or is this just a healthy pullback?”
Most standard indicators try to answer these questions by looking at price velocity or closing prices alone, but that’s only half the story. The Accumulative Swing Index (ASI) offers a different perspective. It’s designed to cut through the noise and reveal the true commitment of buyers and sellers behind the price action. Think of it not as another line on your screen, but as a lens to see the market’s underlying conviction.
Search Lock: Why the ASI Matters
The ASI is most effective as a confirmation indicator, not a standalone trigger. It works best when used to validate long-term trends, spot momentum divergences, or confirm breakouts around major support and resistance levels. For most traders, the highest-value use case is not the zero-line crossover itself, but the way ASI confirms or questions, the conviction behind a price move.
Key Takeaways
- True conviction: The ASI measures the commitment of buyers and sellers using the full price range (OHLC), not just closing prices.
- Trend validation: A rising or falling ASI line validates the authenticity and strength of an existing trend.
- Divergence detection: Its primary use is identifying when the ASI moves opposite to price, signaling potential trend exhaustion.
- Noise filter: By tracking underlying commitment rather than just velocity (like the RSI), it helps filter out market “fakeouts.”
- Best framework: ASI is optimized for swing and position trading when combined with structural levels like support and resistance.
1. What is the The Accumulative Swing Index (ASI)?
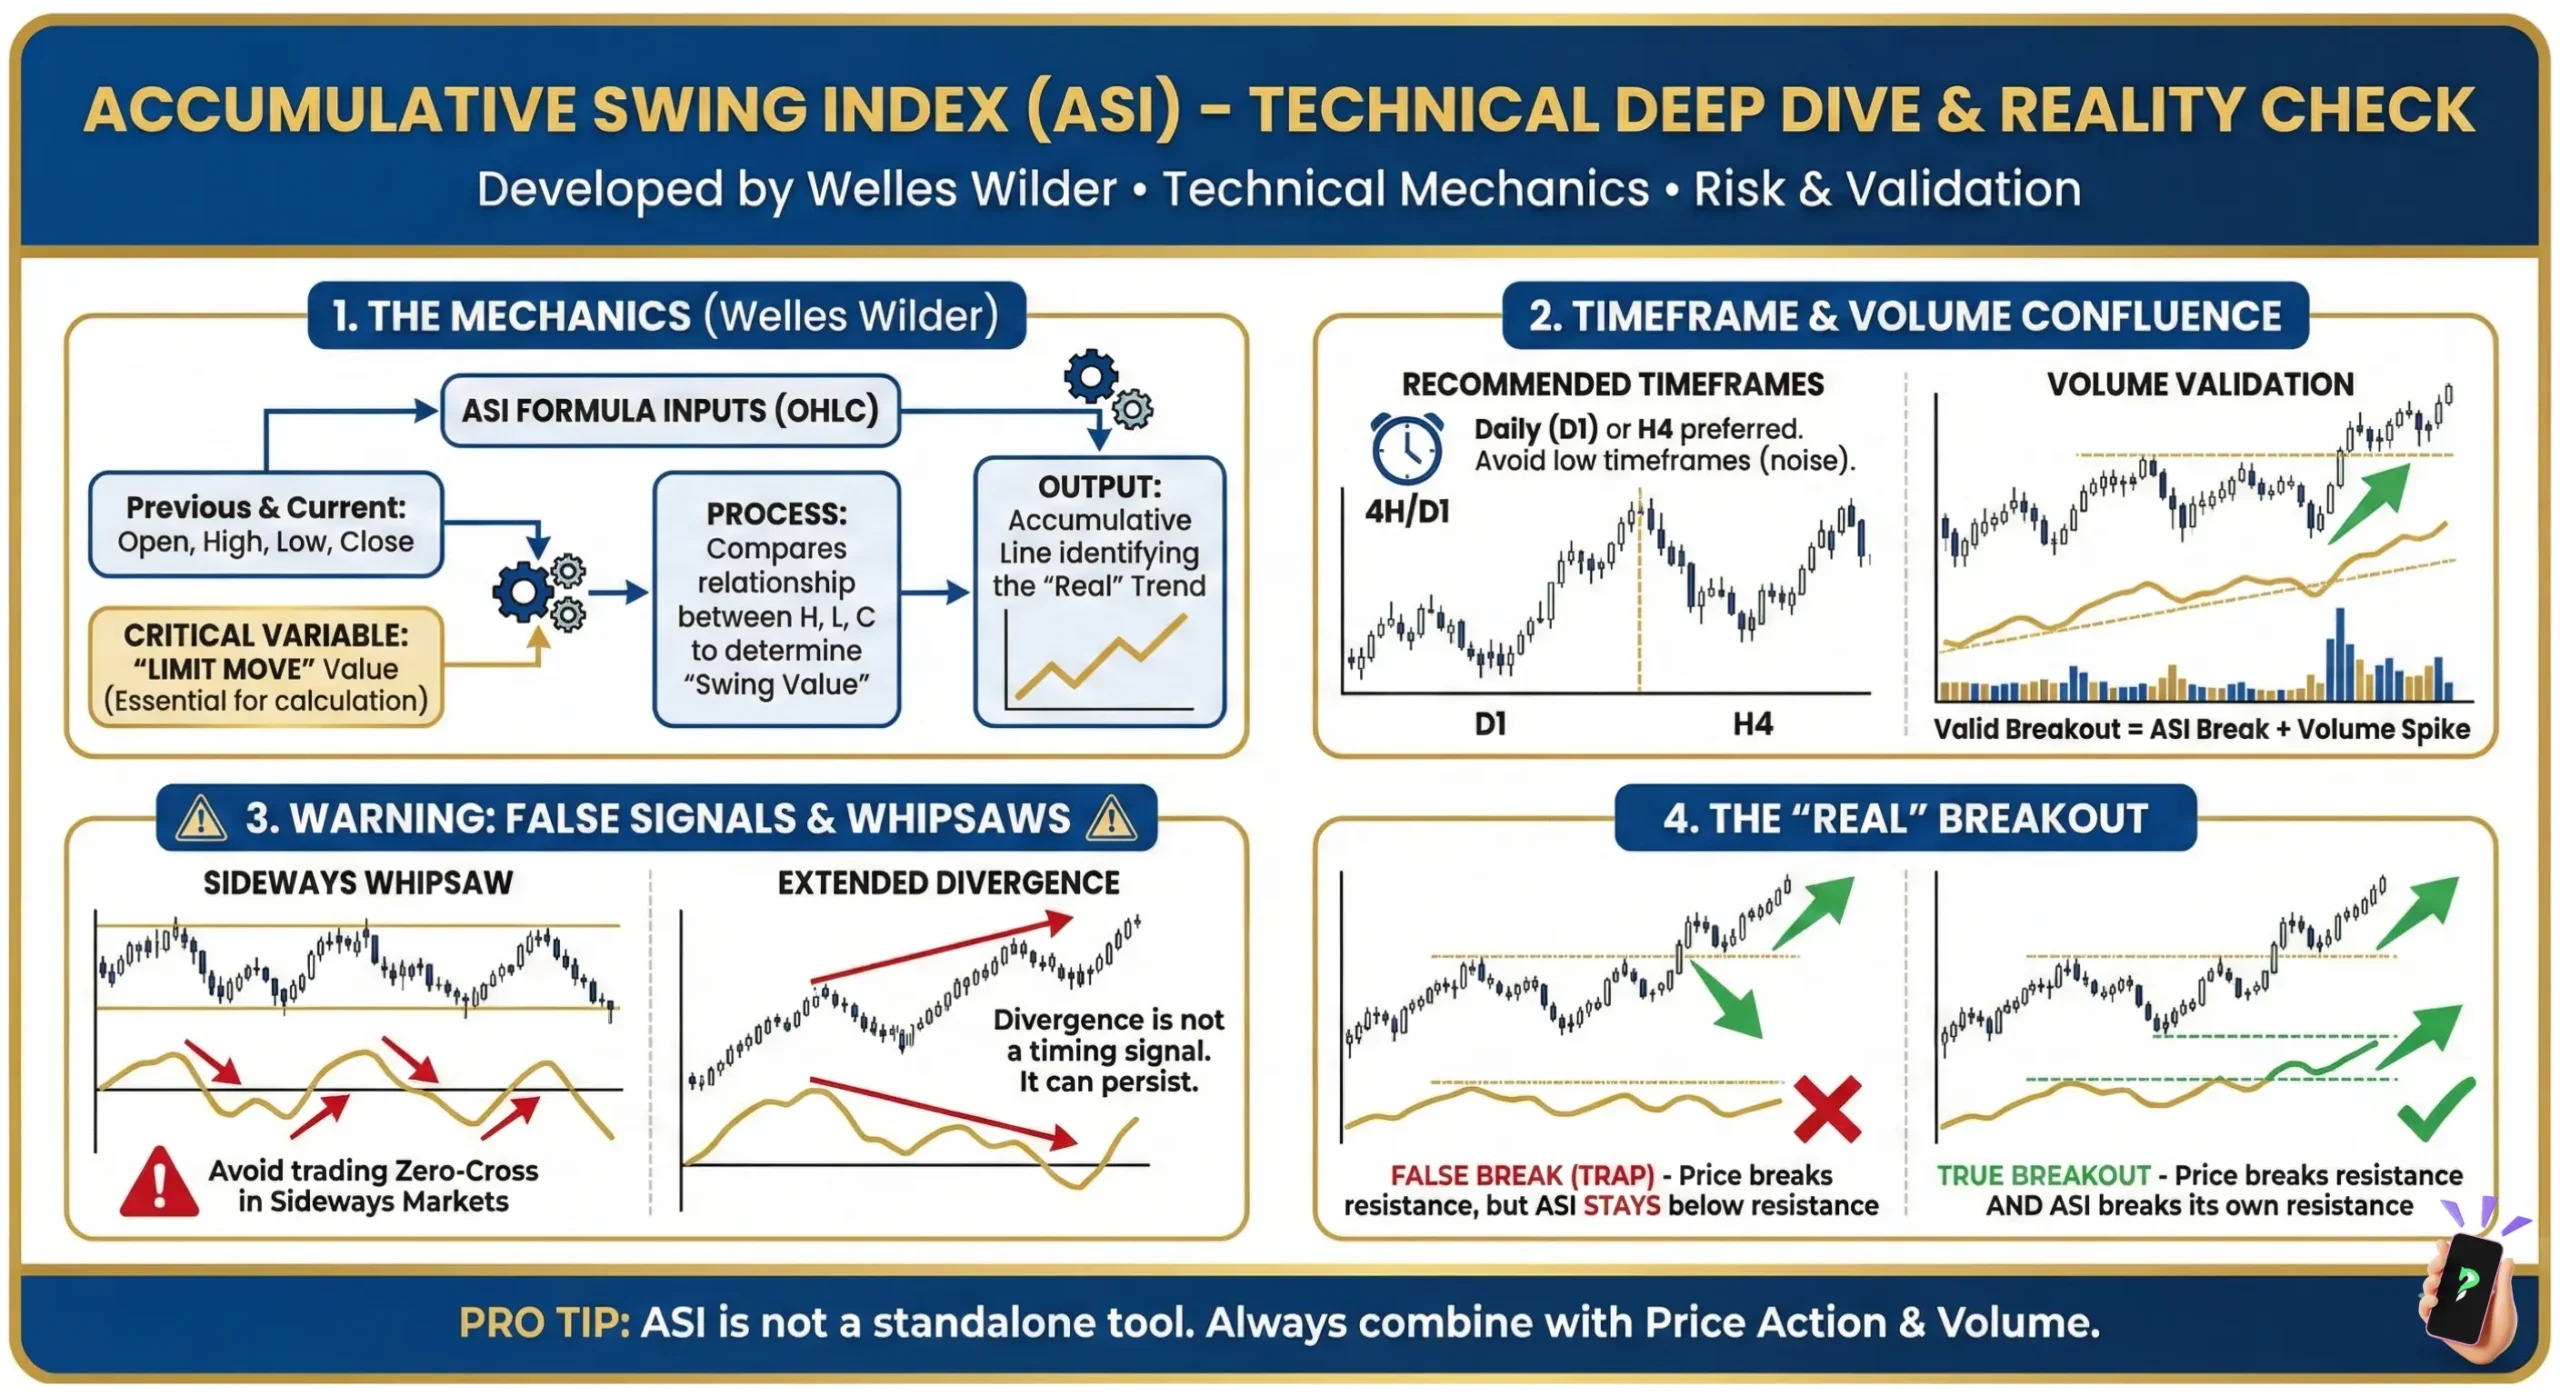
The Accumulative Swing Index (ASI) is a cumulative trend-following indicator that uses the full price range (Open, High, Low, and Close) to measure the “real” strength of a market. Unlike simple oscillators, it tracks long-term conviction rather than short-term speed.
Developed by J. Welles Wilder Jr.—the legendary technical analyst behind the RSI and ATR—the ASI was designed to solve a specific problem: market noise.
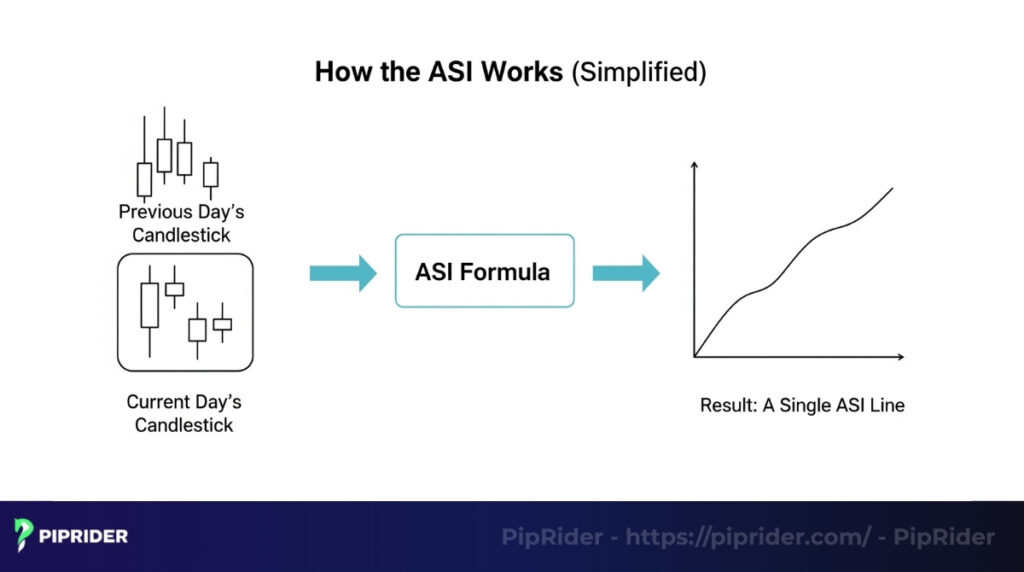
Standard indicators often fluctuate wildly based on small price gaps or isolated closing prices. The ASI, however, meticulously compares the current session’s price action against the previous session’s extremes.
This approach ensures the indicator reflects the commitment of large-scale traders and institutional flow, rather than just the temporary velocity of a price move. Over time, these values accumulate to form a smooth line that reveals the market’s true underlying trend.
2. How to calculate ASI
The Accumulative Swing Index is the result of a systematic two-step process that converts raw daily volatility into a readable trend line.
Step 1: Calculating the Swing Index (SI)
Before you get the ASI, you must calculate the Swing Index (SI). The SI quantifies the buying or selling strength of a single session. While the math is complex, the logic is based on finding the “real” movement after accounting for daily volatility.
The simplified formula logic involves:
SI = 50 * [Current Price Data / Volatility Variable] * (Limit Move Adjustment)
- The formula incorporates a variable ‘R’ (the largest of three key price differences) to ensure that the “swing” is normalized against recent volatility.
Step 2: Accumulating the Index (ASI)
To turn these erratic daily “votes” into a trend, the SI values are added together.
ASI = Previous Day’s ASI + Today’s Swing Index (SI)
Why the ASI Formula Matters
Most modern traders do not calculate the ASI manually, as charting software handles the math. However, understanding the logic is vital. Because the formula uses the full OHLC range (Open, High, Low, and Close) rather than just the Close, it measures the “effort” expended by the market.
If the price closes higher but had a massive struggle (wide range with a close near the open), the ASI formula will show less conviction than a strong, clean move. This makes the ASI significantly more reliable for identifying valid breakouts than indicators that ignore intra-day volatility.
3. Swing Index (SI) vs. Accumulative Swing Index (ASI)
To use this tool effectively, you must distinguish between the raw data and the final trend line. While most charting platforms plot the ASI by default, understanding its relationship with the Swing Index (SI) is critical for interpreting momentum shifts.
| Feature | Swing Index (SI) | Accumulative Swing Index (ASI) |
| Purpose | Measures pressure for a single session (Raw data) | Measures long-term trend and conviction (Cumulative data) |
| Appearance | Jagged and erratic; fluctuates across zero | Smooth and flowing; follows price structure. |
| Logic | The “daily vote” of buying vs. selling pressure | The “running tally” of market commitment |
| Utility | Used for internal calculations; rarely plotted alone | Primary tool for identifying trends and divergences |
4. How to Trade the Accumulative Swing Index (The Playbook)
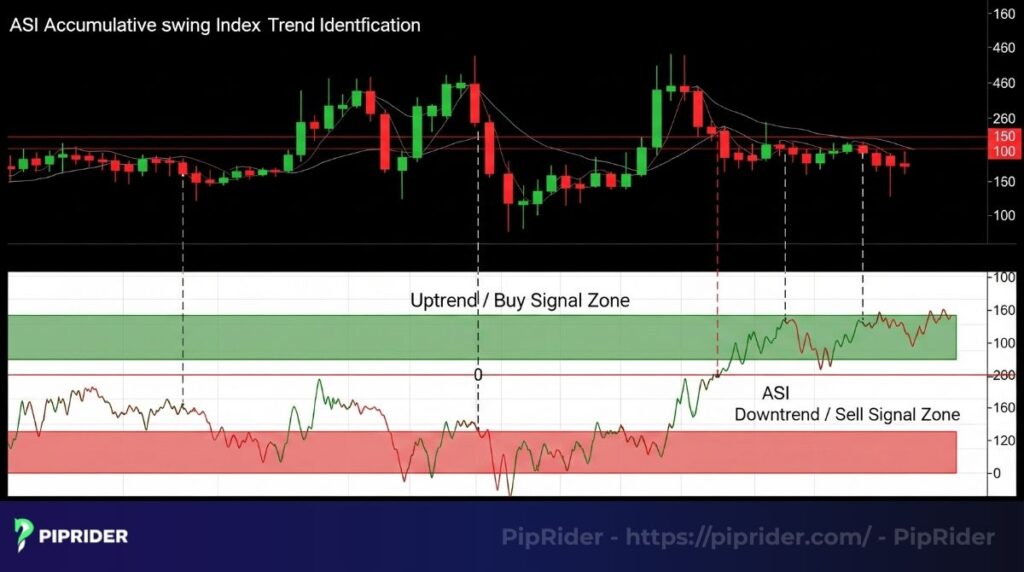
Reading the ASI is straightforward once you understand its positioning relative to the Zero Line:
- Positive values (Above 0): Indicate an environment of bullish conviction.
- Negative values (Below 0): Indicate an environment of bearish conviction.
- Slope: A rising ASI suggests growing commitment to the upside, while a falling ASI suggests sellers are gaining control.
The following strategies form a practical playbook for integrating ASI into your trading workflow.
4.1. Strategy 1: Trend Confirmation
This strategy uses the ASI to validate that a price move has real “weight” behind it, helping traders avoid low-conviction rallies.
- Best for: Trend-following traders in established markets.
- Entry trigger: Price makes a higher high (or lower low) and the ASI confirms by making a corresponding high/low. Enter on a pullback to a moving average or structural support while the ASI slope remains in the direction of the trend.
- Stop-loss/Invalidation: Place stops below the recent swing low. Invalidate the trade if the ASI begins to flatten or move sideways despite price continuing to move, signaling a loss of conviction.
- Avoid when: Market is choppy; the ASI is hovering near the zero line with no clear slope.
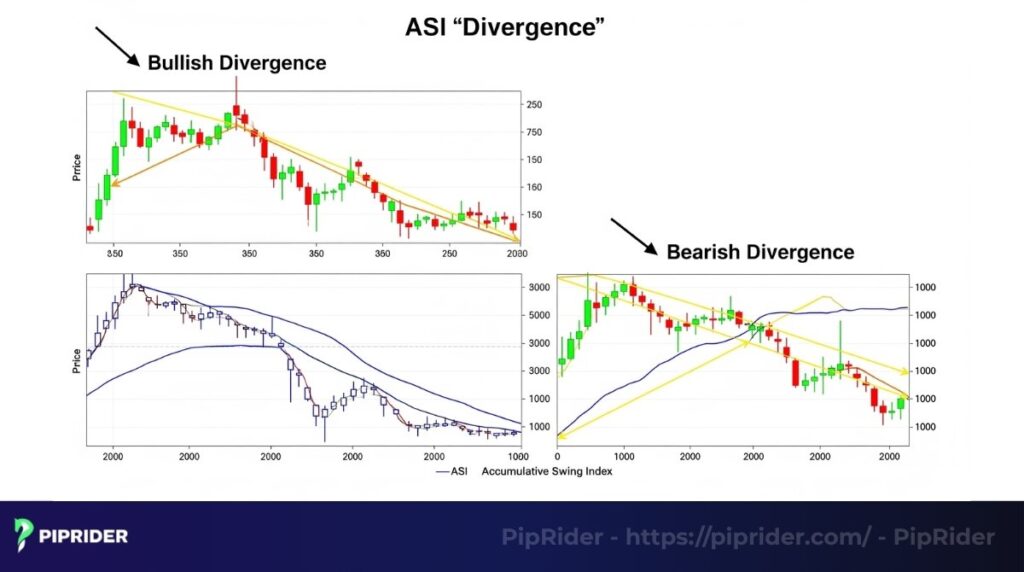
4.2. Strategy 2: Divergence Reversal
Divergence is the market’s “silent warning” that the current trend is exhausted and a reversal is likely.
- Best for: Counter-trend traders or those looking to exit existing positions at the top/bottom.
- Entry trigger (Bullish): Price makes a lower low, but the ASI makes a higher low at a major support level. Wait for a bullish reversal candle (e.g., a hammer or engulfing pattern) before entering.
- Stop-loss/Invalidation: Place stops outside the recent price extreme (the lower low). Invalidate if price breaks support and the ASI fails to sustain its higher low.
- Avoid when: Divergence appears in a very high-velocity trend without any price-action confirmation (candles or structural breaks).
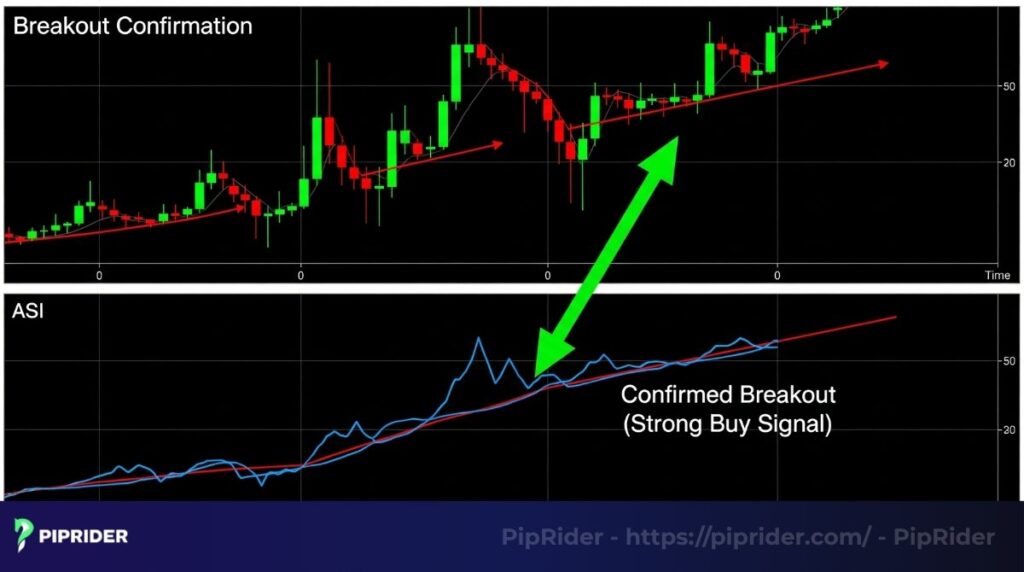
4.3. Strategy 3: Breakout Confirmation
This strategy uses trendlines drawn directly on the ASI indicator to predict or confirm price breakouts.
- Best for: Breakout and momentum traders.
- Entry trigger: Draw a trendline on the price chart and a corresponding trendline on the ASI. Enter when both price and the ASI break their respective trendlines simultaneously.
- Stop-loss/Invalidation: Place stops below the breakout candle or the retest of the broken level. Invalidate if the price breakout occurs but the ASI remains trapped below its trendline.
- Avoid when: Breakout volume is thin or the ASI trendline break occurs significantly later than the price break (lagging).
5. ASI vs. RSI vs. MACD: Which One to Choose?
Many traders confuse the ASI with momentum oscillators like the RSI or trend-following tools like the MACD. While they may look similar on a chart, they measure fundamentally different things.
| Indicator | Best For | Strength | Weakness | Market Condition |
|---|---|---|---|---|
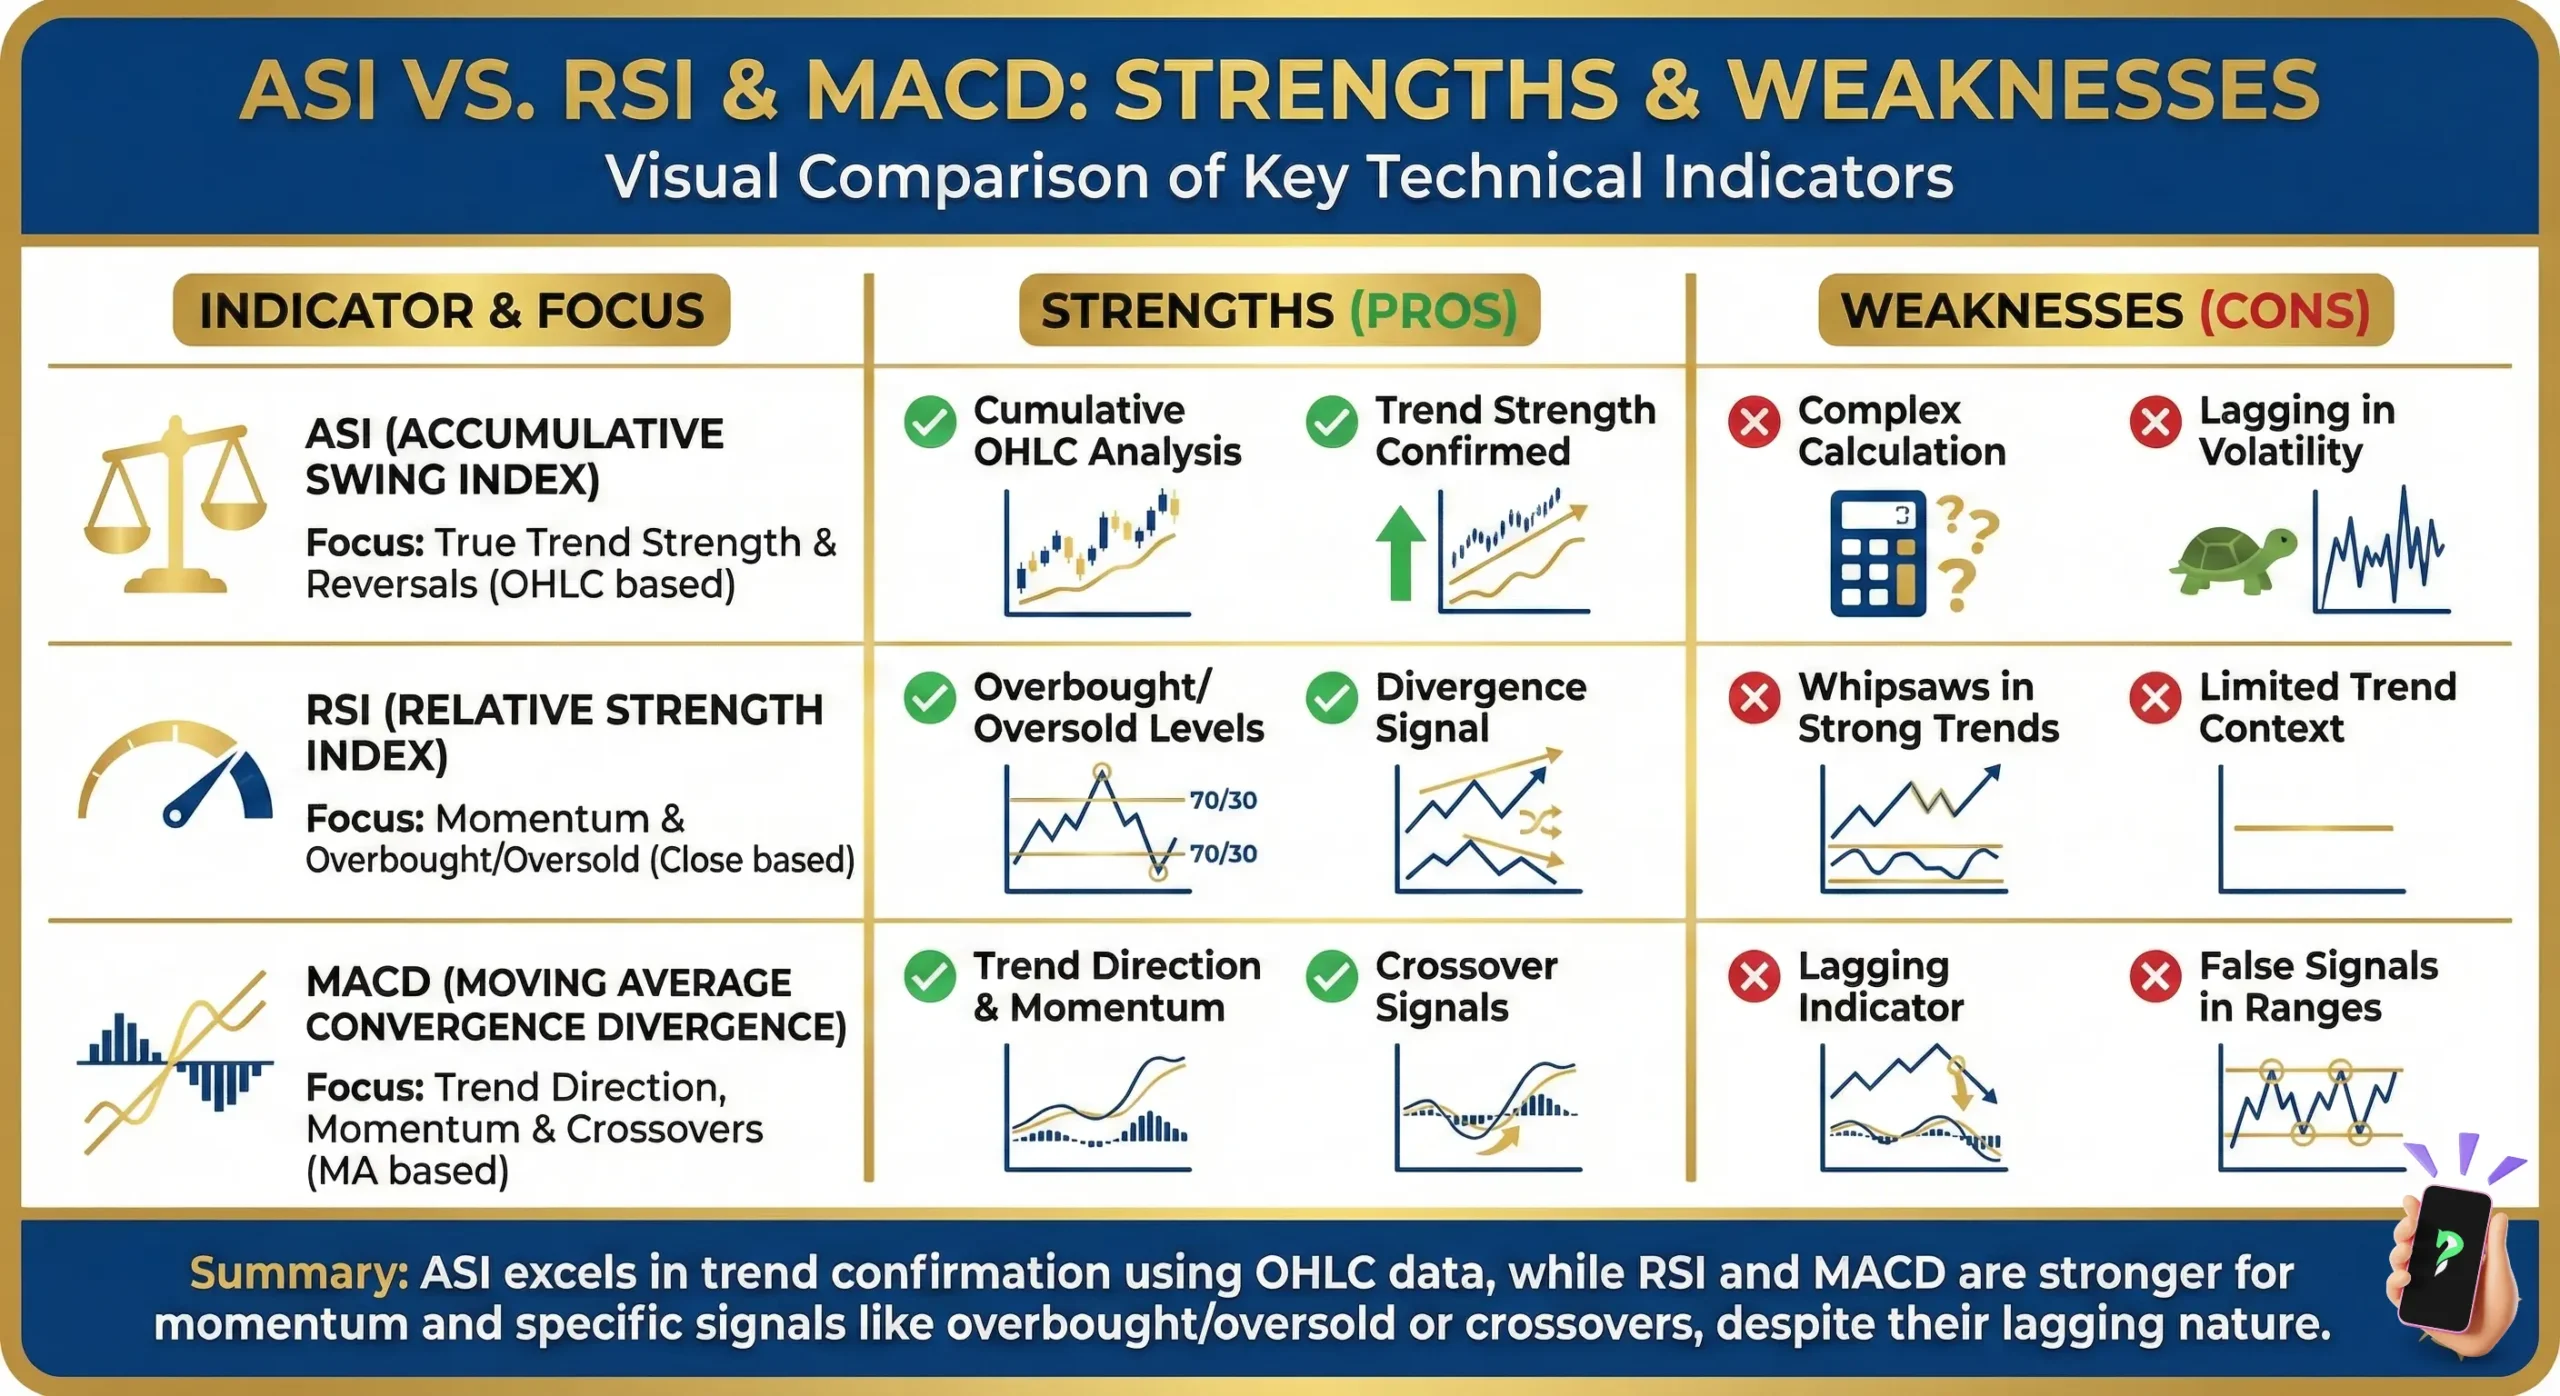
| ASI | Trend validation & conviction | Uses full OHLC; reveals “real” effort | Can be lagging; weak in ranges | Trending markets |
| RSI | Exhaustion & speed | Fast; identifies extreme levels | Can stay extreme in strong trends | Ranging to moderate trends |
| MACD | Momentum shifts | Excellent for trend transitions | Slower entries; prone to whipsaws | Sustained trends |
Practical scenarios:
- Use RSI when you want to know if a move is “overextended” or moving too fast to be sustainable
- Use MACD when you want to identify the exact moment momentum shifts from bearish to bullish
- Use ASI when you need to know if a breakout or trend has the institutional commitment required to continue
6. When the ASI Works Best (And When It Fails)
To get the most out of the Accumulative Swing Index, you must apply it in the right environment. It is a precision tool, not an all-weather system.
ASI Works Best When:
- The market is trending: It excels at distinguishing between a minor pullback and a major trend reversal.
- Validating breakouts: It acts as a filter to keep you out of “bull traps” or “bear traps” where price moves without commitment.
- Trading higher timeframes: It is most reliable on the H4 and Daily charts, where the OHLC data represents significant market participation.
- Near major structural levels: Divergence at key support or resistance is often more accurate than divergence in the middle of a range.
Avoid Using ASI When:
- The market is choppy: In sideways or range-bound markets, the ASI line will hover around zero, producing frequent and unreliable crossover signals.
- Scalping: Due to its cumulative nature, it is often too slow for high-frequency trading or 1-minute charts.
- Trading without context: Using an ASI crossover as a standalone entry signal without looking at price structure or volume usually leads to poor results.
7. Real Trading Case Studies
7.1. Case Study 1: Bullish ASI Divergence (Reversal)
- Context: An asset has been in a sustained downtrend for several weeks, approaching a major psychological support level
- Signal: Price prints a new lower low, but the ASI makes a clear higher low (Bullish Divergence)
- Confirmation: A bullish engulfing candle closes on the Daily chart
- Entry: At the close of the confirmation candle
- Stop-loss: Below the recent price swing low
- Target: The nearest previous swing high or a key moving average (e.g., 50 EMA)
- Outcome: The divergence accurately predicted that the selling “effort” was exhausted despite the price dip
7.2. Case Study 2: Bearish Breakout Confirmation
- Context: Price is consolidating in a tight range or “flag” pattern after a rally
- Signal: Price breaks below the lower trendline of the flag. Simultaneously, the ASI breaks its own corresponding trendline
- Confirmation: Both price and ASI break lower in the same session
- Entry: On the breakout candle close
- Stop-loss: Above the high of the breakout candle
- Target: The next major support level or a 1:2 risk-to-reward ratio
- Outcome: The simultaneous break in ASI confirmed that the move had genuine selling conviction, filtering out a potential “fakeout”
8. Should Beginners Use the ASI Indicator?
The short answer is yes, but with a specific focus. Beginners are often intimidated by the complexity of the ASI formula. However, you do not need to be a mathematician to use the tool.
For a beginner, the ASI is most valuable for learning market structure. By watching how the ASI line moves compared to price, you will begin to see that not all green candles are equal. If you are just starting out:
- Ignore the math and focus on the slope of the line
- Use it only on Daily charts to avoid the confusion of intraday noise
- Always pair it with a simpler indicator, like a Moving Average, to keep your bias objective
9. Frequently asked questions about accumulative swing index
10. Conclusion: Integrating ASI into Your Trading Workflow
The Accumulative Swing Index is an exceptional tool for traders who want to look beneath the surface of price action. By revealing the commitment behind price swings, it allows you to trade with greater confidence and avoid the traps set by low-conviction market moves.
Remember, the ASI is a confirmation tool, not a standalone system. For the best results, integrate it into a broader strategy that includes price action, support/resistance levels, and risk management.
Ready to deepen your technical analysis? Explore the full range of structured lessons and in-depth guides in Piprider. We encourage you to share your thoughts, questions, and experiences with the ASI indicator by leaving a comment below.
Infographic Section
-
Accumulative Swing Index -
ASI Vs. RSI Vs. MACD


