

When I first started trading forex, I struggled to spot the right moment to enter or exit a trade. Then I discovered the power of the best forex volume indicators, and it was like flipping on a light in a dark room. These tools show you how much trading activity is happening, helping you confirm trends, spot reversals, and avoid fake signals.
In this guide, we’ll explore what makes volume indicators so valuable for forex traders. You’ll learn about the top five indicators, how to use them in your strategies, and tips to trade smarter. Whether you’re scalping or swing trading, these insights will help you make better decisions. Ready to dive in? Let’s unlock the potential of volume analysis together!
Key Takeaways
- Gain insight into volume indicators: These tools assess the intensity of trading activity in the forex market, helping traders evaluate momentum, liquidity, and the strength of price movements useful for confirming trends or identifying potential reversals.
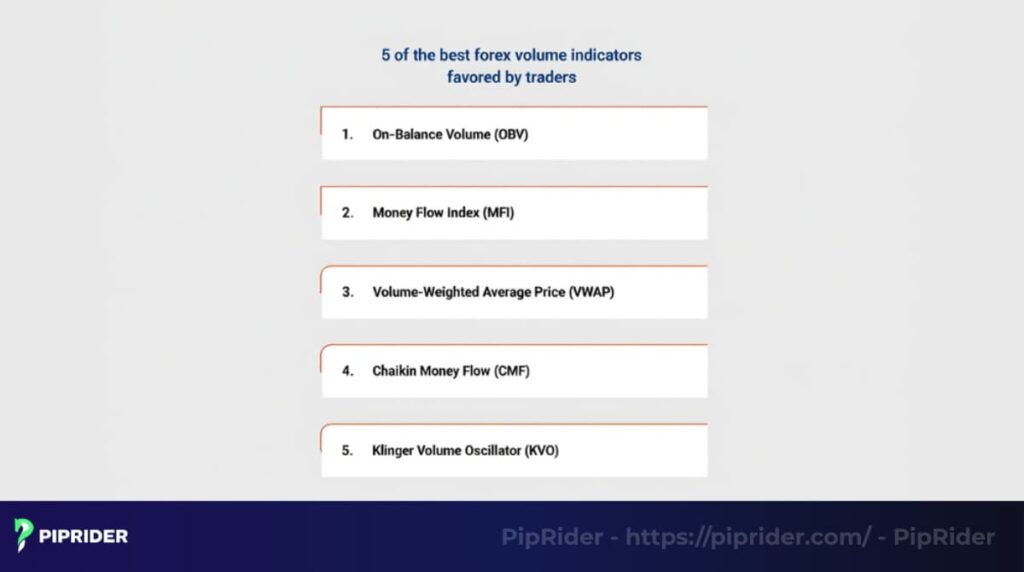
- Top five indicators: On-Balance Volume (OBV), Money Flow Index (MFI), Volume-Weighted Average Price (VWAP), Chaikin Money Flow (CMF), and Klinger Volume Oscillator (KVO) are popular choices, each suited to specific trading styles like trend, reversal, or breakout trading.
- Strategic application: Use OBV for trend confirmation, MFI for reversals, VWAP for intraday scalping, CMF for breakouts, and KVO for momentum shifts, with optimal timeframes ranging from 1-minute to H1+ charts.
- Pros and cons: Volume indicators enhance trade timing and trend validation but rely on broker-specific data and may lag in low-volatility markets, requiring confirmation from tools like RSI or price action.
- Practical tips: Test indicators on demo accounts, use multiple timeframes, combine with other tools, and monitor economic events to maximize effectiveness and minimize false signals.
1. What is a volume indicator in forex?
In forex trading, volume indicators usually track market activity using what’s known as “tick volume.” Because forex is a decentralized (OTC) market with no central exchange, it’s impossible to measure the total actual lots traded across the entire market.
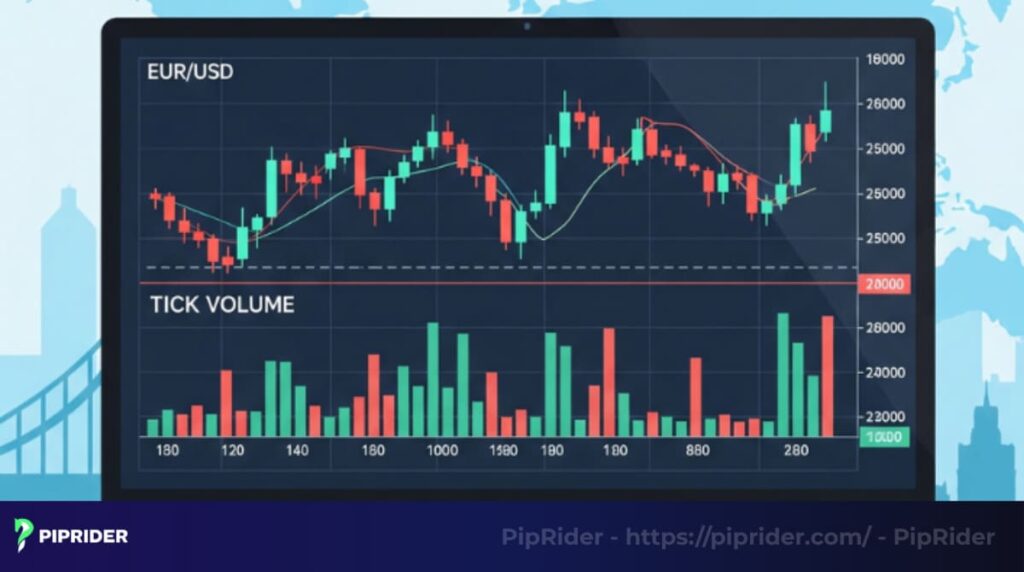
Tick volume reflects how frequently the price moves during a given time frame. High activity (many price changes) often correlates with high actual trading volume, reflecting buying and selling pressure.
Understanding what is a volume indicator in forex in this context is a game-changer for traders. It helps you estimate the market’s activity level, giving clues about momentum and potential price moves.
- Why it’s important: Tick volume provides insights into market liquidity and the intensity of trading activity. High tick volume often indicates significant market interest. I’ve noticed that combining tick volume with price action helps me spot the best forex volume indicators for reliable signals.
- Application: Traders analyze volume to support trend confirmation, identify possible reversals, or verify breakout strength. For instance, a sharp price increase accompanied by low volume may indicate a lack of conviction behind the move. Understanding this can save you from bad trades.
2. Why volume indicators are essential for forex trading
Volume indicators serve as a guide, helping traders steer through the complexities of the forex market. They give you a clearer picture of what’s driving price movements, helping you make smarter trades. Let’s explore why the best volume indicators for forex are crucial for success.
- Validating trends: Volume reveals whether a price movement is backed by strong market participation. A price rise with increasing volume suggests a solid trend, while low volume might mean it’s about to fizzle out. I’ve found this helps me avoid jumping into weak moves.
- Spotting reversals: When price and volume don’t align, it’s a warning. For instance, when prices reach new highs but trading volume declines, it may signal an upcoming reversal. This insight has saved me from costly mistakes.
- Validating breakouts: A breakout with high volume is more likely to last. Low volume on a breakout often signals a fakeout, which can trap traders. Relying on top forex volume indicators can reinforce the validity of such market movements.
- Enhancing timing: Volume provides clues for better entry and exit points. Significant volume near critical areas such as support or resistance often indicates a powerful price move ahead.
| Scenario | Volume signal | What it means |
| Rising price, high volume | Strong trend | Safe to enter |
| Rising price, low volume | Weak trend | Risk of reversal |
| Breakout with high volume | Sustainable move | Likely to continue |
3. 5 of the best forex volume indicators favored by traders
Choosing the best forex volume indicators can transform your trading by revealing market strength and timing. This section dives into five powerful tools that help confirm trends, spot reversals, and nail breakout trades.
Let’s break down each one to see how they can boost your strategy.
3.1. On-Balance Volume (OBV)
OBV is a popular tool among traders because it measures buying and selling momentum by adding volume on days when prices rise and subtracting volume on days when prices fall. This method provides a clear insight into the strength of market trends.
- How it works: When a candle closes above the previous one, its volume is added to the OBV total. Conversely, if it closes below, the volume is deducted. This calculation simplifies the Wyckoff Methodology by visually confirming if the “smart money” is accumulating or distributing positions.
- Best use cases: Ideal applications include confirming trend direction, detecting divergences, and validating breakout moves. For instance, if prices increase while OBV declines, it could signal an impending reversal.
- Timeframes: OBV is especially effective on hourly (H1) or longer timeframes, making it well-suited for swing trading. Combining OBV with key support and resistance levels can help pinpoint more accurate entry points.
3.2. Money Flow Index (MFI)
The MFI indicator merges price movements with trading volume to help detect when an asset might be overvalued or undervalued. It’s like a guide for catching reversals before they happen. Traders love it for its clear signals.
- How it works: MFI ranges from 0 to 100. Values exceeding 80 generally indicate an overbought market, whereas readings below 20 imply oversold conditions. When the indicator moves out of these areas accompanied by strong volume, it may indicate a possible reversal.
- Best use cases: Reversal trading and scalping on 5-minute charts. I’ve found MFI helps me avoid jumping into trades during choppy markets.
- Timeframes: Best on 5-minute to H1 charts for quick trades. Combine it with candlestick formations to enhance signal reliability.
3.3. Volume-Weighted Average Price (VWAP)
VWAP is popular among day traders as it provides a volume-adjusted reference point for determining fair price levels. On retail forex platforms, VWAP uses tick volume for its calculation, acting like a map for finding the best entry and exit points. This makes it a top pick for the best volume indicator for forex trading, especially for intraday strategies.
- How it works: VWAP computes the volume-weighted average price. When prices rise above the VWAP, it indicates buying momentum; when they fall below, it reflects selling pressure. It serves as a flexible support or resistance level.
- Best use cases: Scalping and intraday trading. Enter long when prices cross above VWAP with strong volume, or short when they dip below.
- Timeframes: Ideal for 1–15 minute charts. I’ve used VWAP to time entries during volatile sessions with great results.
3.4. Chaikin Money Flow (CMF)
CMF measures buying and selling pressure by combining price and tick volume, displayed on a scale from -1 to +1. It’s a reliable tool for confirming the strength behind breakouts and shifts in market sentiment. Many traders consider it a standout among the best volume indicators for forex due to its intuitive nature.
- How it works: CMF values above +0.05 show buying pressure, below -0.05 indicate selling pressure. A zero-line crossover signals a potential trade opportunity.
- Best use cases: Scalping and breakout trading on 1–3 minute charts. I’ve seen CMF confirm breakouts when paired with key price levels.
- Timeframes: Best for short-term trades. Use with other indicators like RSI for better accuracy.
3.5. Klinger Volume Oscillator (KVO)
KVO is a unique tool that compares short- and long-term volume trends to spot momentum shifts. It’s perfect for scalpers looking to catch early reversals. This is why it’s often considered one of the top volume indicators in the forex market.
- How it works: KVO uses two moving averages of volume. When the short-term MA crosses above the long-term MA, it’s bullish; below, it’s bearish. Divergences signal potential reversals.
- Best use cases: Quick trades and momentum strategies using 1 to 5-minute timeframes. I’ve found KVO’s sensitivity helps catch quick market shifts.
- Timeframes: Works best on short timeframes. Pair with price action for stronger signals.
4. Applying volume indicators within forex trading strategies
Knowing how to apply the best forex volume indicators can make or break your trading. These tools shine when woven into clear strategies, helping you time trades and avoid traps. Here’s how to use them effectively for trend, reversal, and breakout trading.
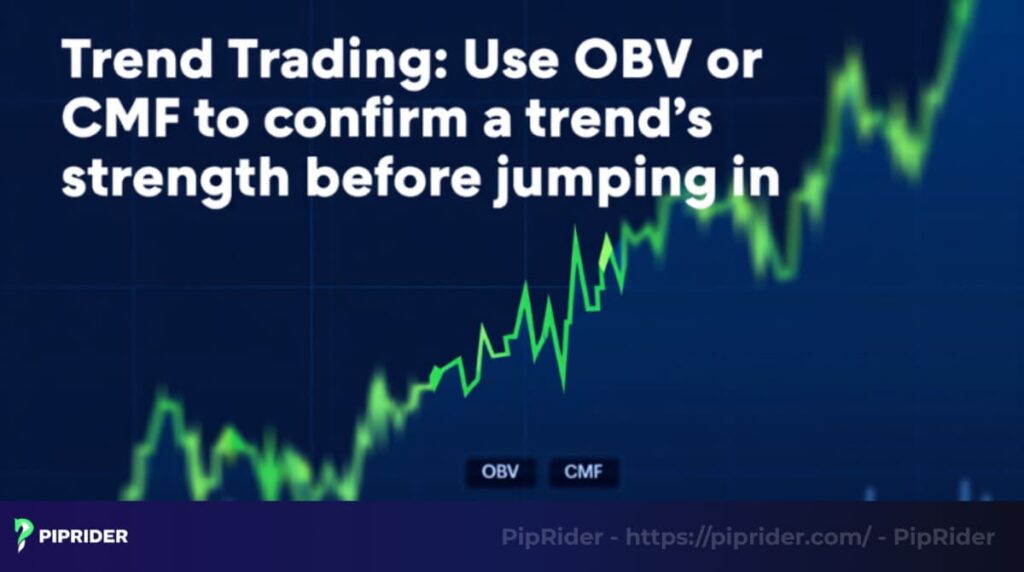
- Trend trading: Use OBV or CMF to confirm a trend’s strength before jumping in. For example, enter a long trade when prices rise and OBV climbs steadily. This ensures the trend has real momentum behind it.
- Reversal trading: Indicators like MFI and KVO are effective at identifying potential trend reversals. For example, if the MFI falls below 80 accompanied by strong volume, it could indicate an upcoming sell-off. I’ve found pairing these with candlestick patterns like doji boosts accuracy.
- Breakout trading: VWAP and CMF excel at validating breakouts. A price breaking above resistance with high CMF confirms a strong move. I’ve used this to catch big moves during news events.
- Practical tips:
- Combine indicators for stronger signals, like OBV with VWAP.
- For trend analysis, focus on timeframes of one hour or higher; use 1 to 5-minute charts for scalping.
- Place stop-loss orders 1 to 2 pips beyond critical levels to manage risk effectively.
| Strategy | Best volume indicator for forex trading | Key signal |
| Trend trading | OBV, CMF | Rising volume with price |
| Reversal trading | MFI, KVO | Divergence with price |
| Breakout trading | VWAP, CMF | High volume on breakout |
5. Advantages and disadvantages of utilizing volume indicators in forex trading
The best forex volume indicators can elevate your trading, but they’re not perfect. Understanding their strengths and weaknesses helps you use them wisely. Let’s explore the benefits and drawbacks to help shape your trading approach.
- Pros:
- Confirm trends accurately: A price movement supported by high volume indicates a robust trend.
- Spot reversals early: Divergences, like a falling OBV with rising prices, warn of potential turnarounds.
- Enhance trade timing: Tools like VWAP help pinpoint entry and exit points, especially for scalping.
- Cons:
- Data is tick volume, not real volume: As explained, volume on retail forex platforms is ‘tick volume’ (the number of price changes), not the total lots traded. This data comes from your broker and represents only a fraction of market activity, not the whole picture.
- Can be lagging: Volume indicators reflect what has already happened, so they can be lagging, especially in low-volatility markets.
- Needs confirmation: Using any single best volume indicator in forex alone risks false signals; always pair it with other tools like price action or RSI for confirmation.
I’ve noticed that combining volume indicators with price action cuts down on bad trades, but you still need to double-check signals.
6. Tips for maximizing volume indicator effectiveness
To get the most out of the best forex volume indicators, you need a smart approach. These tips will help you use them effectively and avoid common pitfalls.
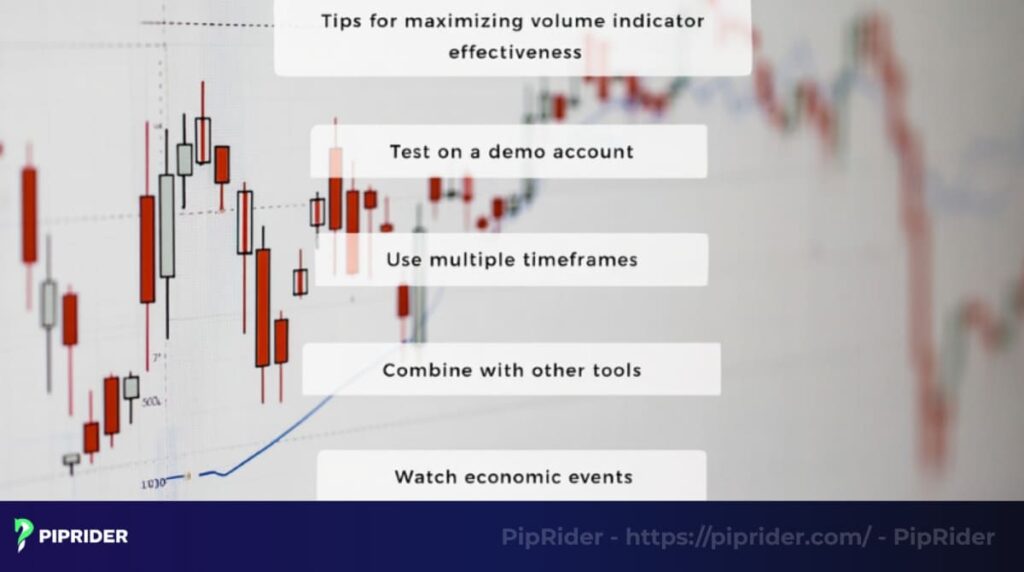
Here’s how to sharpen your trading game.
- Test on a demo account: Practice with indicators like OBV or VWAP in a risk-free demo environment first. This builds confidence before you trade with real money. I’ve found this step saves me from costly mistakes.
- Use multiple timeframes: Check volume signals on both short (1–5 minute) and longer (H1+) charts to filter out noise. For example, scalping works better on short timeframes, while trends need H1 or higher.
- Combine with other tools: Pair volume indicators with RSI, MACD, TSI (True Strength Index) or candlestick patterns for stronger signals. This reduces the chance of acting on false moves.
- Watch economic events: High-impact news like non-farm payrolls can spike volume, affecting indicators. Check an economic calendar to stay prepared.
7. Frequently asked questions about forex volume indicators
Got questions about the best forex volume indicators? This section answers common queries to help you understand and use these tools effectively. Let’s clear up the confusion with straightforward answers.
8. Conclusion
The best forex volume indicators, like OBV, MFI, VWAP, CMF, and KVO, are powerful tools for smarter trading. They help you confirm trends, spot reversals, and time entries with confidence. I’ve found that pairing these indicators with disciplined risk management makes a huge difference in avoiding bad trades.
At Pip Rider, our blog offers practical guides like this to help you navigate forex trading. Check out our “best technical indicators” category for more tools or the “For Beginner” section if you’re just starting out.
Infographic Section
-
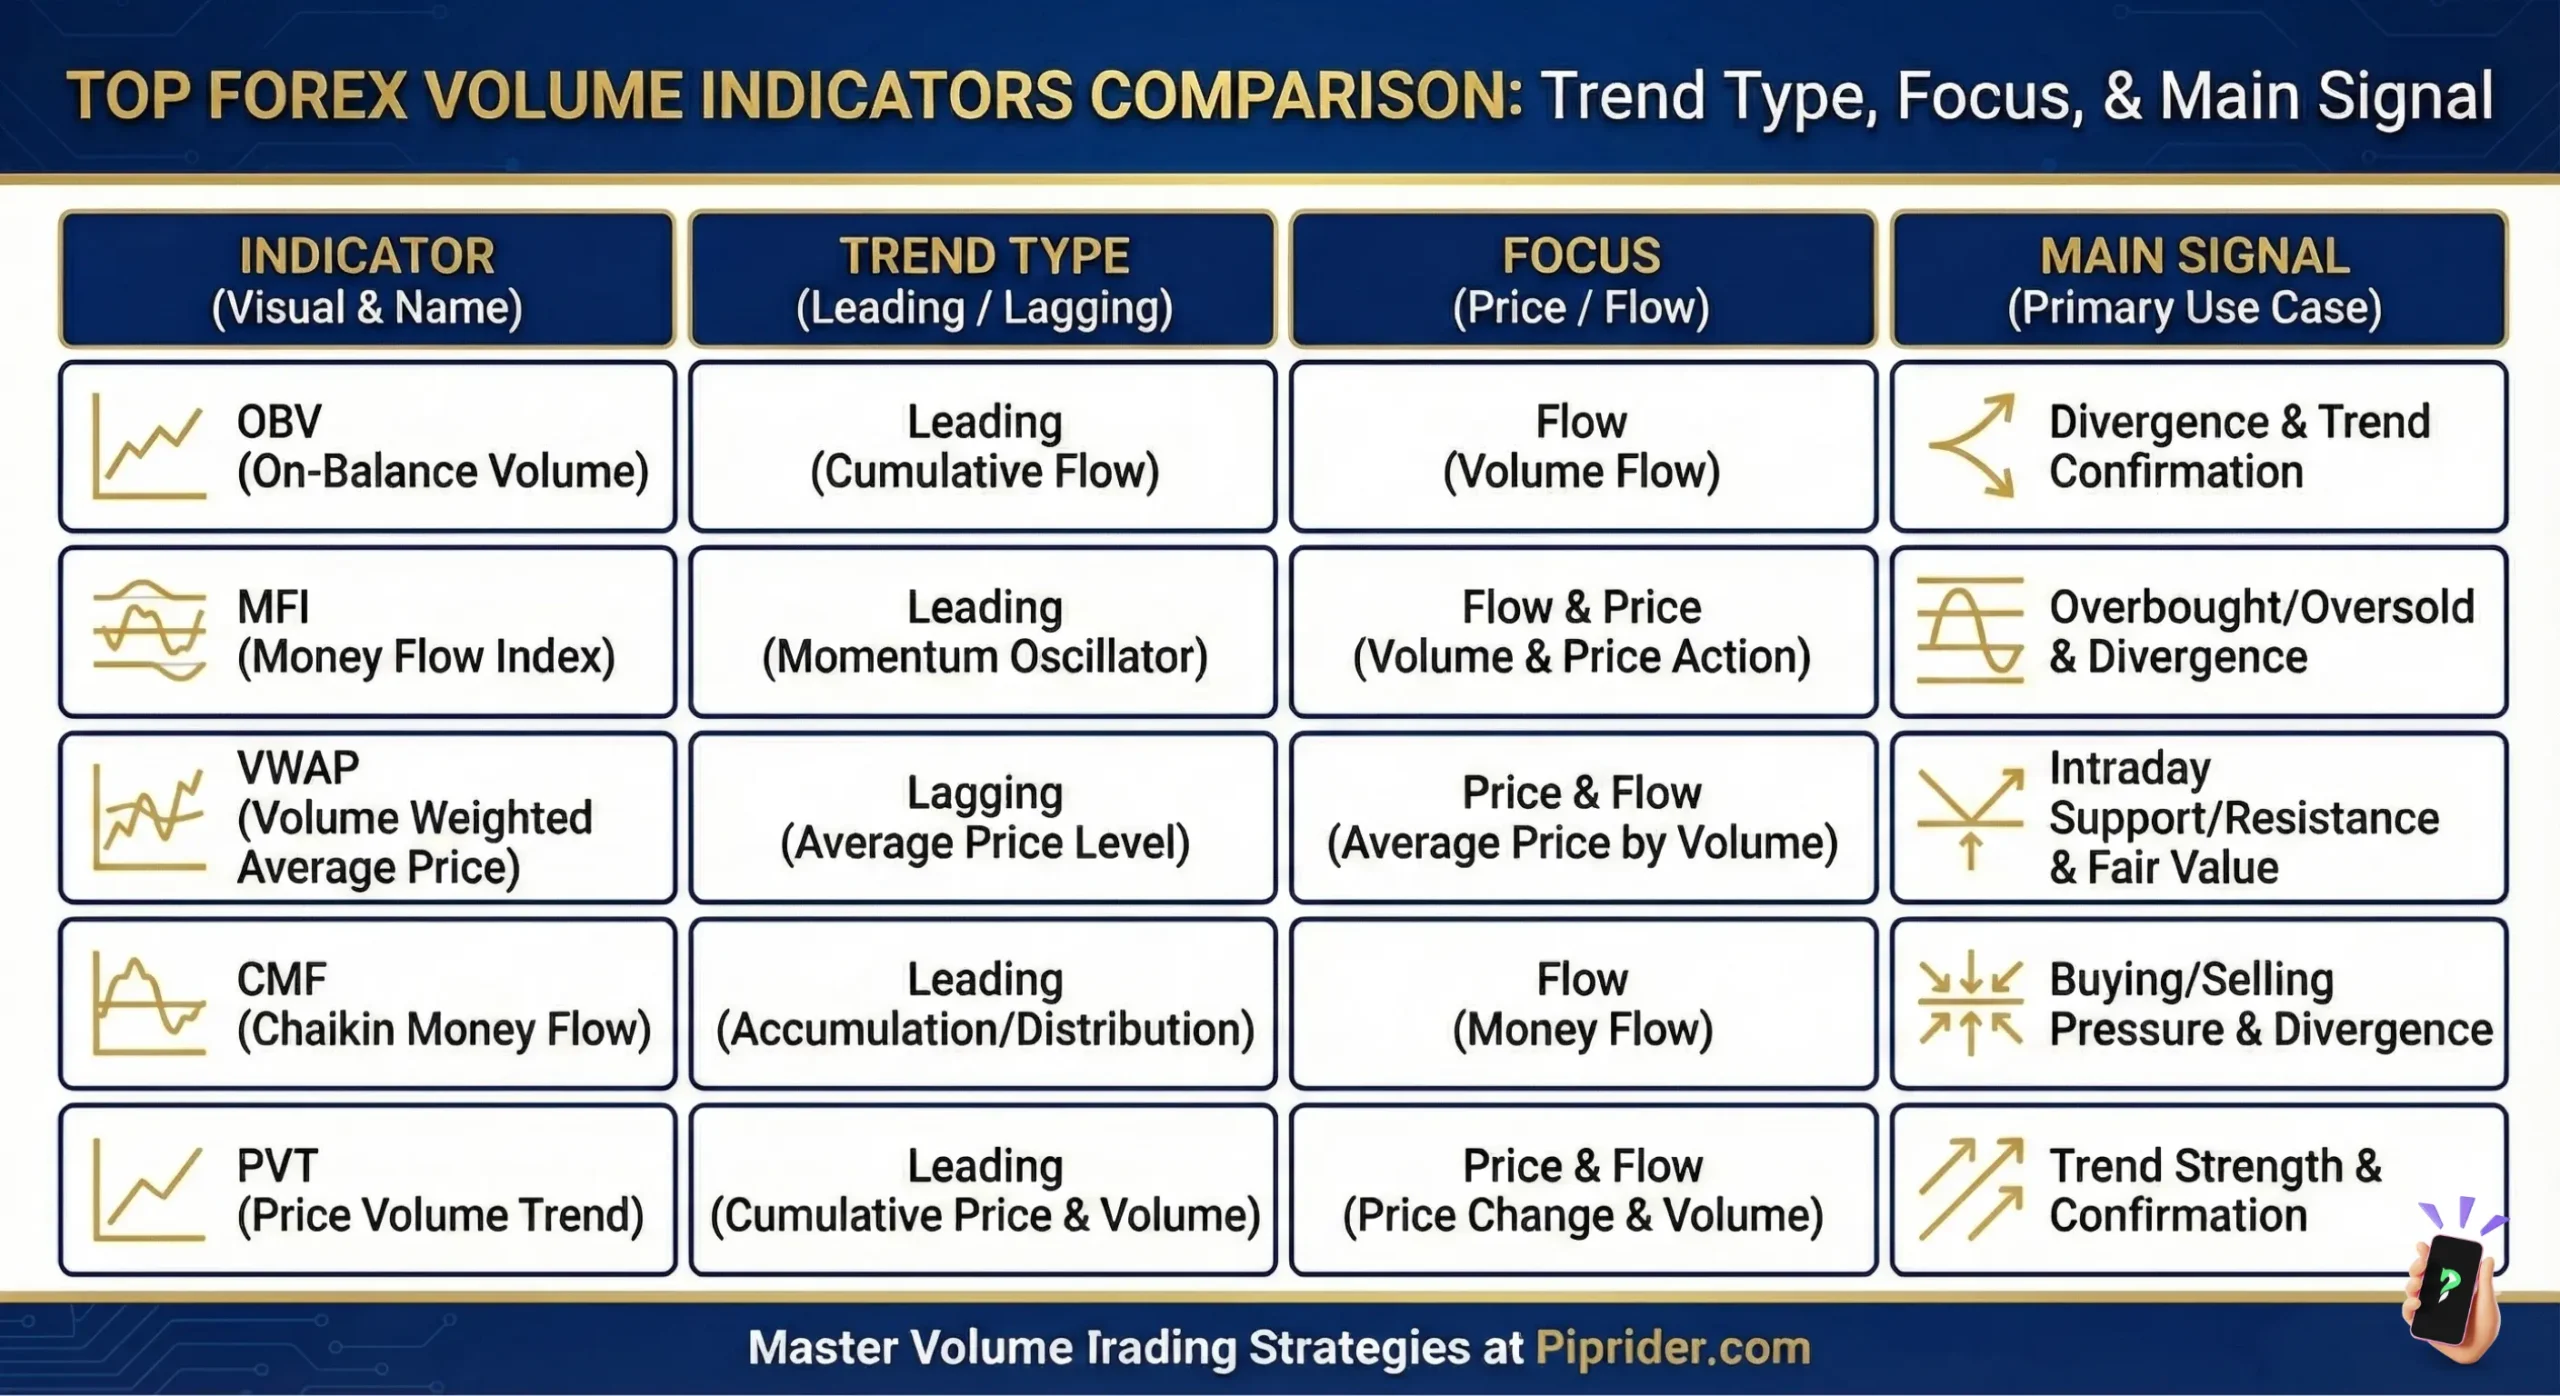
Top Forex Volume Indicators Comparison -
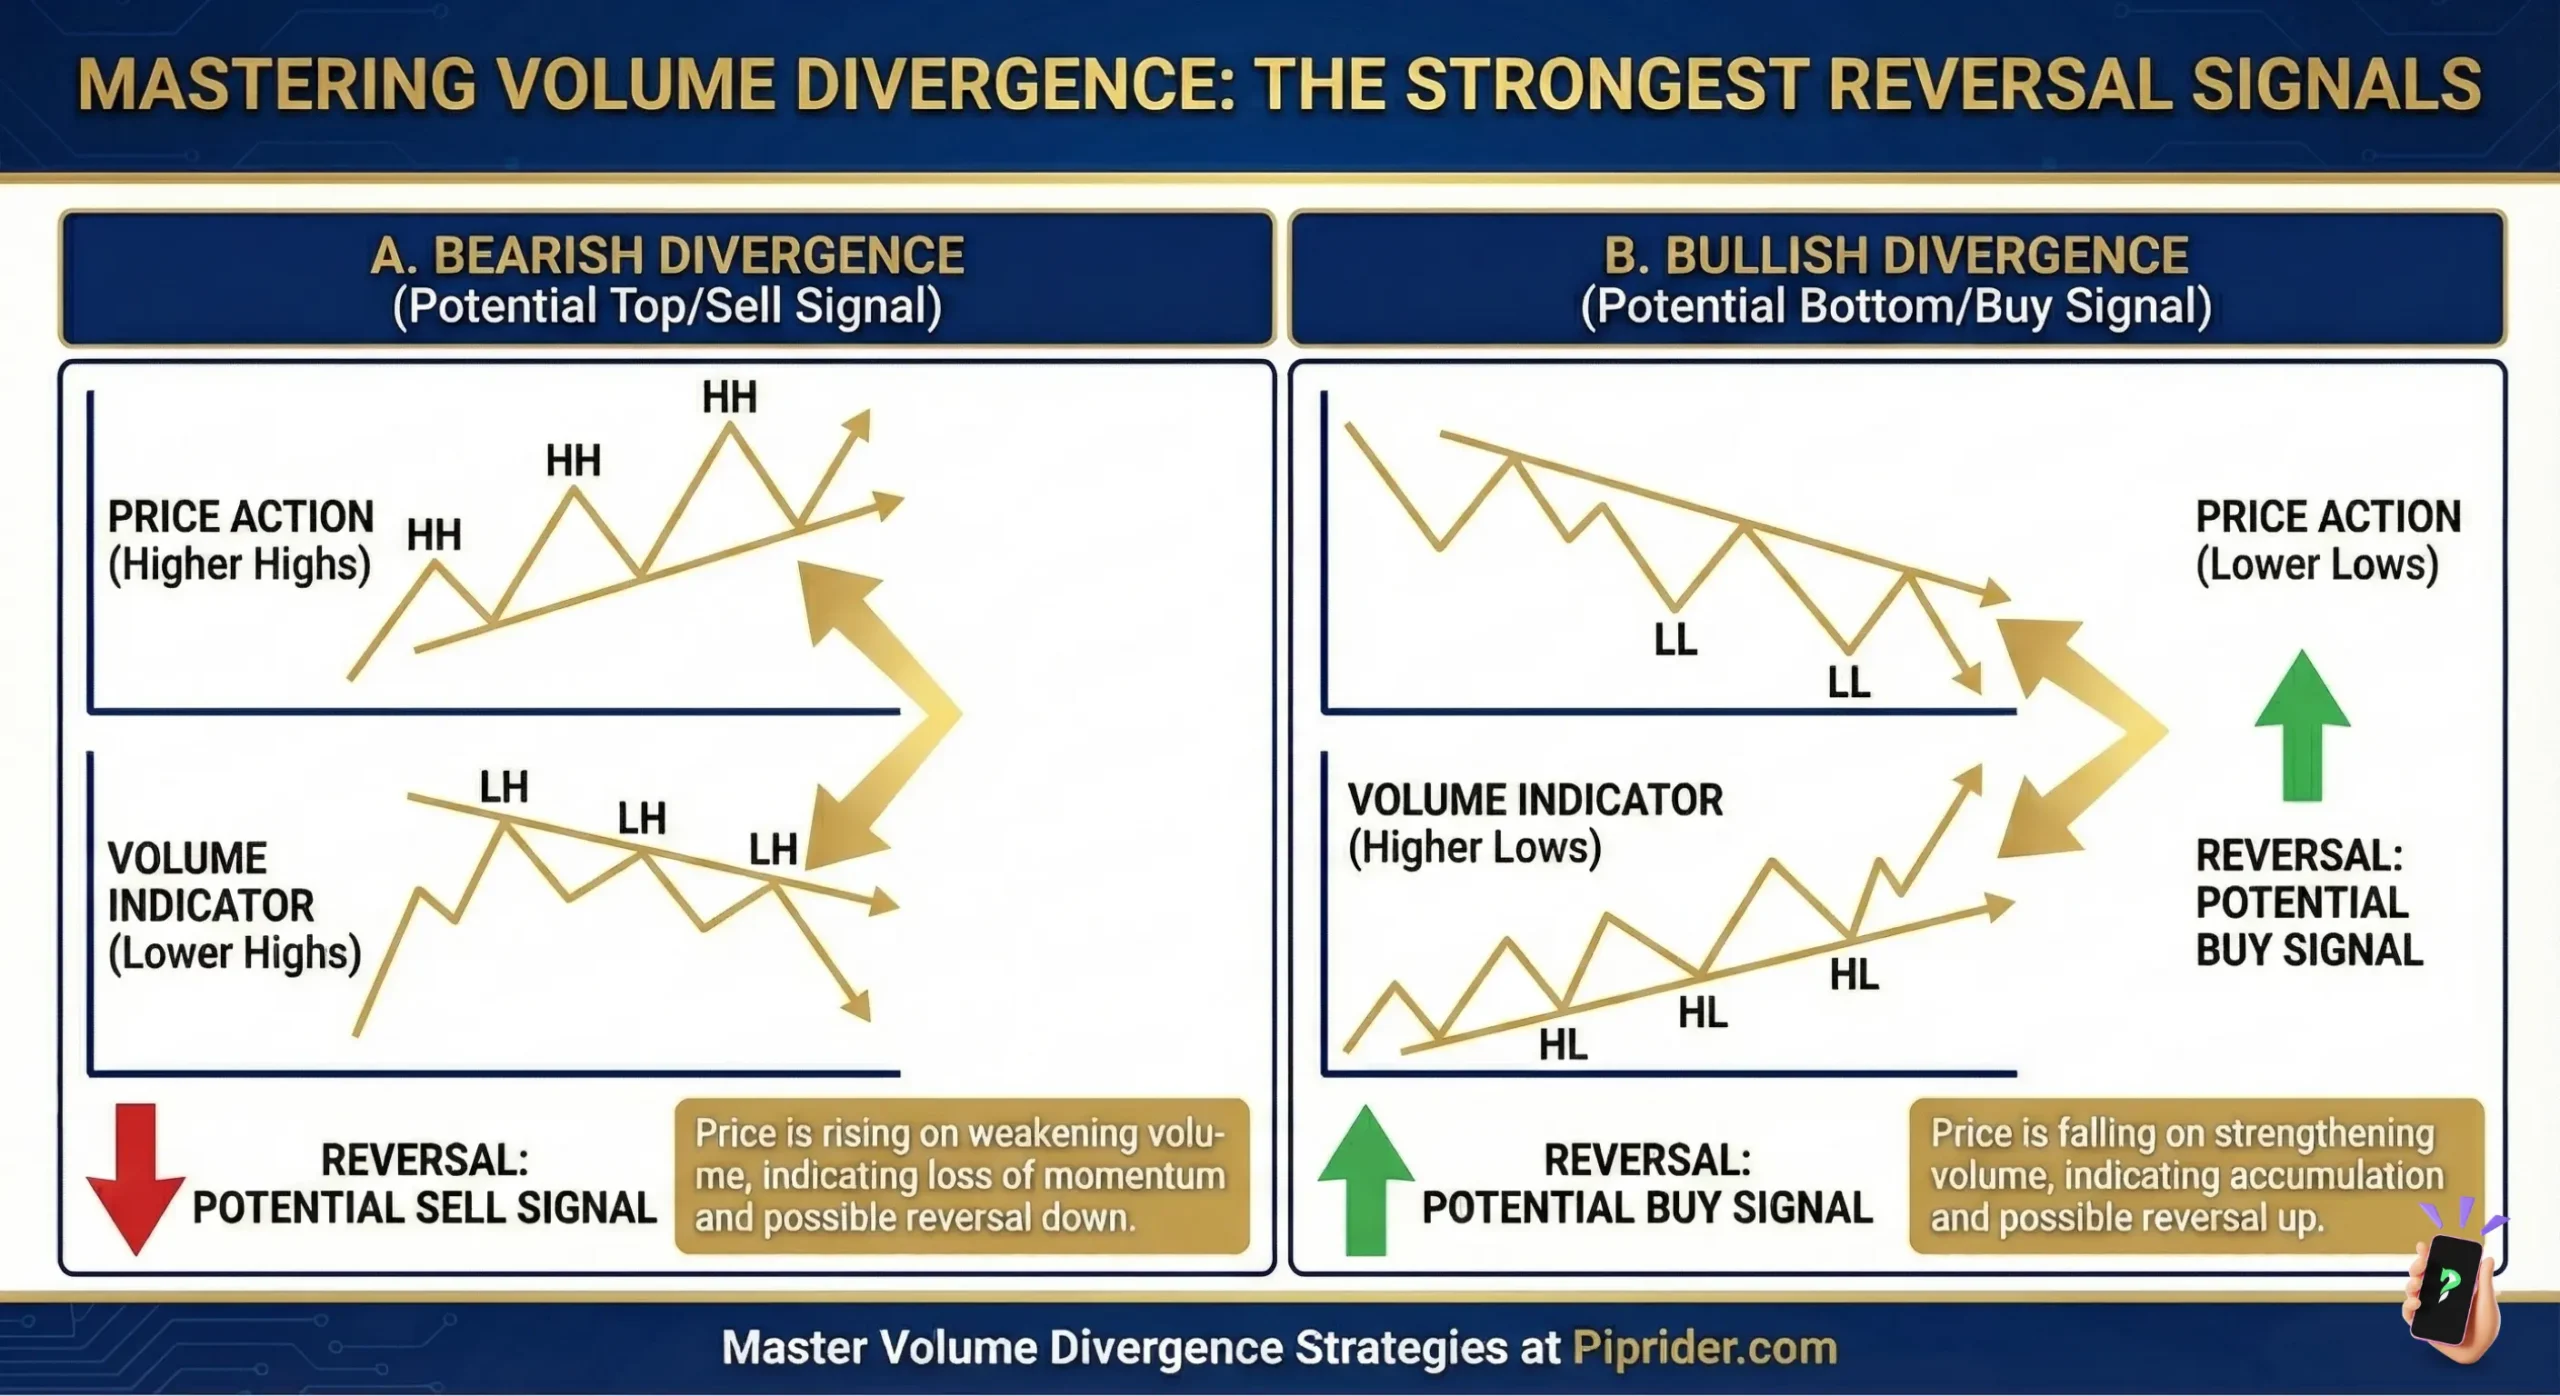
Volume Divergence -
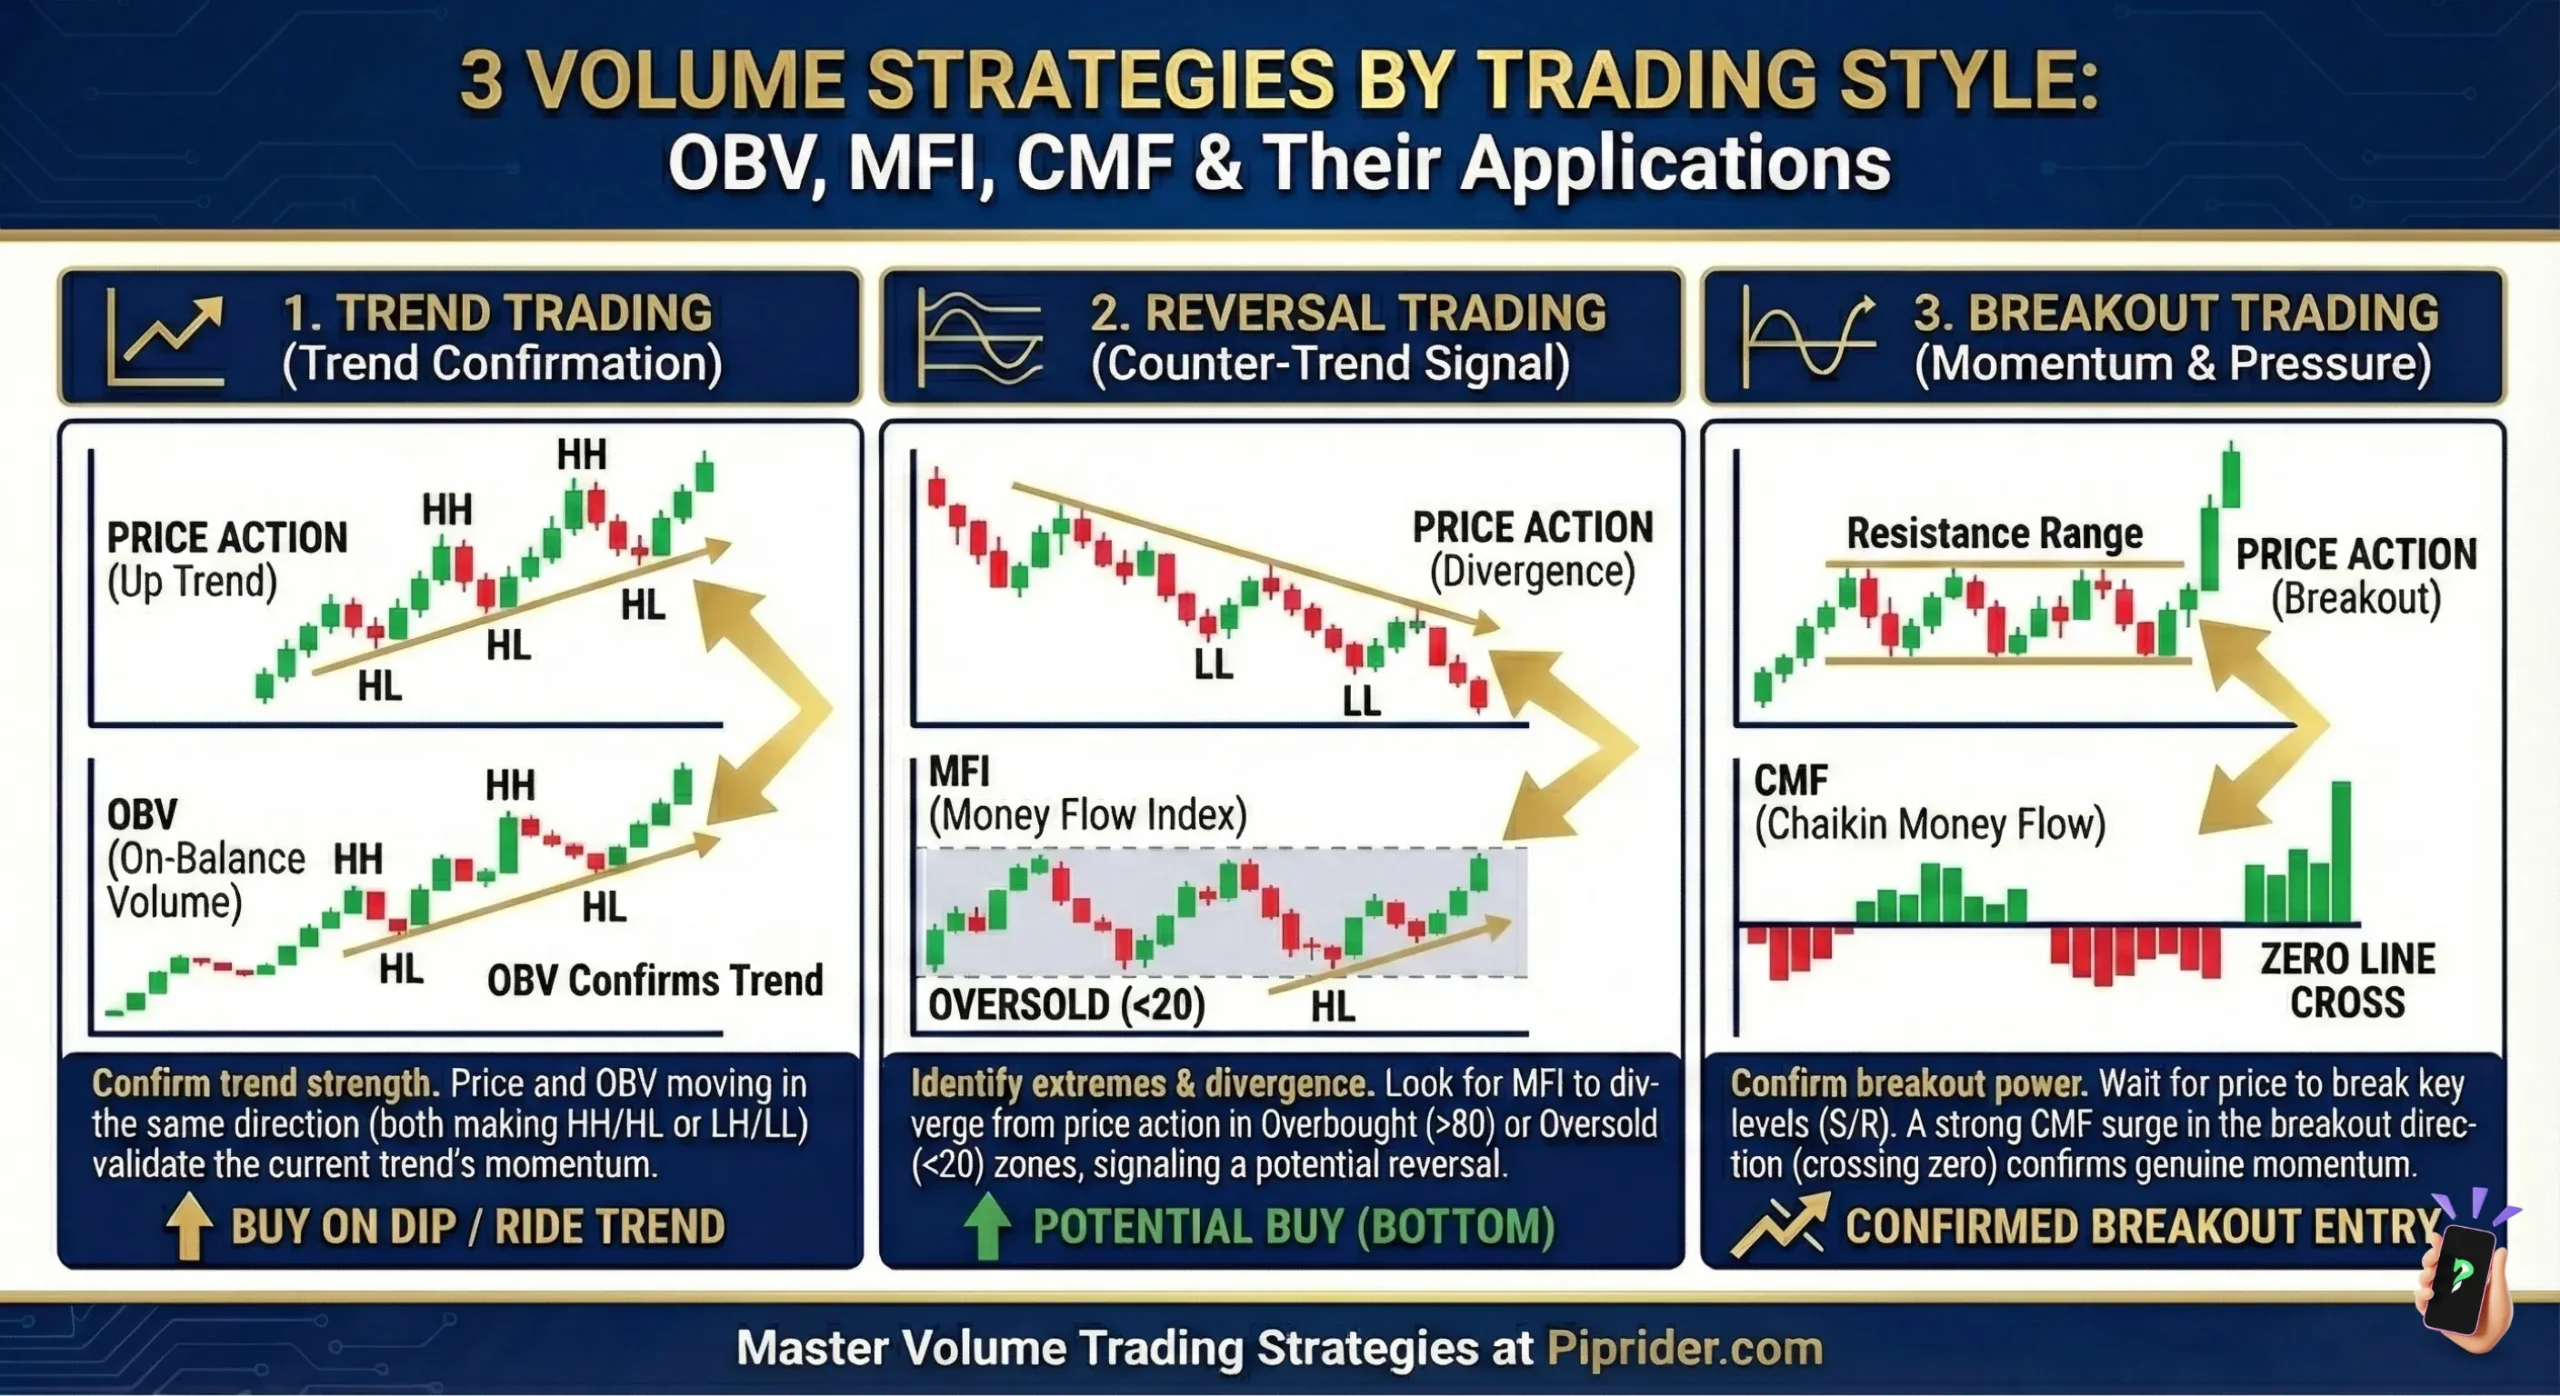
3 Volume Strategies by Trading Style


