
If you’re diving into forex trading, you’ve likely heard of Bollinger Bands – a tool that helps traders make sense of price movements. I still remember the first time I applied this indicator to a chart; it was like turning on a light in a dark room.
Suddenly, the chaotic price swings I used to see started to look more orderly, allowing me to spot potential opportunities I had completely missed before. Whether you’re a newbie or sharpening your skills, this guide will walk you through using Bollinger Bands effectively.
In this article, we’ll cover how to use Bollinger Bands to spot trends, time your trades, and even calculate them yourself. You’ll also learn specific strategies for day trading and tips to avoid common mistakes. By the end, you’ll have practical steps to apply this tool confidently. Ready to level up your trading? Grab your free Bollinger Bands quick guide and start learning now!
Key Takeaways
- Understanding Bollinger Bands: Created by John Bollinger, this technical tool features a 20-day simple moving average (SMA) flanked by two outer bands placed two standard deviations above and below. These bands expand and contract with market volatility, helping traders spot potential overbought or oversold signals.
- Trading strategies: Key strategies include the Bollinger Bounce for range-bound markets, Bollinger Squeeze for breakout opportunities, and trend confirmation for sustained price movements, all enhanced by combining with indicators like RSI or MACD.
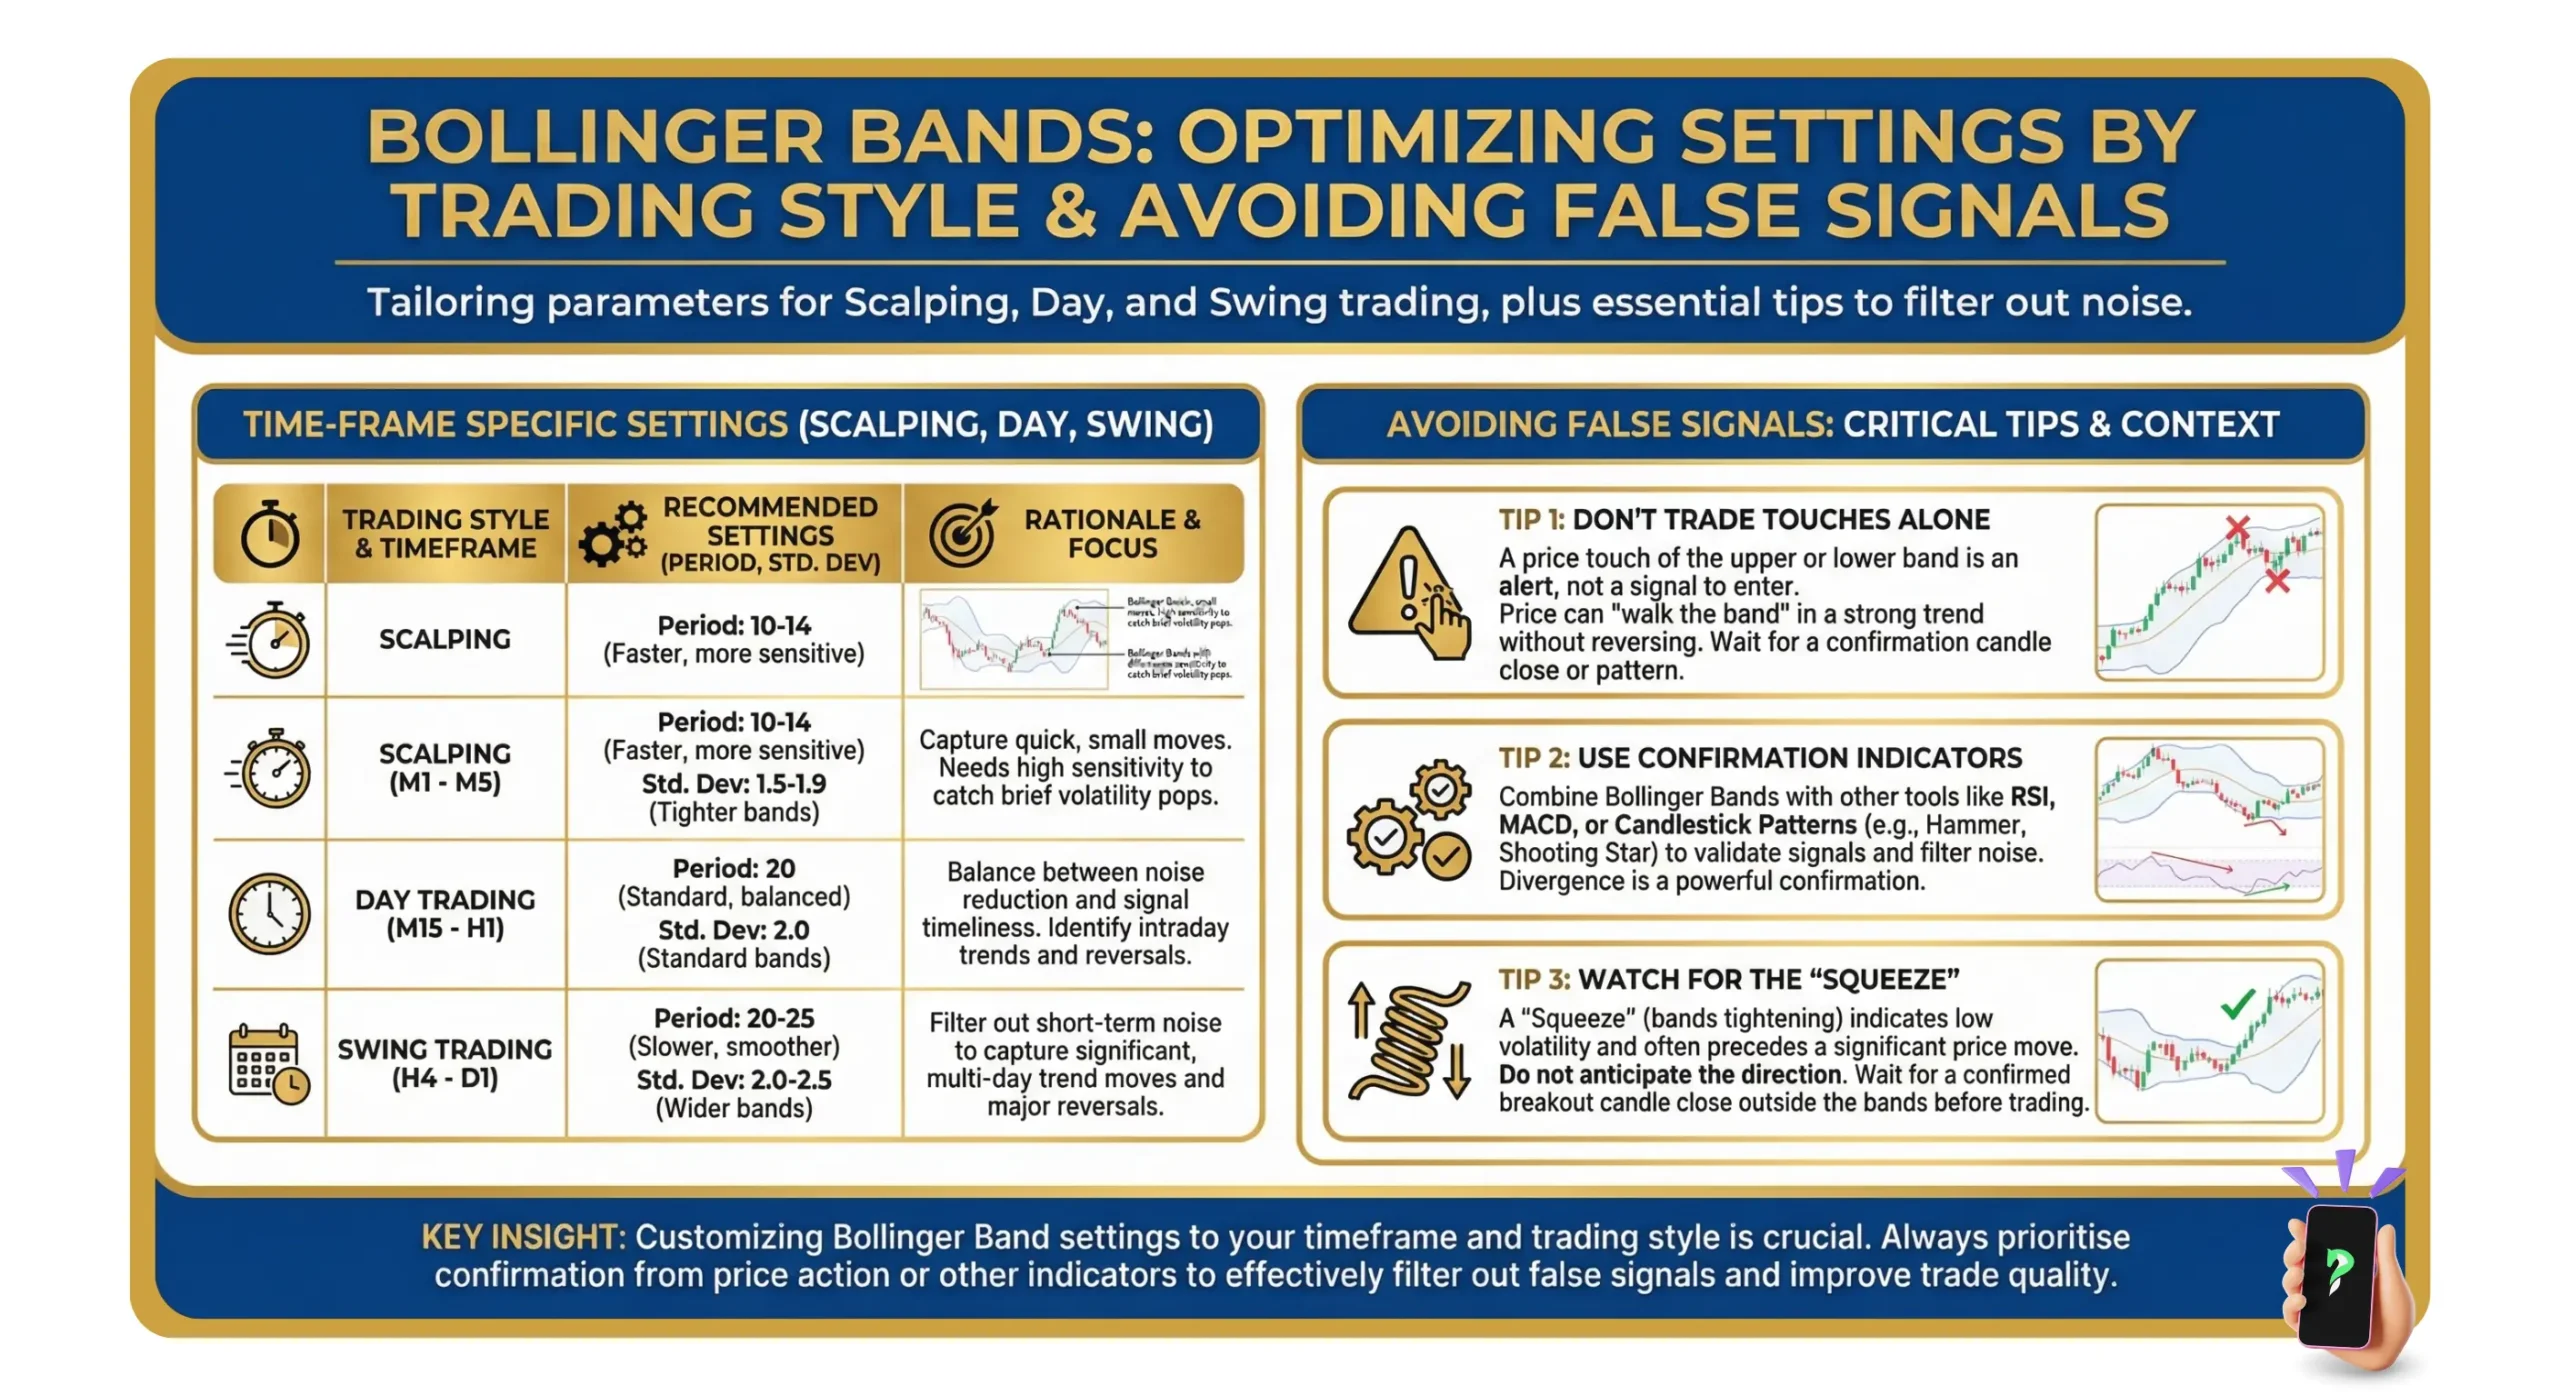
- Day trading application: In intraday trading, traders often modify the settings to a 10-period simple moving average and bands set at 1.5 to 2 standard deviations. This helps capture short-term price movements, supporting tactics such as scalping quick reversals or trading breakouts.
- Calculation process: Calculate the 20-day SMA and standard deviation of closing prices to set the upper and lower bands, allowing customization for different trading styles or timeframes.
- Avoiding mistakes: Combine Bollinger Bands with other indicators, avoid trading during strong trends, adjust settings for volatile pairs, and always use stop-losses to manage risks effectively.
1. What are Bollinger Bands?
In forex trading, Bollinger Bands serve as a key indicator for tracking price trends and measuring volatility. Created by John Bollinger in the 1980s, they’ve become a go-to for spotting potential trade setups.
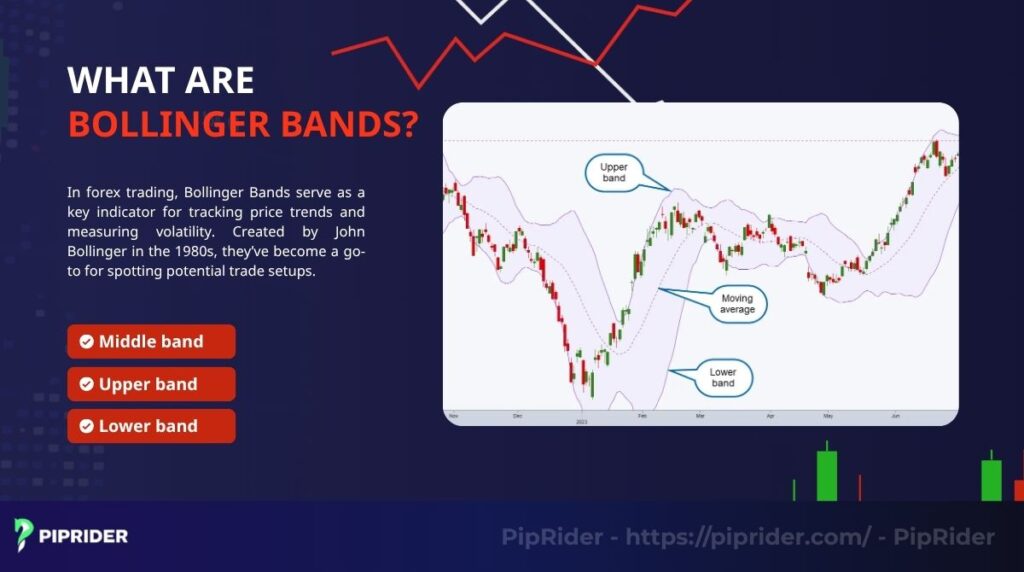
The structure of Bollinger Bands includes three lines:
- Middle band (Simple Moving Average – SMA): A 20-period simple moving average that smooths out recent price data.
- Upper band: Plotted two standard deviations above the 20-day SMA. This band reflects the upper limit of normal price fluctuations in a volatile market.
- Lower band: Plotted two standard deviations below the 20-day SMA. It marks the lower boundary of expected price movement.
These bands adjust to market conditions. When prices swing wildly, the bands widen to reflect high volatility. When the market is quiet, the bands contract, indicating reduced volatility. I’ve noticed this dynamic nature makes them perfect for forex, where currency pairs often shift quickly.
Bollinger Bands help traders see if prices are high or low compared to recent trends. They’re not a standalone tool but shine when paired with other indicators. Think of them as a volatility map, helping you identify relatively high or low price zones based on recent price action.
2. How to use Bollinger Bands in forex trading
Knowing how to use Bollinger Bands can transform your forex trading by spotting high-probability setups. This tool helps you identify when prices are overbought or oversold and catch potential breakouts. This hands-on guide will help you take the first step.
2.1. Key signals to watch
Bollinger Bands offer clear signals for traders. A price move toward the upper band can suggest overbought conditions, possibly signaling a coming reversal. Prices near the lower band suggest oversold conditions, often signaling a bounce.
My hard-won experience shows these signals work best in a ranging market. Don’t try to apply this mechanically in a strong trend, you’ll easily get run over by a big wave while trying to catch tops or bottoms against the trend.
2.2. Popular trading strategies
Here are three ways to use Bollinger Bands effectively:
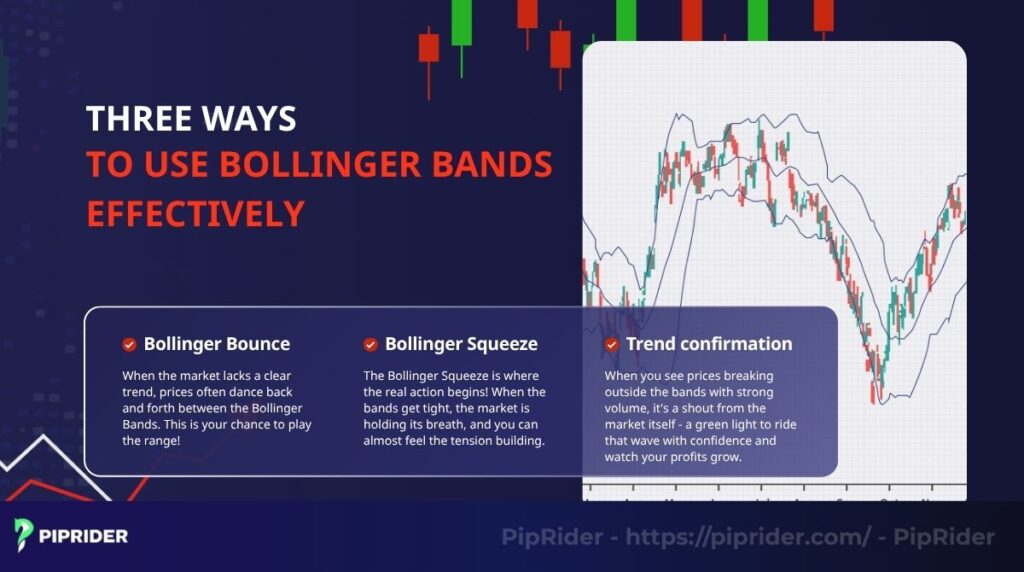
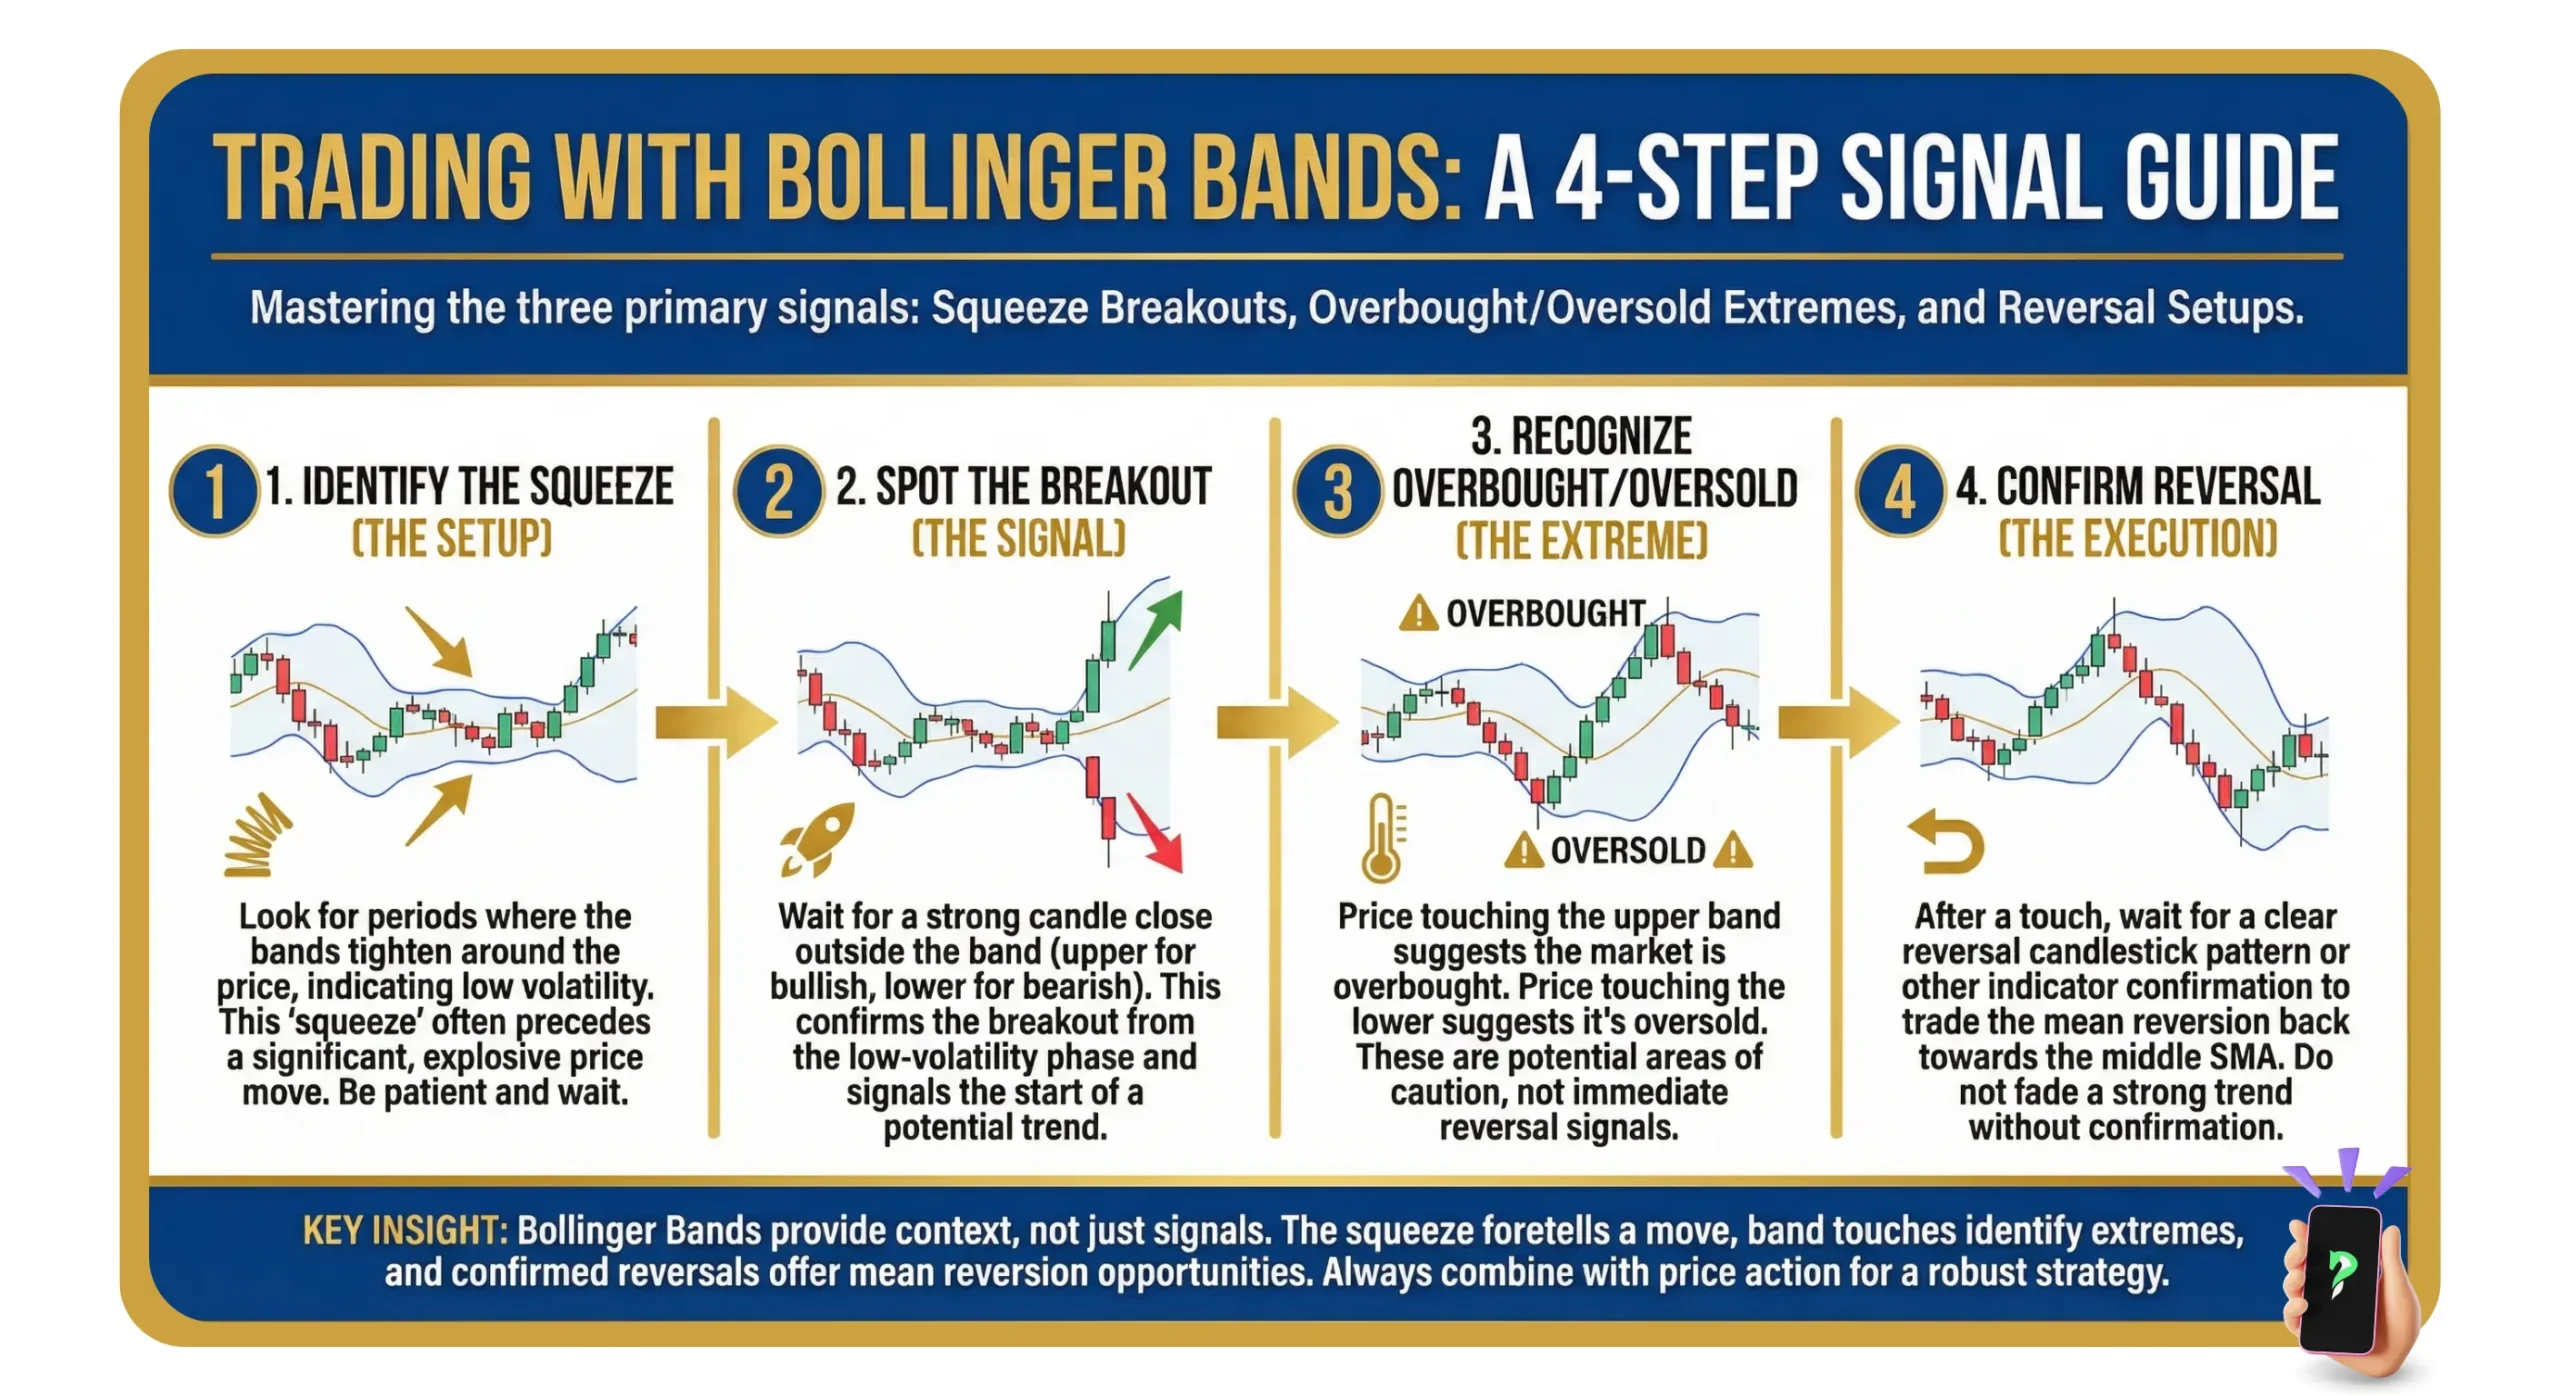
- Bollinger Bounce: When the market lacks a clear trend, prices often dance back and forth between the Bollinger Bands. This is your chance to play the range! Buying near the lower band feels like picking up a bargain, while selling near the upper band lets you lock in those sweet profits. It’s a satisfying way to make consistent gains in a quiet market.
- Bollinger Squeeze: The Bollinger Squeeze is where the real action begins! When the bands get tight, the market is holding its breath, and you can almost feel the tension building. This calm before the storm is a thrilling signal that a massive breakout is just around the corner. Be ready to jump in the second those bands start to expand, it’s a rush you won’t forget.
- Trend confirmation: In a strong trend, the price can hug the outer bands for extended periods. This isn’t a sign of exhaustion; it’s a powerful confirmation that the trend is unstoppable. When you see prices breaking outside the bands with strong volume, it’s a shout from the market itself – a green light to ride that wave with confidence and watch your profits grow.
Read more:
How to use the Supertrend indicator in trading
2.3. Step-by-step guide to setting up Bollinger Bands
Follow these steps to apply Bollinger Bands:
Step 1: Add Bollinger Bands to your platform (e.g., MT4 or TradingView).
Step2: Check if the market is ranging or trending using price patterns.
Step3: Use band signals to time entries and exits, like buying near the lower band in an uptrend.
2.4. Signals and actions
Once you’ve added Bollinger Bands to your chart, the next step is knowing how to read their signals and more importantly, how to act on them. These signals can guide your entry and exit points, but they only work well when interpreted in the right context. In this section, we’ll break down the most common Bollinger Band signals and show you what actions to consider based on each setup.
| Signal | What it means | Trading action |
| Price at upper band | Potentially overbought | Consider selling or tightening stops |
| Price at lower band | Potentially oversold | Look for buying opportunities |
| Narrow bands (squeeze) | Low volatility, breakout likely | Prepare for a big move, confirm with volume |
3. Strategy for using Bollinger Bands in day trading
Day trading forex requires quick decisions, and Bollinger Bands for day trading can help you spot fast-moving opportunities. Their ability to track intraday price swings makes them a favorite for short-term traders. Let’s explore how to use them effectively in your daily trades.
3.1. Why Bollinger Bands work for day trading
Bollinger Bands adjust to rapid price changes, perfect for the fast-paced forex market. On short timeframes like 5-minute charts, they highlight overbought or oversold levels clearly.
For a day trader, there’s nothing better than watching the price touch the lower band, entering a buy, and taking a quick profit at the middle SMA or the upper band just a few 5-minute candles later. Those are the small, consistent wins that build your confidence and your account when using Bollinger Bands.
3.2. Best settings for day trading
Day trading demands speed, and the default Bollinger Bands settings can feel like trying to catch a bullet with a spoon. That’s why many of us tweak the settings for a more aggressive approach.
A popular move is to swap the sluggish 20-period SMA for a snappy 10-period SMA, and tighten the bands to 1.5 or 2 standard deviations. This setup feels electric—it’s designed to grab those quick, fleeting opportunities that flash across the chart. However, I have to warn you, it’s a double-edged sword.
While it gets you into the action faster, it also brings a flood of false signals that can burn you if you’re not careful. You’ll need to be sharper than ever, double-checking every signal with another indicator to avoid getting faked out by a sudden market twitch.
Example: On a 5-minute EUR/USD chart, a 10-period SMA captures quick swings.
3.3. Day trading strategies
Building an effective forex trading strategy utilizing Bollinger Bands for day trading involves specific approaches:
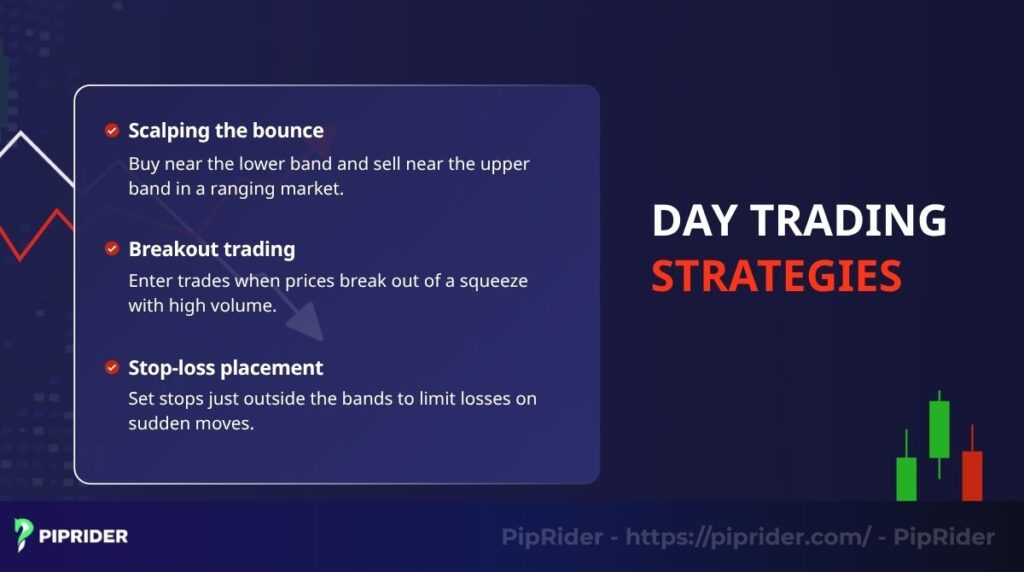
- Scalping the bounce: Buy near the lower band and sell near the upper band in a ranging market.
- Breakout trading: Enter trades when prices break out of a squeeze with high volume.
- Stop-loss placement: Set stops just outside the bands to limit losses on sudden moves.
High-impact news can turn a perfectly good strategy into a disaster, ripping your carefully planned trade to shreds as the bands explode wider in a flash. It’s a gut-wrenching feeling to watch the market’s calm suddenly shatter.
That’s why I’ve learned my lesson the hard way: always, always check the economic calendar before you even think about placing a trade. Staying on the sidelines during major announcements isn’t about being scared; it’s about being smart and protecting your account from those brutal, unpredictable moves.
4. How to calculate Bollinger Bands
Understanding how to calculate bollinger bands will deepen your grasp of this powerful forex tool and how it reacts to the market. While trading platforms like MT4 do the math for you, knowing the process builds confidence. Here’s a simple guide to crunch the numbers yourself.
Bollinger Bands rely on basic math to create their three lines. You start with a simple moving average and add standard deviations to form the bands. This process helps you see how prices move relative to their average.
Follow these steps to calculate Bollinger Bands:
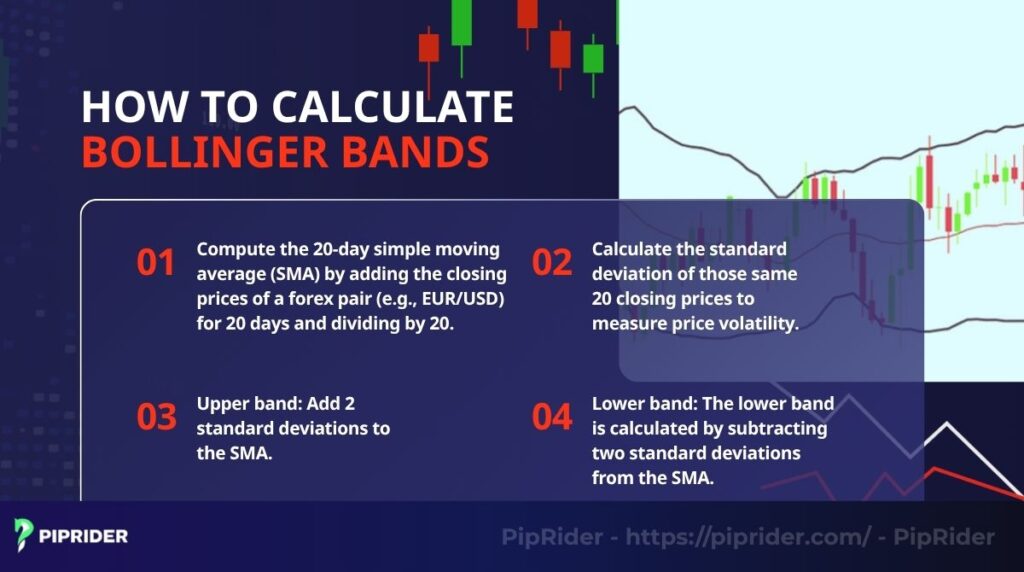
- Compute the 20-day simple moving average (SMA) by adding the closing prices of a forex pair (e.g., EUR/USD) for 20 days and dividing by 20.
- Calculate the standard deviation of those same 20 closing prices to measure price volatility.
- Upper band: Add 2 standard deviations to the SMA.
- Lower band: The lower band is calculated by subtracting two standard deviations from the SMA.
Knowing the math helps you understand why bands widen or narrow. I’ve found that manually checking calculations for a few trades clarified how volatility affects my strategies.
You can adjust the period (e.g., 10-day SMA for day trading or 50-day for longer trends). Adjusting the settings allows you to customize the bands to fit your trading approach.
5. Tips to avoid common mistakes with Bollinger Bands
Using Bollinger Bands effectively requires more than just setting them up on your chart. Many traders, especially beginners, fall into traps that can hurt their performance. Here are practical tips to keep your trading on track.
Bollinger Bands are powerful, but they’re not foolproof. Misreading signals or using them in isolation can lead to costly errors.
Let me be blunt: Bollinger Bands can burn through your account just as quickly as they can make you money if you ignore market context. Every mistake I list here comes from my own personal trading losses, and I hope you won’t have to repeat them.
Use these tips to make the most of Bollinger Bands:
- Avoid using Bollinger Bands in isolation; combining them with tools such as RSI or MACD can improve reliability.
- Avoid trading against the trend when prices consistently move along the band during a strong trend. For example, in a strong uptrend, the price can repeatedly touch the upper band without reversing. Selling at this point because you think the price is overbought is a common mistake, as it’s actually a sign confirming the trend’s strength.
- Adjust band settings for volatile forex pairs like GBP/JPY, which may need wider bands (e.g., 2.5 standard deviations).
- Always use stop-losses just outside the bands to protect against sudden market moves.
- Try out your strategies on a demo account first to gain confidence without putting real funds at risk.
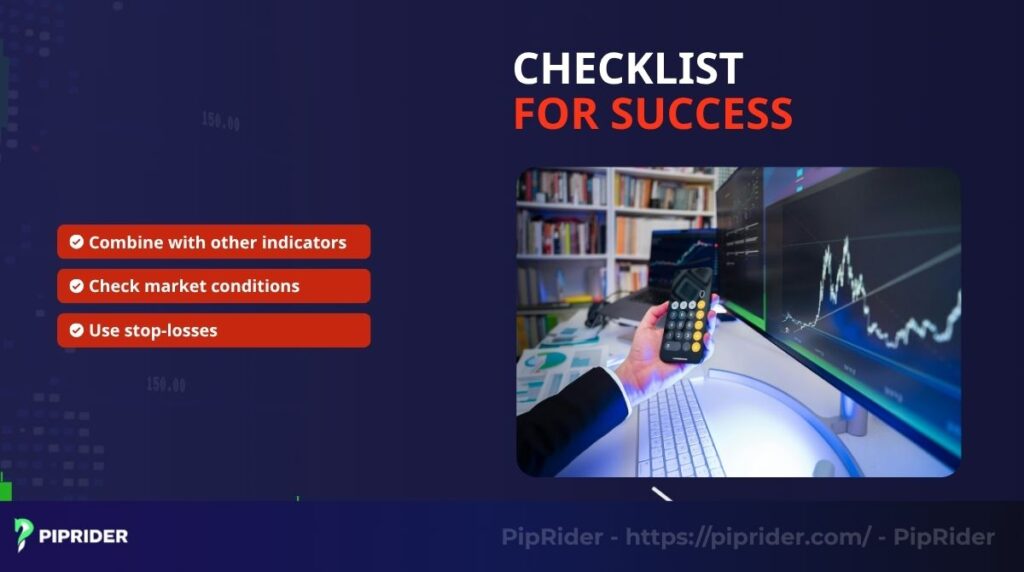
Checklist for success:
| Tip | Why it helps |
| Combine with other indicators | Reduces false signals |
| Check market conditions | Avoids missteps in trending markets |
| Use stop-losses | Limits losses on unexpected moves |
6. Combining Bollinger Bands with other indicators
Bollinger Bands are a fantastic tool, but they work best when paired with other indicators to confirm signals. This approach boosts your trading accuracy in the fast-moving forex market.
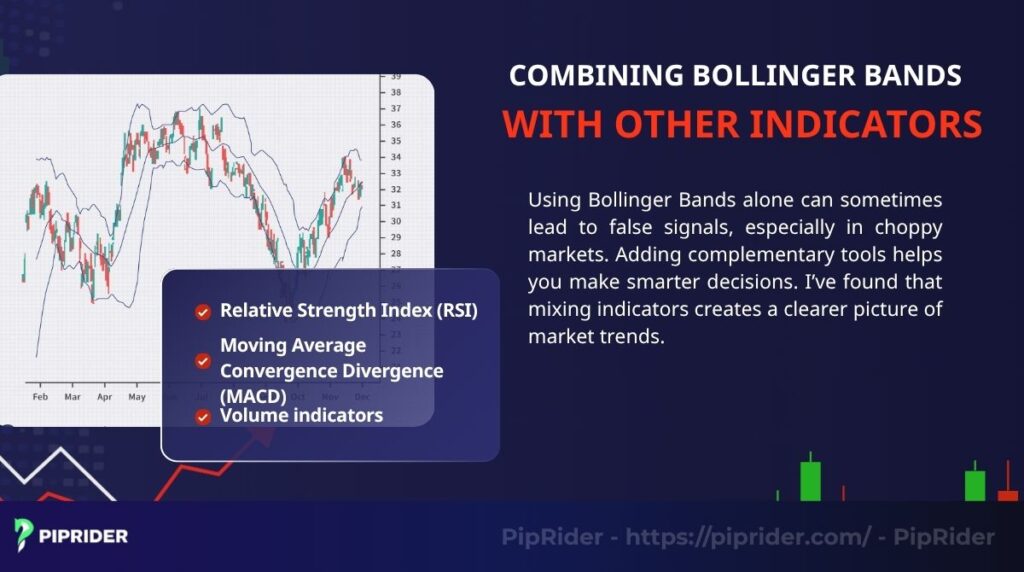
Using Bollinger Bands alone can sometimes lead to false signals, especially in choppy markets. Adding complementary tools helps you make smarter decisions. I’ve found that mixing indicators creates a clearer picture of market trends.
Here are three indicators that work well with Bollinger Bands:
- Relative Strength Index (RSI): Indicates overbought conditions when above 70 and oversold conditions when below 30, especially as price interacts with the bands.
- Moving Average Convergence Divergence (MACD): Validates trend direction, especially during breakouts from a Bollinger Squeeze.
- Volume indicators: Ensure breakouts are backed by strong trading volume to avoid false moves.
For example, if the price hits the lower band and RSI shows oversold conditions, it’s a strong buy signal. Similarly, a breakout above the upper band with rising MACD lines suggests a trend continuation. I’ve noticed this combo works well for EUR/USD trades.
7. FAQs – Frequently asked questions about Bollinger Bands
Traders often have questions about how to use Bollinger Bands effectively in forex. This section answers common queries to help you apply this tool with confidence. Let’s clear up some doubts you might have.
8. Conclusion
Bollinger Bands are a must-have tool for forex traders looking to navigate market volatility. From spotting overbought or oversold conditions to catching breakouts, they offer clear signals for smarter trades. I’ve seen how combining them with other indicators like RSI can make a big difference in accuracy.
Whether you’re day trading or planning longer-term moves, Bollinger Bands adapt to your style. Just remember to test your strategies and manage risks carefully. At Pip Rider, our blog offers more guides like this in our “Best technical indicators” and “For Beginner” categories to help you grow your skills.
Infographic Section
-
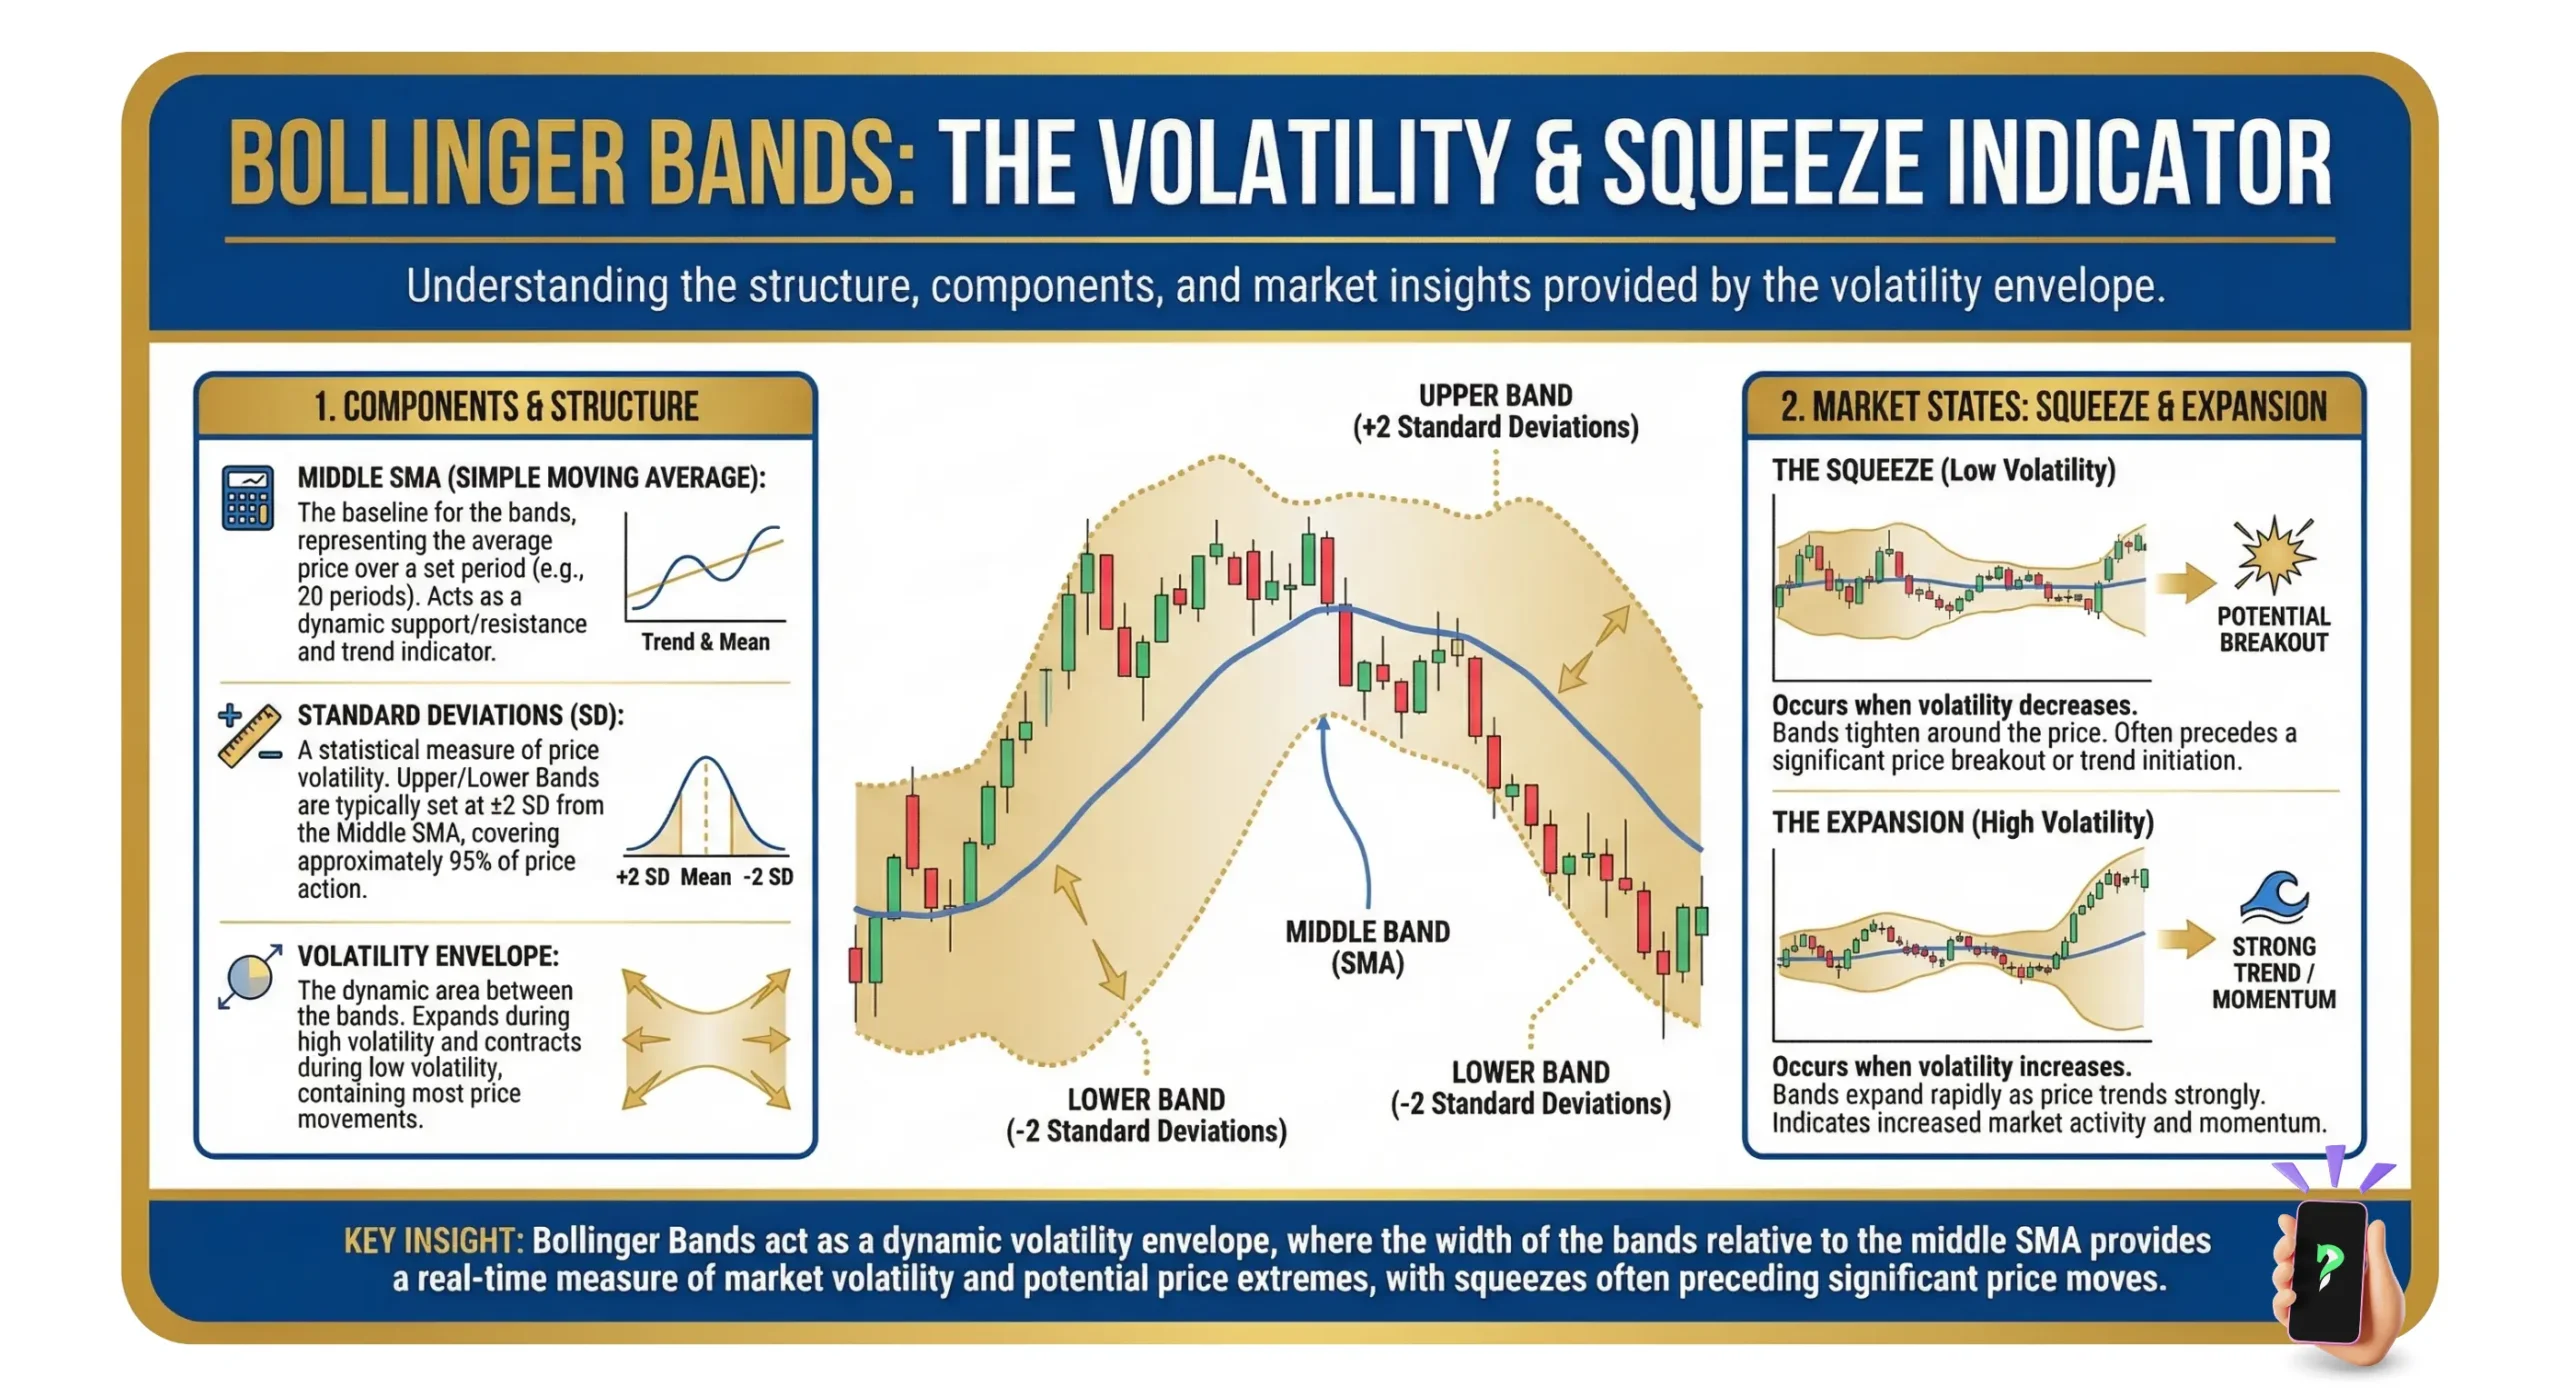
Bollinger Bands: The Volatility & Squeeze Indicator -
Trading with Bollinger Bands -
Optimizing Settings by Trading Style & Avoiding False Signals


