In the high-stakes environment of derivative markets, a coherent CFD trading strategy is the only barrier between a professional statistical edge and reckless speculation. Given the inherent risks of leverage, market success is rarely a product of luck; it is the result of a disciplined, repeatable system designed to exploit specific market inefficiencies.
This guide decodes 11 battle-tested CFD strategies, ranging from foundational trend-following systems for beginners to advanced institutional hedging techniques for seasoned professionals. By deconstructing the mechanics of entries, exits, and the rigorous mathematics of risk management, we provide a blueprint for navigating global volatility with precision and capital preservation.
Key Takeaways
- CFD trading strategies allow traders to capitalize on price movements without needing to own the underlying asset.
- Popular strategies include trend following, breakout, scalping, hedging, and swing trading.
- The choice of strategy depends on your timeframe, risk tolerance, and personal objectives.
- Combining a strategy with technical indicators like RSI, MACD, or Bollinger Bands can improve accuracy.
- A trader must always pair their strategy with a system that includes capital protection: setting Stop Loss, Take Profit, and controlling exposure.
1. What Are CFD Trading Strategies?
A Contract for Difference (CFD) is a financial product allowing traders to speculate on asset price movements without owning the asset themselves. Essentially, it is an agreement to exchange the value difference between the contract’s opening and closing times (Investopedia, 2025).
While the concept of a CFD is straightforward, trading it profitably is not. This is where trading strategy becomes essential. A strategy is a predefined set of rules that guides every decision, from when to enter and exit a trade to how much capital to risk. Without a coherent system, trading a CFD becomes gambling, exposing you to unnecessary risks from market fluctuations.
The popularity of this trading stems from several key benefits:
- Ability to go long or short: One of the main advantages of a CFD is the ability to trade in both directions. This means you can profit from both rising markets (by going long) and falling markets (by going short).
- Broad market access: A single account provides access to a vast range of global markets, including forex, stocks, commodities, and cryptocurrencies.
- Use of leverage: The use of borrowed capital allows traders to control a larger position with a smaller amount of capital. However, it’s crucial to remember that this magnifies both potential profits and potential losses.
CFD vs. Stock Trading: What’s the Difference?
To truly master CFDs, professionals always benchmark them against traditional physical stock trading. While both instruments allow you to extract profit from the financial markets, their underlying mechanics, cost structures, and strategic purposes are fundamentally different.
Here is a breakdown of the core differences that dictate how smart money utilizes each asset class:
| Feature | Physical Stock Trading | CFD Trading |
|---|---|---|
| Asset Ownership | You own the underlying asset and hold shareholder voting rights. | You own a derivative contract. No voting rights or real ownership. |
| Directional Bias | Traditionally long-biased. Profiting from falling markets is complex. | Omni-directional. You can go Long (Buy) or Short (Sell) with equal ease. |
| Short Selling Mechanics | Requires the broker to “locate and borrow” shares. Can be restricted (Hard-to-Borrow). | Instant execution. No share borrowing is required since it’s a price agreement. |
| Leverage & Margin | Unleveraged (1:1) or low margin (typically up to 2:1). Requires high capital. | Highly leveraged. You only need a fraction of the total trade value upfront as margin. |
| Holding Costs | Free to hold indefinitely (if bought with cash). Excellent for long-term investing. | Incurs daily Overnight Financing (Swaps). Costly for multi-month or multi-year holds. |
| Corporate Actions | You receive actual dividends directly into your account. | You receive cash adjustments (dividend equivalents) on long positions, but pay them on short positions. |
A pro tip from Piprider: Never confuse the purpose of these two vehicles. Use physical stocks for your long-term, “buy-and-hold” retirement portfolio where you want to build wealth without bleeding money to overnight swap fees. Use CFDs as your tactical, short-term weapon to aggressively short the market during downturns, day-trade volatility, or maximize capital efficiency through leverage.
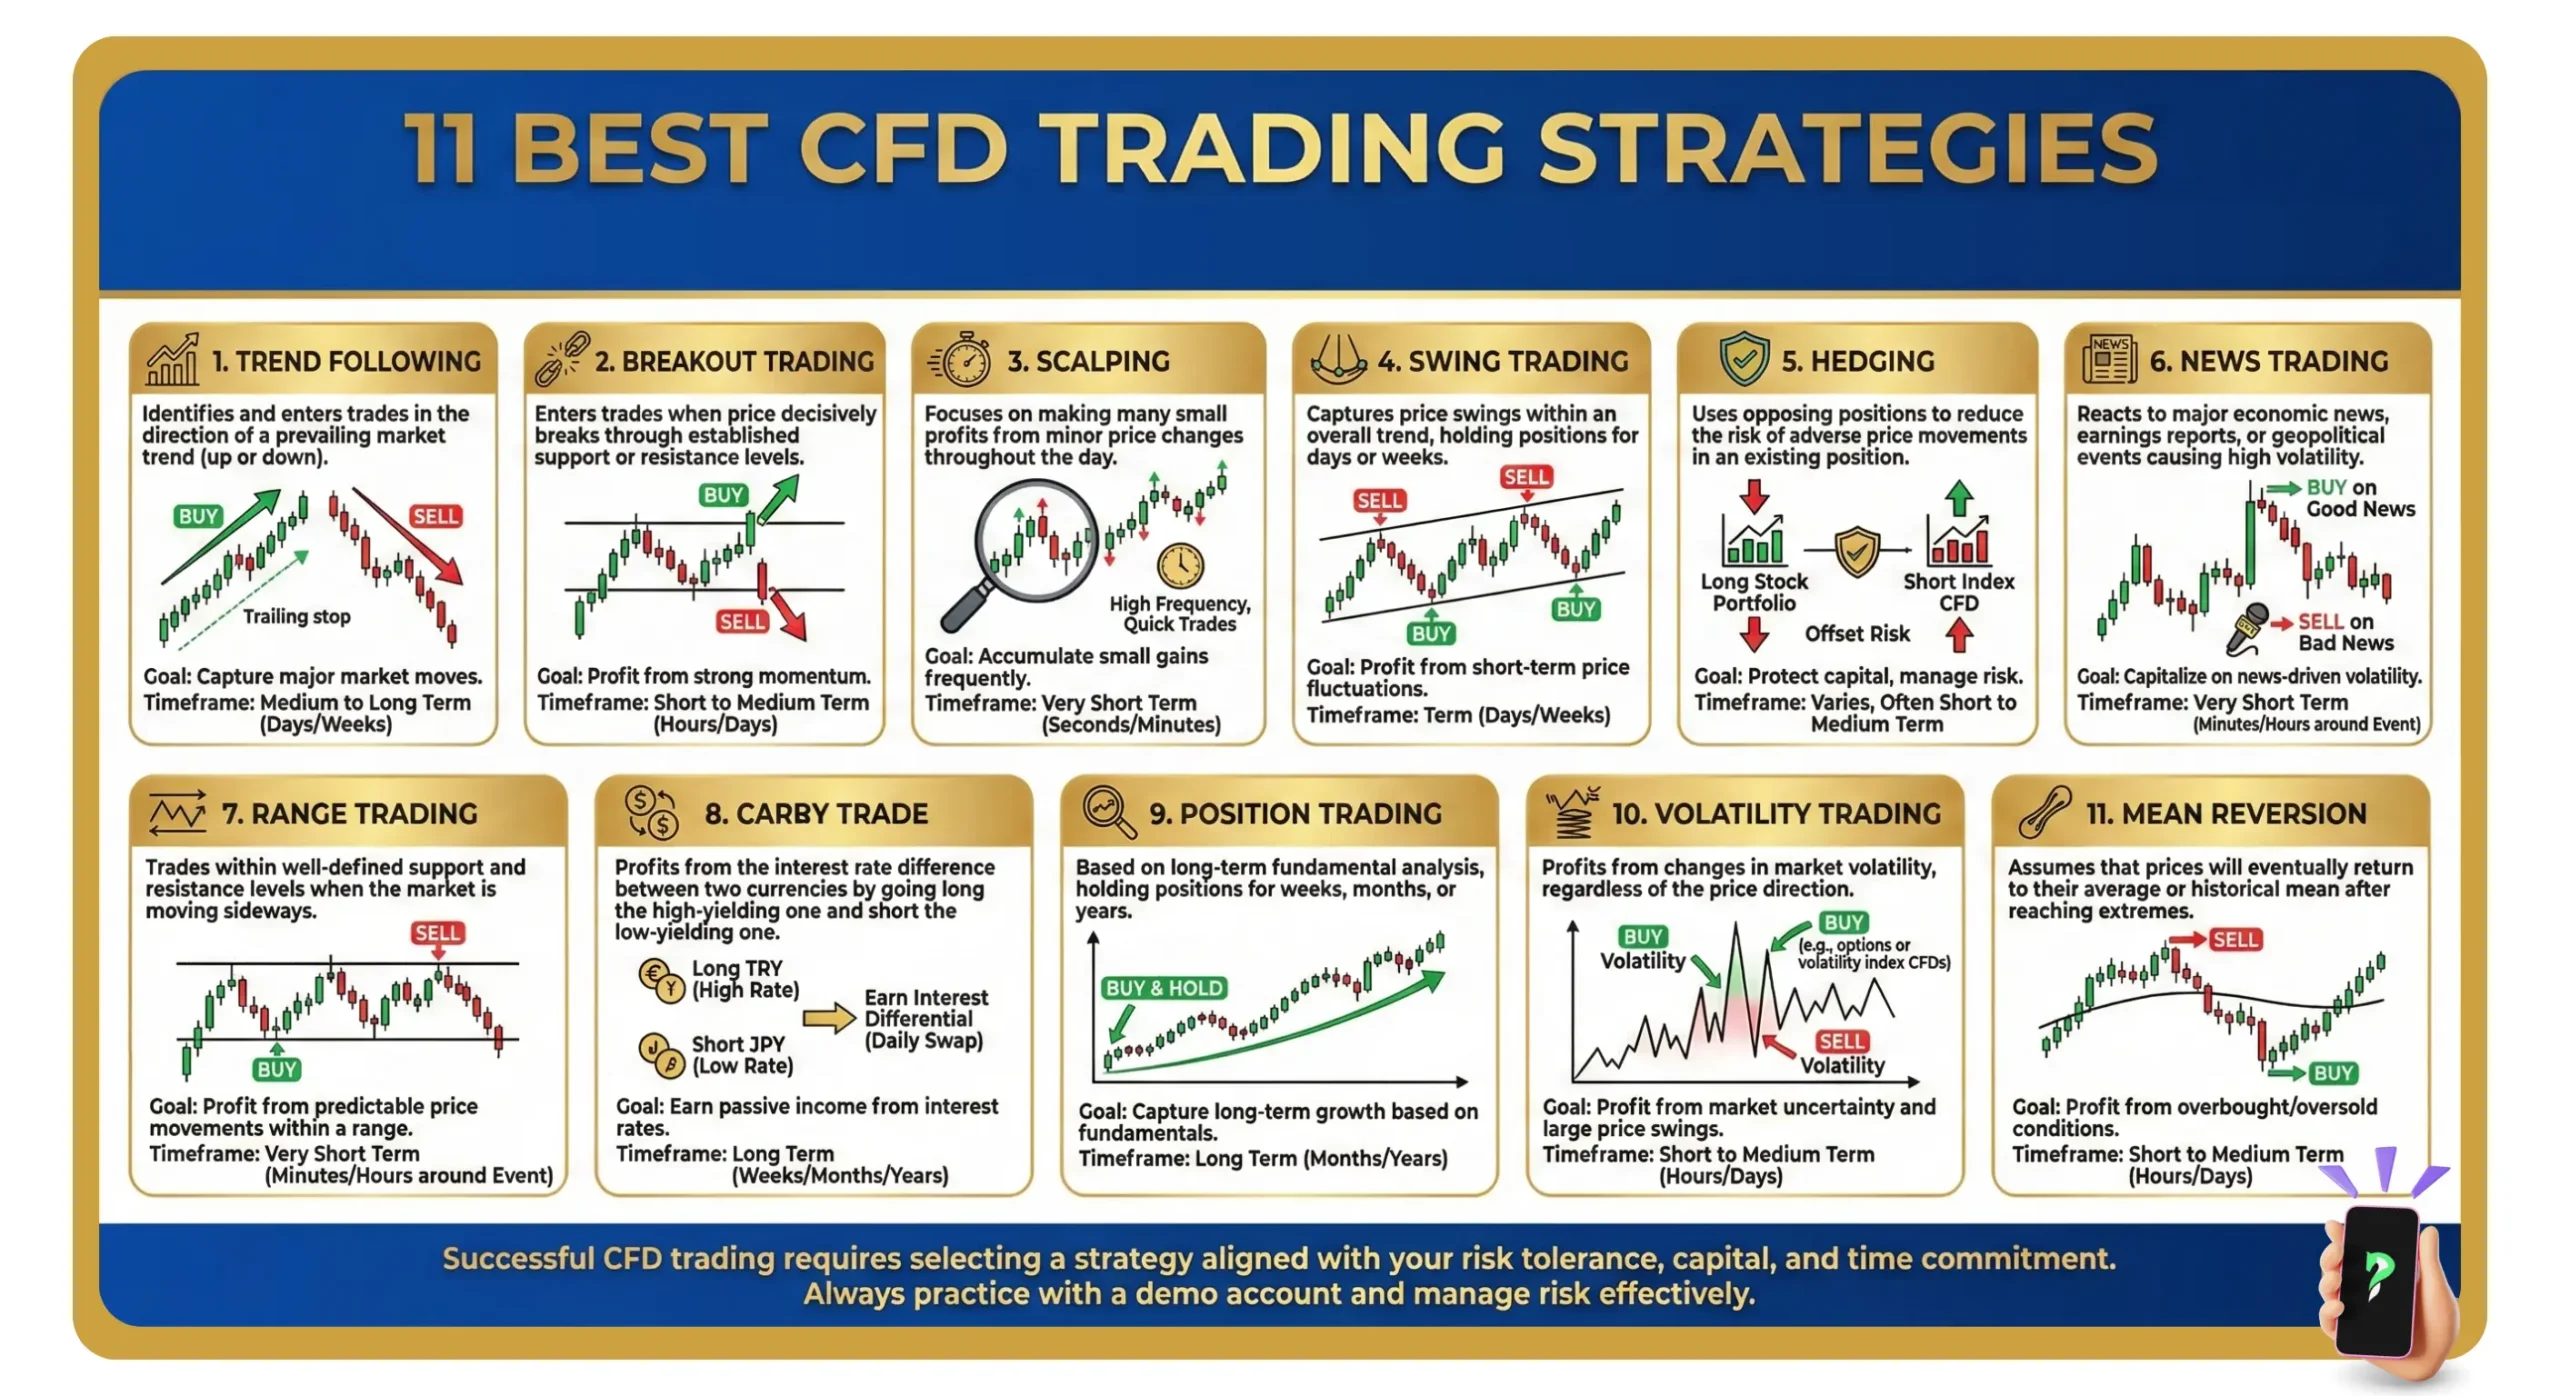
2. Top 11 CFD Trading Strategies for Traders
Before we dive into the details of each method, here is a quick comparison table to help you understand the key differences between these 11 strategies at a glance.
| Strategy | Core Concept | Typical Timeframe | Best For |
| Trend Following | Follow the main market trend. | Days to Weeks | Beginners, patient traders. |
| Breakout Trading | Trade when price breaks key levels. | Minutes to Days | Active traders who monitor key levels. |
| Scalping | Capture many small, rapid profits. | Seconds to Minutes | Highly active, full-time traders. |
| Swing Trading | Capture a single “swing” in a trend. | Days to Weeks | Part-time traders with a balanced style. |
| Hedging | Reduce risk in an existing portfolio. | Short to Medium-Term | Investors looking to protect current holdings. |
| Range Trading | Buy at support, sell at resistance. | Hours to Days | Traders who can identify clear, non-trending markets. |
| News Trading | Trade the volatility of news events. | Minutes to Hours | Experienced traders with high-risk tolerance. |
| Position Trading | Hold trades based on the long-term view. | Months to Years | Long-term investors, patient traders. |
| Mean Reversion | Bet on price returning to its average. | Hours to Days | Traders in non-trending or sideways markets. |
| Algorithmic & AI | Automate a trading system with code. | Varies (Microseconds to Months) | Quantitative analysts and advanced traders with coding skills. |
| Pair Trading | Long an outperformer, short an underperformer. | Days to Weeks | Analytical traders who can perform statistical analysis. |
2.1. Trend Following Strategy
Trend following strategy is built on the classic principle: “the trend is your friend.” It involves identifying the main direction of the market and only placing trades that follow it. Because of its straightforward logic, it’s an excellent approach for beginners.
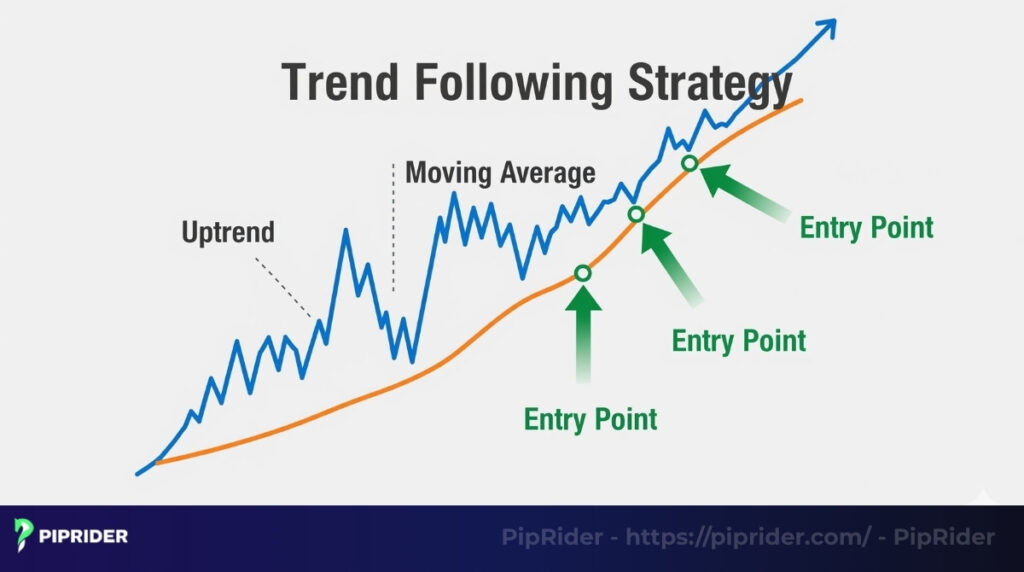
How it works: The core of this strategy relies on chart analysis to define the trend.
- Tools: Traders typically use indicators like Moving Averages or simple trend lines to identify the primary direction.
- Entry Points: Instead of chasing the price, a trend trader patiently waits for the price to pull back to key support levels (like a moving average) before entering a trade.
A pro tip from Piprider: The most common mistake is chasing a price that has already risen too far. The highest-probability entries always happen during pullbacks. Be patient.
Practical Example (UK100 Index – 1H Chart):
- The Setup: Price pulls back to a major rising trendline. Simultaneously, the fast 9 EMA crosses back above the 21 EMA.
- Execution: Enter Long at 7,610.
- Stop-Loss: 7,580 (safely below the trendline).
- Take-Profit: 7,700 (next major structural resistance).
- Risk/Reward: 1:3.
2.2. Breakout and Liquidity Grab Strategy
Breakout trading aims to capture strong moves when a price breaks key levels. However, professionals know that simple support/resistance lines are often targets for institutional “liquidity grabs” (false breakouts). The pro strategy focuses on volume and trapping the retail crowd.
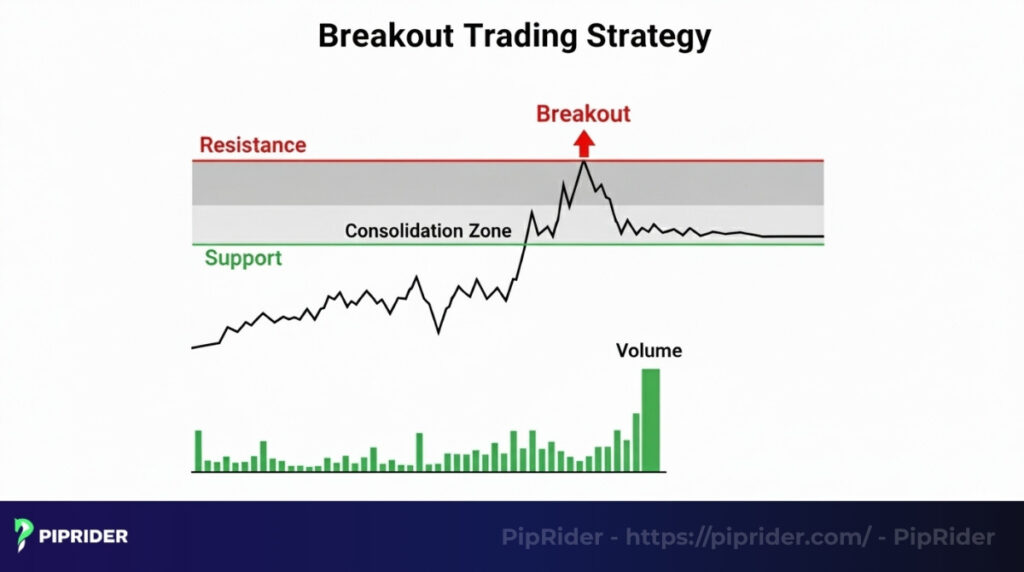
How it works:
- Volume Profile: Instead of just looking at price action, advanced traders use Volume Profile to identify the Point of Control (POC) and High Volume Nodes. A valid breakout must be backed by a massive surge in volume.
- The “Liquidity Grab”: Professionals often wait for a “false breakout” to occur first. When retail traders’ stop-losses are triggered above resistance (creating a pool of liquidity), the smart money enters in the opposite direction, capturing the true market momentum.
A pro tip from Piprider: The highest probability breakouts happen after a volatility squeeze. Wait for a “Spring” or “Upthrust” (a quick wick above/below the zone that immediately gets rejected) to confirm the trap is set before committing your capital.
Practical Example (Gold XAU/USD – 15m Chart):
- The Setup (Liquidity Grab): Gold spikes above a major $2,050 resistance, triggering retail buy orders, but immediately rejects and closes as a bearish pin bar.
- Execution: Enter Short at $2,045 (confirming the false breakout).
- Stop-Loss: $2,058 (just above the fake spike’s wick).
- Take-Profit: $2,020 (targeting the high-volume POC node below).
- Risk/Reward: ~1:2.
2.3. Scalping Strategy
This is an extremely fast-paced strategy focused on capturing dozens of small profits from minor price movements throughout the day. It is a demanding form of trading that requires intense focus and quick decision-making.
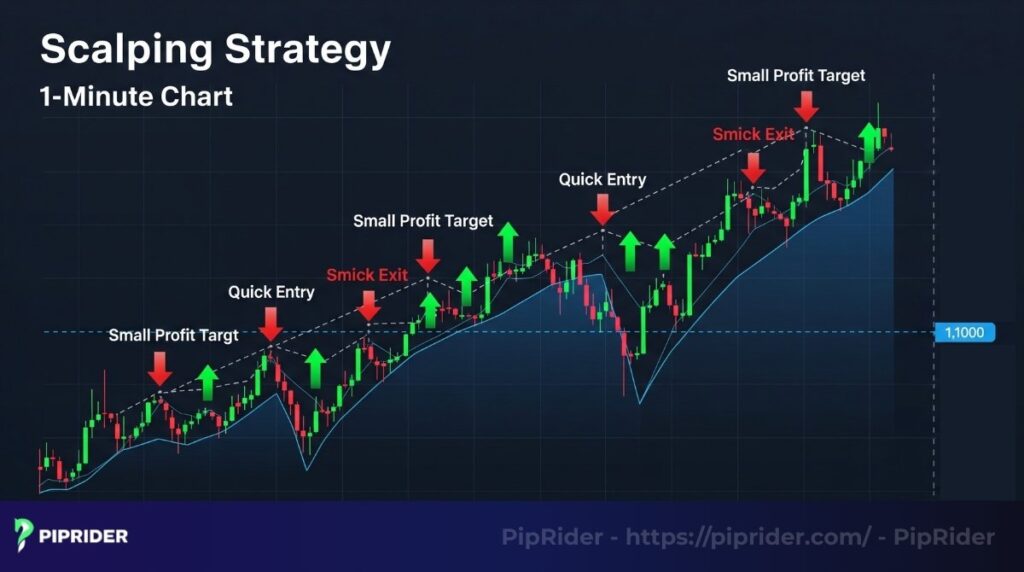
How it works:
- Scalpers operate on very low timeframes, such as 1-minute or 5-minute charts.
- This high-frequency approach relies heavily on chart analysis to identify short-term changes in price.
- The key to successful strategy is having precise exit points; profits are taken as soon as a small target is hit, without waiting for a larger trend to develop.
A pro tip from Piprider: The cardinal sin of scalping is letting a small loss turn into a big one. One large loss can wipe out dozens of small wins. A disciplined system with tight stop-losses is non-negotiable for this style of trading.
Practical Example (EUR/USD – 1m Chart):
- The Setup: High volatility during the London open. The 5 EMA crosses aggressively above the 15 EMA.
- Execution: Enter Long immediately on the candle close.
- Stop-Loss: 5 pips (placed strictly below the crossover candle).
- Take-Profit: 10 pips.
- (Note: This tight strategy requires a Raw Spread or DMA account to prevent getting stopped out by broker spreads).
2.4. Swing Trading Strategy
This style aims to capture a single price move, or “swing,” within a broader market trend. Trades are typically held for several days to a few weeks, making it a middle-ground approach between the rapid pace of day trading and the long-term nature of position trading.
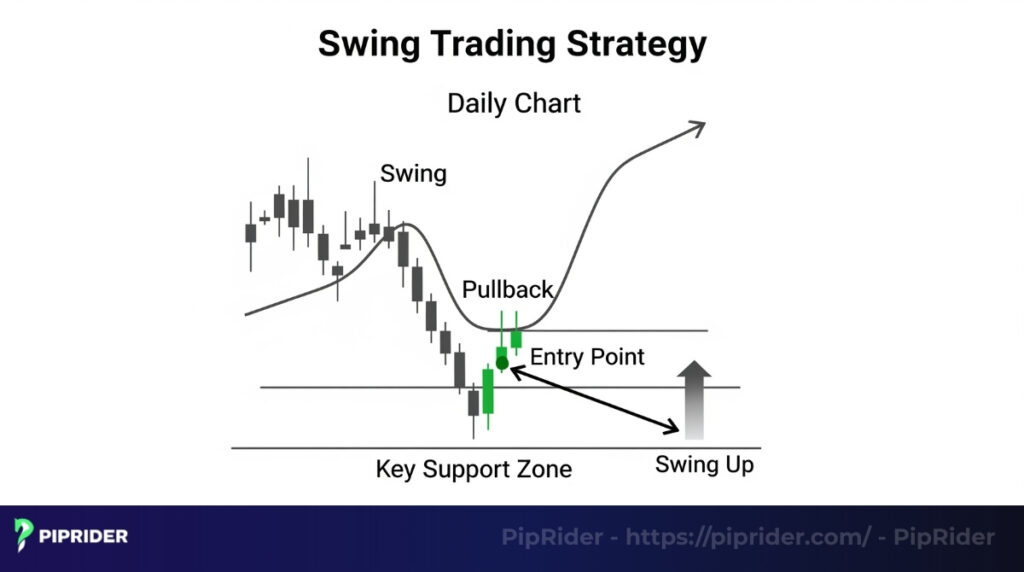
How it works: This strategy often blends technical analysis with a touch of fundamental analysis, aiming to identify the end of a pullback before the primary market direction resumes.
- Primary Chart: The daily chart is most commonly used for analysis.
- Key Tools: Traders rely on classic chart patterns, candlestick patterns, and key price zones to time their entries.
A pro tip from Piprider: The key to success is patience. Don’t get shaken out by a single day’s price movement against you. A good swing trade needs room to breathe. Set your stop-loss based on the daily chart’s price action, not intraday noise, and trust your initial analysis.
2.5. Institutional Hedging Strategy (Cross-Asset)
Hedging is not a tool to hold onto losing trades; for professionals, it’s a proactive strategy to isolate “Alpha” (individual asset performance) and neutralize “Beta” (broad market risk) to create a Delta-Neutral portfolio.
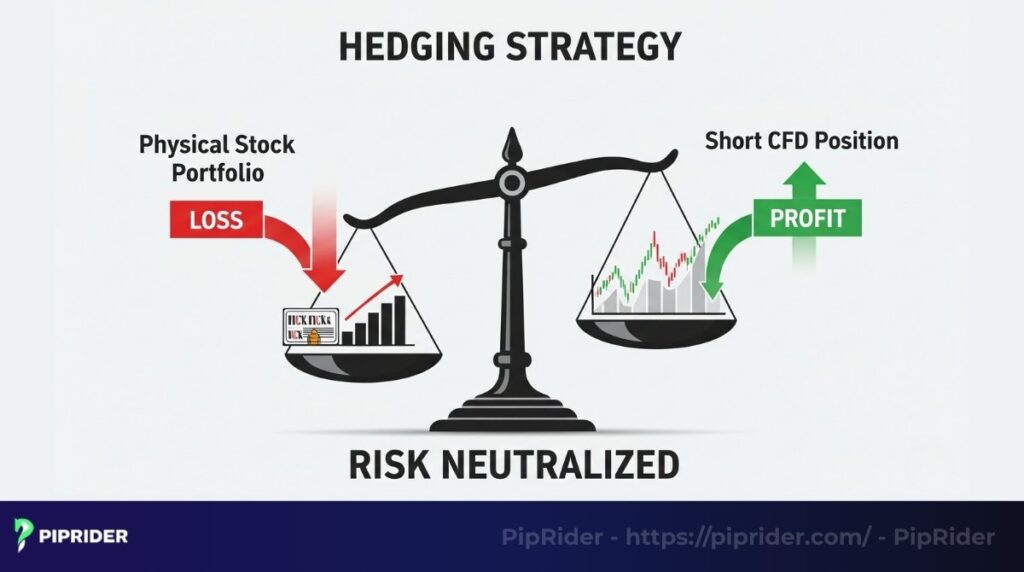
How it works:
- Cross-Asset Hedging: If a trader holds a highly profitable portfolio of tech stock CFDs but anticipates a macroeconomic downturn, they don’t sell the stocks. Instead, they open a Short Nasdaq-100 (USTEC) CFD.
- Outcome: If the market crashes, the short index CFD absorbs the portfolio’s systemic losses. The trader’s net profit relies solely on their chosen tech stocks outperforming the broader market index.
A pro tip from Piprider: Avoid “direct hedging” (going long and short on the exact same asset simultaneously). In CFD trading, this often just means paying double spreads and overnight financing fees without gaining a true structural advantage. Use correlated indices instead.
2.6. Range Trading Strategy
Range trading is a strategy for markets that are moving sideways, without a clear uptrend or downtrend. It aims to profit from the predictable price oscillations between a defined floor and ceiling.
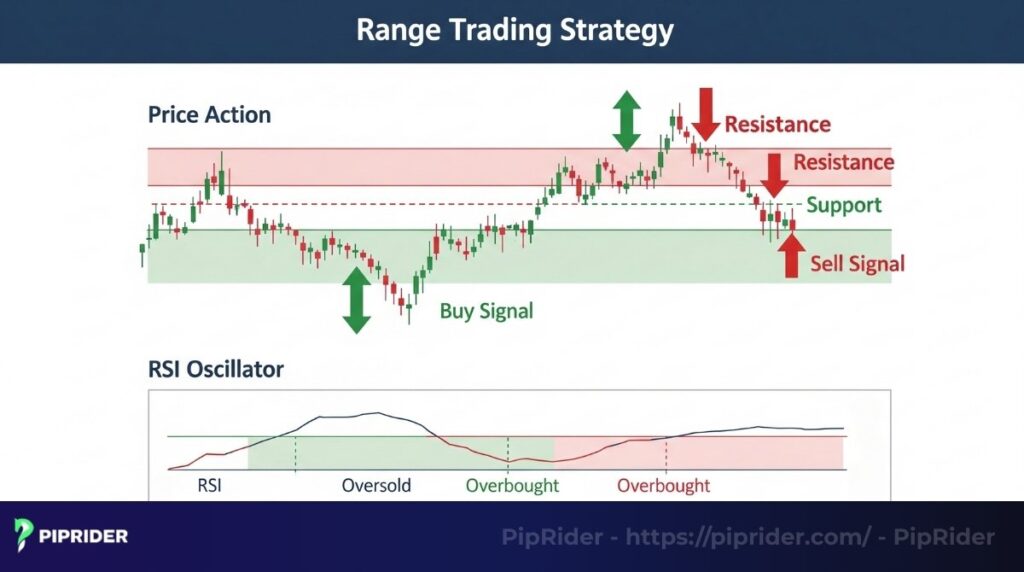
How it works:
- Identify the Range: The first step is to use technical analysis to identify a clear trading range by connecting a series of highs and lows with horizontal lines.
- Trade the Swings: The basic approach is to buy a CFD near the support level and sell it near the resistance level.
- Use Oscillators: Traders often use indicators like the RSI or Stochastic Oscillator to confirm overbought conditions near resistance and oversold conditions near support, which adds confidence to the trade signals.
A pro tip from Piprider: The greatest danger in range trading is the eventual breakout. Never assume a range will last forever. Always place your stop-loss just outside the range (below support for a long trade, above resistance for a short trade) to protect yourself when the market finally decides to trend again.
2.7. Macro Deviation News Strategy
Amateurs trade the headline; professionals trade the deviation. This strategy focuses on profiting from the intense market volatility when actual economic data drastically differs from the market’s consensus estimate.
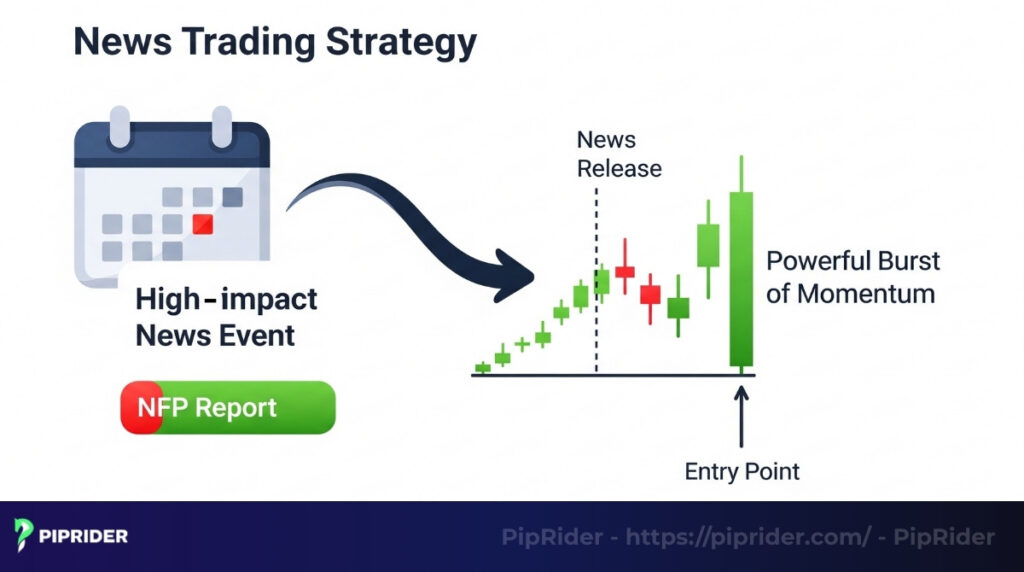
How it works:
- Trading the Variance: If the market expects inflation to drop to 3.1% and it does, the news is already “priced in.” Pro traders only execute when there is a significant shock (e.g., it prints at 3.4%).
- Volatility Straddles: Advanced operators look for extreme volatility contraction (a tight Bollinger Band Squeeze) directly preceding events like the NFP or CPI. They place automated Stop Entry orders just outside the consolidation zone to catch the explosive momentum expansion.
A pro tip from Piprider: News trading without a Guaranteed Stop-Loss Order (GSLO) is financial suicide due to extreme slippage. Always use GSLOs during tier-1 data releases to hard-cap your maximum drawdown.
2.8. Position Trading Strategy
Position strategy is focused on capturing the majority of major, long-term market trends, with trades lasting for months or even years. This strategy is less concerned with short-term market noise and more with the big-picture economic and market outlook.
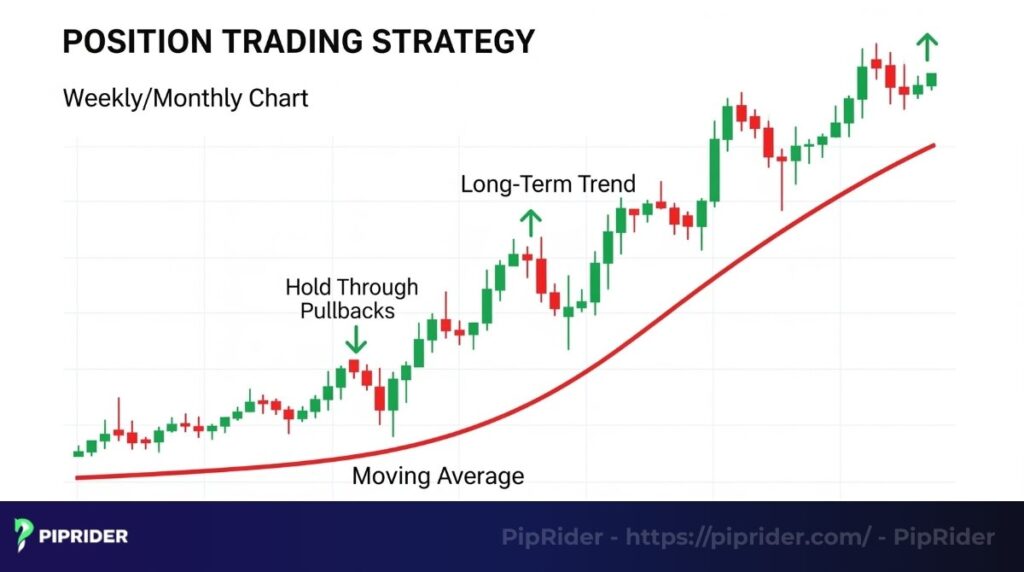
How it works:
- A combination of macro analysis and long-term technical analysis is fundamental to this approach.
- The goal is to identify assets that have the potential for a sustained, long-lasting trend based on shifts in economic policy, industry changes, or company performance.
- Traders using this style operate primarily on weekly or monthly charts, using long-term moving averages to guide their decisions.
A pro tip from Piprider: The main challenge for this method is the mental discipline to hold through inevitable pullbacks. Remember that holding a geared position for many months incurs overnight financing costs (swaps), which can add up. It’s crucial to factor these costs into your system.
2.9. Mean Reversion Strategy
Mean reversion strategy is based on the statistical concept that asset prices tend to revert to their long-term average (or mean) over time. After an extreme price move in one direction, this strategy anticipates a corrective move back toward the average.
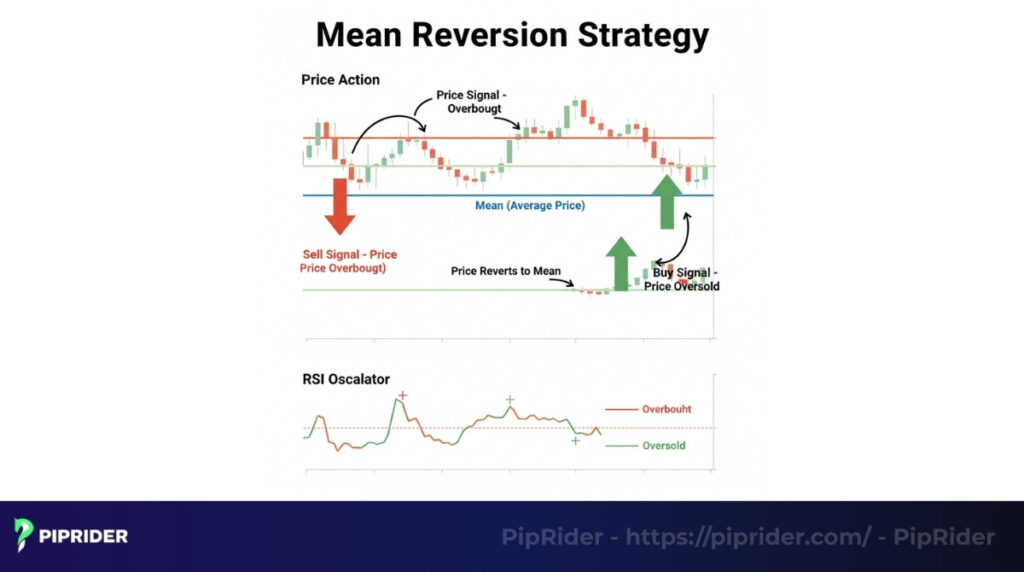
How it Works:
- Identifying “overstretched” conditions relies heavily on charting tools.
- Indicators like Bollinger Bands are commonly used. A trade might be triggered when the price of a CFD touches the outer bands, signaling it has moved far from its short-term average.
- Oscillators like the Relative Strength Index (RSI) are also used to confirm overbought or oversold readings before a trade is placed.
A pro tip from Piprider: The greatest risk with mean reversion is fighting a strong trend. A stock in a powerful uptrend can stay “overbought” for a long time. We only consider this strategy in markets that are showing signs of range-bound or sideways price action. Never try to short a runaway bull market.
2.10. Algorithmic & AI-Based Strategies
Algorithmic & AI-Based Strategies is the most advanced category of strategies, where a computer program executes trades automatically based on a predefined set of rules. This approach, known as algorithmic trading or automated trading, is designed to remove human emotion and execute trades with speed and precision that are impossible to achieve manually.
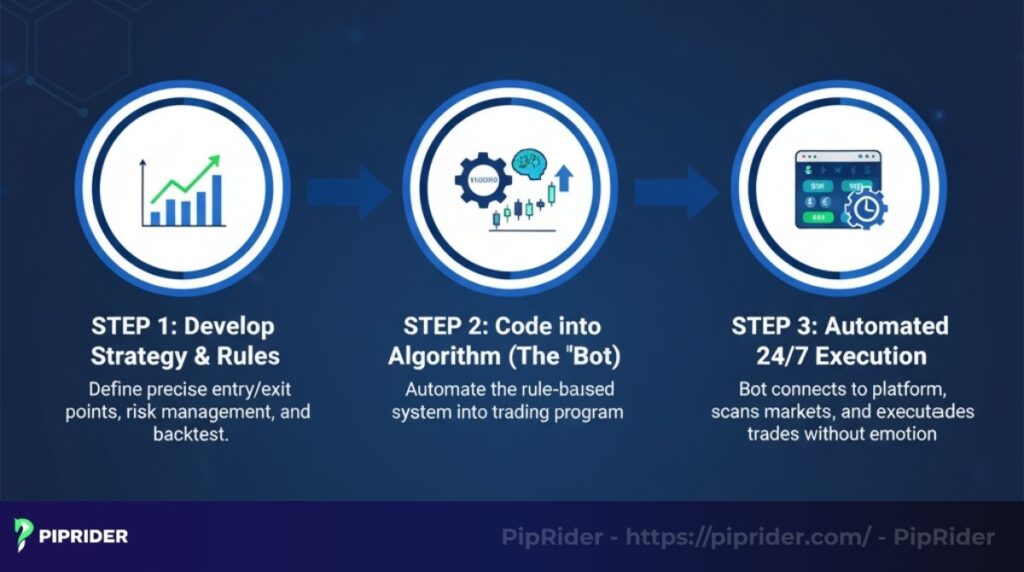
How it works:
- A trader first develops a specific, rule-based trading system that has been thoroughly backtested for profitability.
- This system is then coded into an algorithm, or “trading bot.”
- The algorithm connects to a trading platform and automatically scans for opportunities and executes trades 24/7, removing hesitation.
- More advanced systems use AI and machine learning to adapt and optimize the strategy over time based on changing market conditions.
A pro tip from Piprider: Developing a profitable algorithmic trading system is extremely difficult and resource-intensive. It requires deep knowledge of coding, statistics, and the markets. For the vast majority of retail traders, mastering one of the manual strategies discussed earlier is a far more practical and achievable goal for building a personal trading plan.
2.11. Pair Trading Strategy
Pair trading is a market-neutral strategy that involves simultaneously taking a long position in one asset and a short position in a related, underperforming asset.
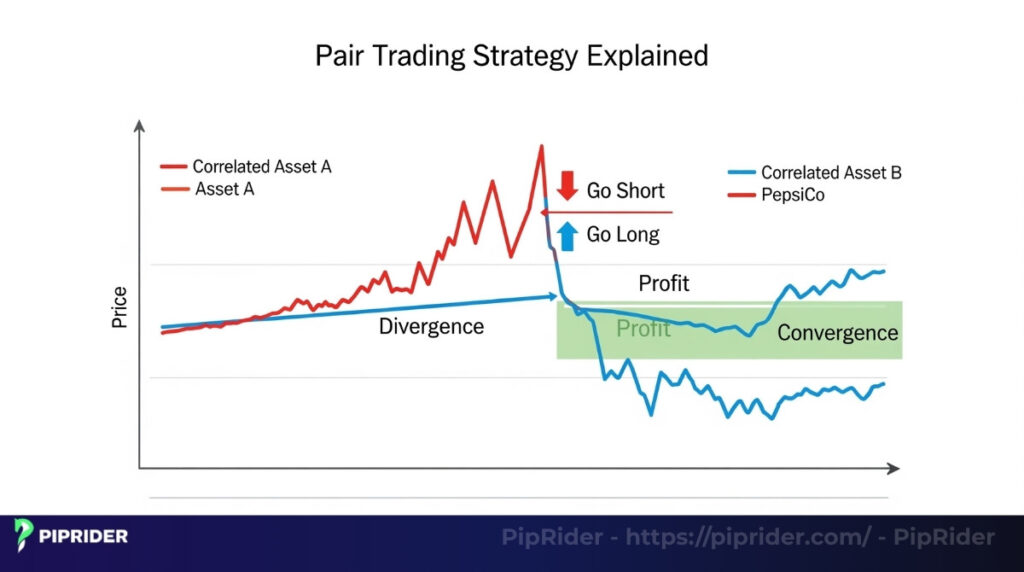
How it Works:
- This approach relies on identifying two highly correlated assets whose price relationship has temporarily diverged.
- A common example of pair trading is with two companies in the same industry (e.g., long Coca-Cola, short PepsiCo).
- The trade profits when the ‘spread’ between the two assets converges back to its historical average.
A Pro Tip from Piprider: This is a sophisticated strategy that requires statistical analysis to identify valid pairs. The main risk is that the historical correlation between the two assets breaks down permanently.
3. Essential Platforms & Tools for CFD Traders
A professional trader is only as good as the tools they wield. In the fast-paced CFD market, a platform freezing for two seconds during a major news release can cost you thousands of dollars. Retail traders often use whatever default web platform their broker provides; professionals custom-build their trading environment.
Here is the essential technology stack required to execute advanced CFD strategies:
3.1. Execution Platforms (Where the clicking happens)
Your execution platform is your direct link to the liquidity provider. Speed, stability, and advanced order types are non-negotiable here:
- MetaTrader 4 and 5 (MT4/MT5): The undisputed industry standards. While the interface feels dated, its reliability is unmatched. MT4 is heavily favored for Forex CFDs, while MT5 is superior for Stock and Commodity CFDs due to its broader market access. Both allow for algorithmic trading via Expert Advisors (EAs).
- cTrader: The modern weapon of choice for Scalpers and Day Traders. cTrader offers natively integrated Level II pricing (Depth of Market), one-click execution, and advanced order protection features that are far superior to the MetaTrader series right out of the box.
Always ensure your execution platform is provided by a broker regulated by tier-1 authorities (e.g., FCA, ASIC) to mitigate custodial risks.
3.2. Charting and Analysis (Where the thinking happens)
To find high-probability setups, you need an environment dedicated purely to technical analysis, free from the psychological pressure of the execution terminal:
- TradingView: Never do your deep technical analysis on the same platform where you execute trades. TradingView is the ultimate charting software. It offers cloud-based syncing, institutional-grade indicators (like the Volume Profile used in our Breakout Strategy), and the ability to backtest strategies using Pine Script.
3.3. Macro & Risk Management Tools
Beyond charts, professional traders rely on specialized software to monitor macroeconomic shifts and audit their own statistical performance:
- Economic Calendars: Tools like Forex Factory or Investing.com are mandatory for the Macro Deviation News Strategy. Professionals don’t just look at the release time; they monitor the consensus forecast and historical deviations.
- Trade Journaling Software: As mentioned in the Trading Psychology section, fixing your emotional leaks requires data. Platforms like Edgewonk or TraderSync automatically import your CFD broker data to calculate your mathematical expectancy, win rate by day of the week, and performance per specific strategy.
A pro tip from Piprider: Always separate your “Analysis Environment” from your “Execution Environment”. Do your high-level chart markups on TradingView. When the price hits your alert, switch to MT5 or cTrader solely to click the button and manage the risk. This physical separation prevents impulse clicking and FOMO.
3.4. Timing the Market: The Liquidity Window
Even the best CFD strategy can fail during “dead zones” (low liquidity hours). For strategies like Scalping and Breakouts, professional traders focus on the London-New York Overlap (13:00 – 17:00 UTC). This is when global volume is at its peak, spreads are at their narrowest, and price movements are most reliable.
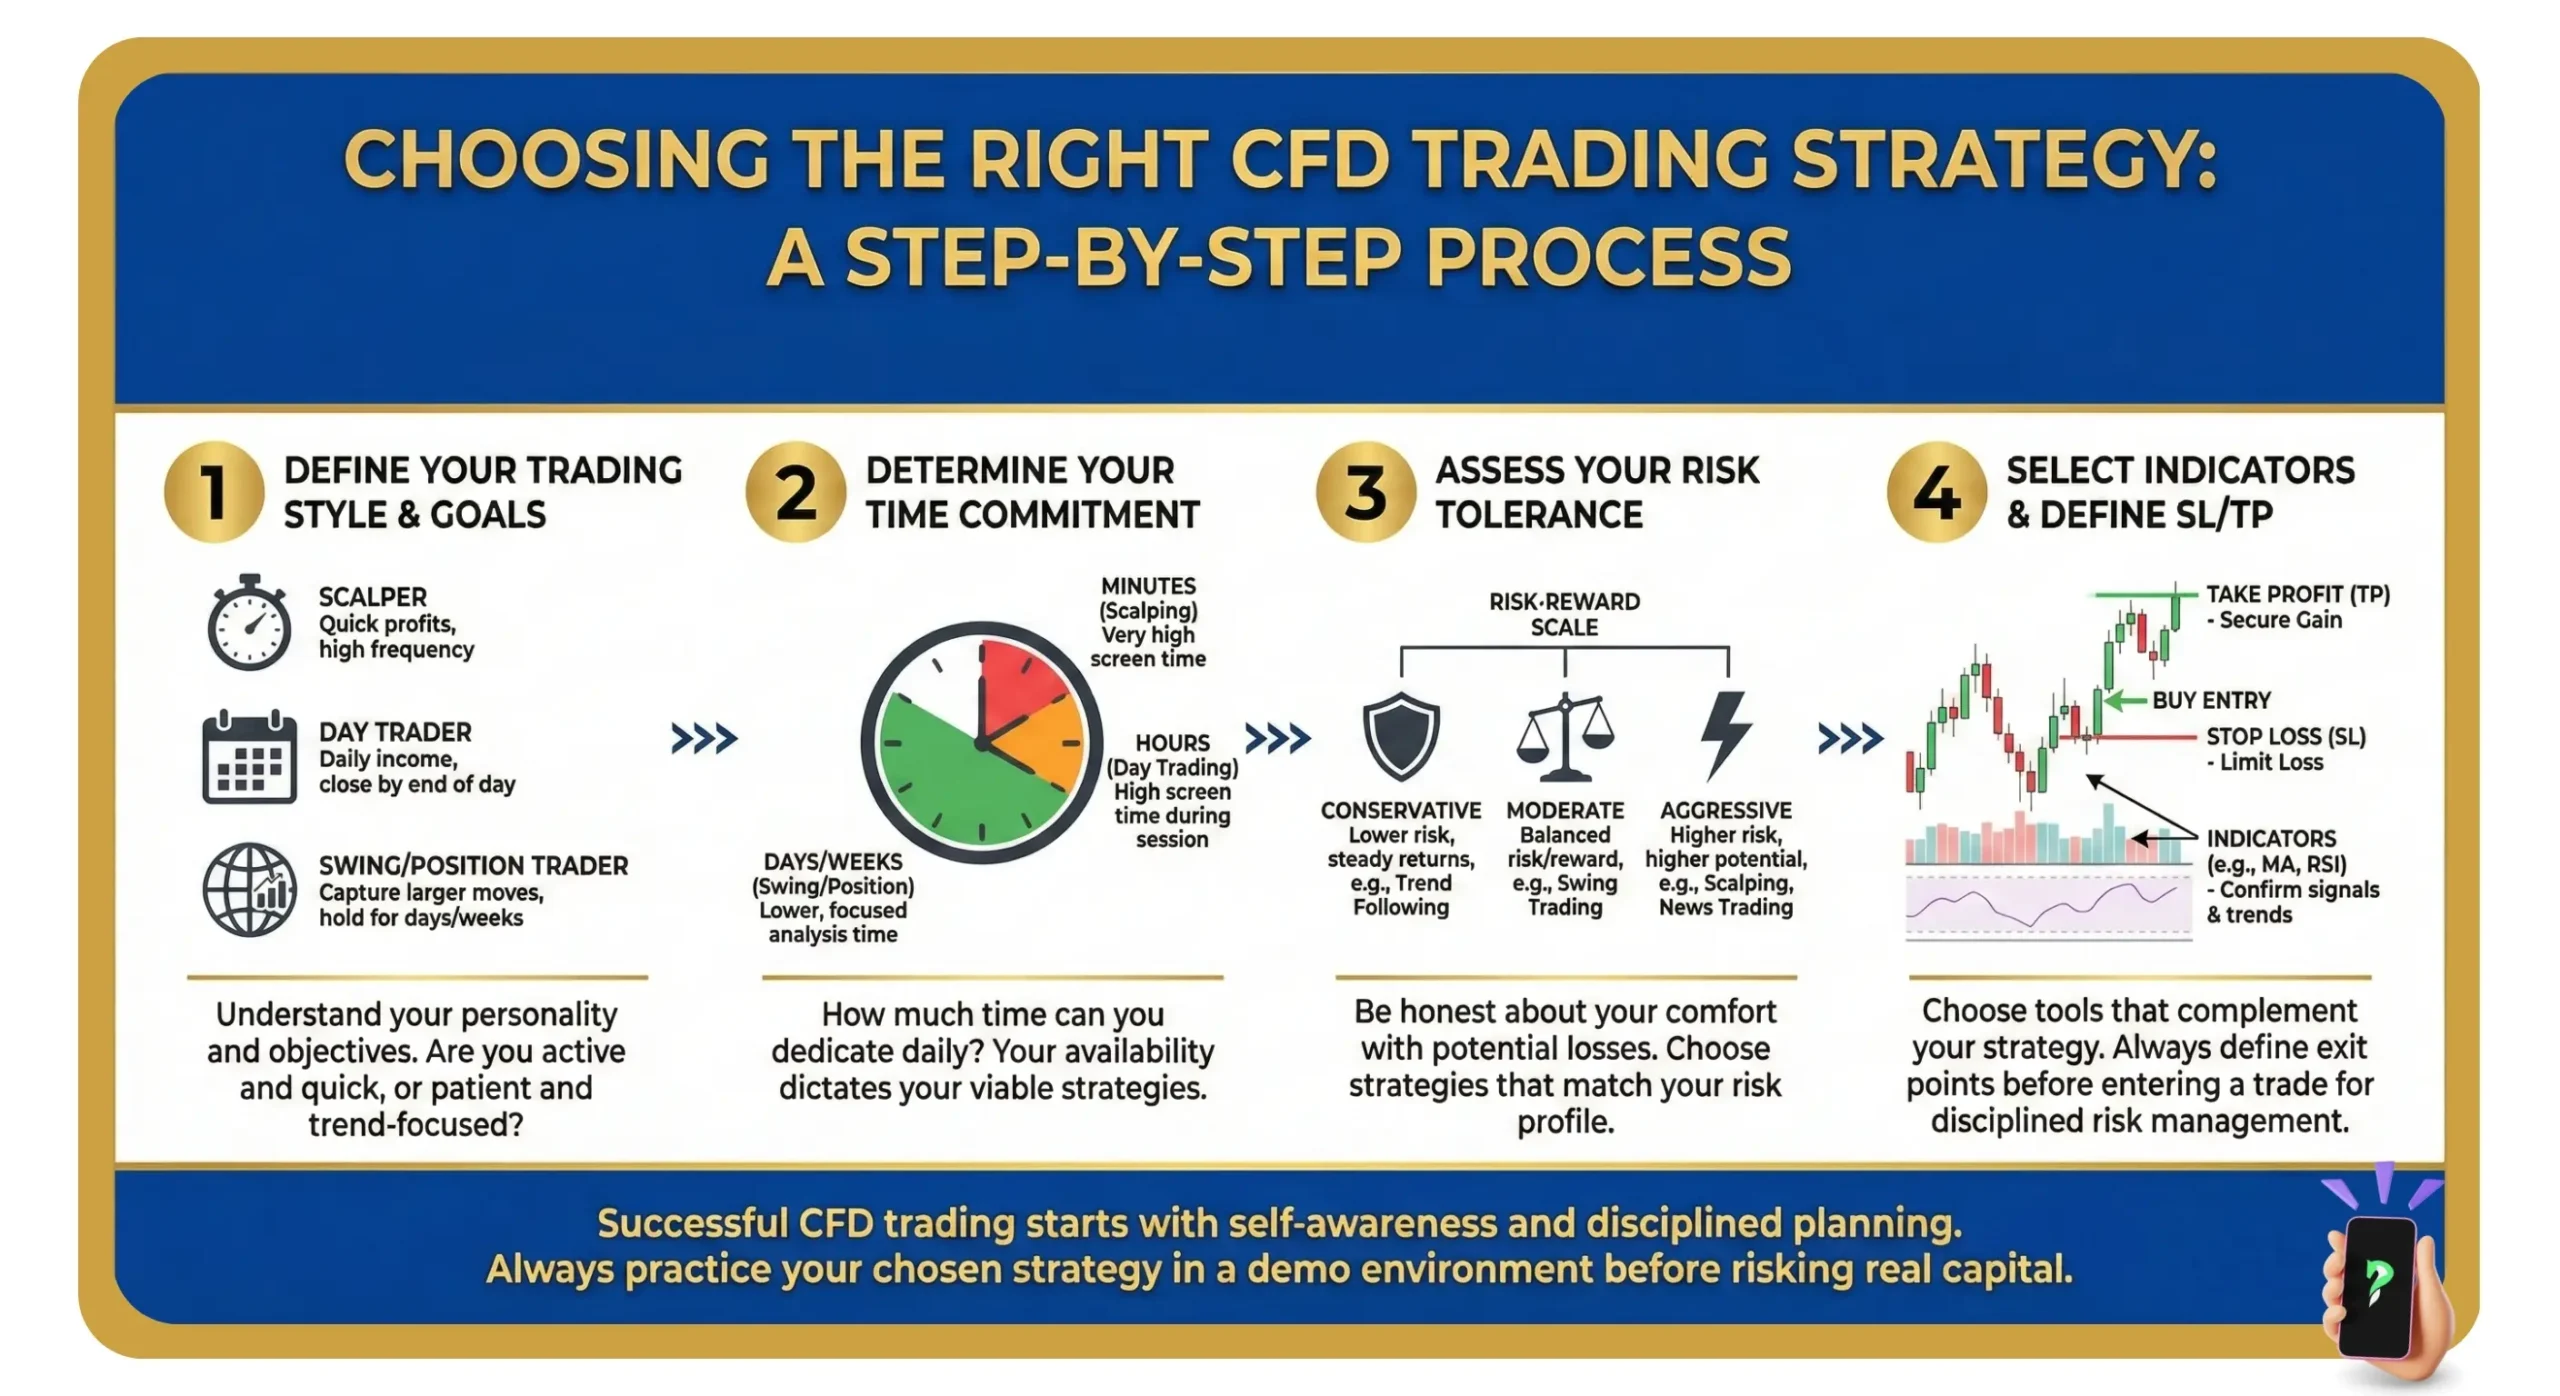
4. How to Choose the Best CFD Strategy for Your Trading Style
There is no single “best” strategy. The right approach is the one that fits you. To find it, honestly assess three key factors:
- Your time commitment: How much time can you dedicate to the markets? A full-time job is better suited for swing trading.
- Your risk appetite: What is your personality? Long-term holds demand patience, while day trading is for those who prefer fast action.
- Your trading goals: What is your objective? Long-term growth (position trading) is different from generating daily income.
4.1. Choosing Based on Experience
- For beginners: We recommend starting with strategies that have clear rules, such as Trend Following.
- For experienced traders: More demanding strategies like news-based trading are better suited for those who can manage high market energy.
4.2. Combining Strategies: A Practical Example
Advanced traders adapt to the market by using a portfolio of strategies. Imagine a trader with a full-time job whose primary goal is long-term growth.
- Core Strategy (80% of capital): Their main approach is position trading. They use weekly charts and fundamental analysis to identify long-term trends in a few key stock CFDs, holding trades for months.
- Secondary Strategy (20% of capital): However, they notice that a major forex pair, like EUR/USD, has been stuck in a clear sideways range for the past month. For this specific asset, they switch to a Range Trading strategy on the daily chart, buying the CFD at support and selling at resistance to generate additional income while their main positions develop. By using different trading approaches, they can adapt to various market conditions.
5. Using Technical Indicators with CFD Strategies
While a strategy gives you a roadmap, technical indicators provide the real-time signals that help you navigate it. They are essential for timing your entries and exits with greater precision. For any trader, mastering a few key indicators is non-negotiable.
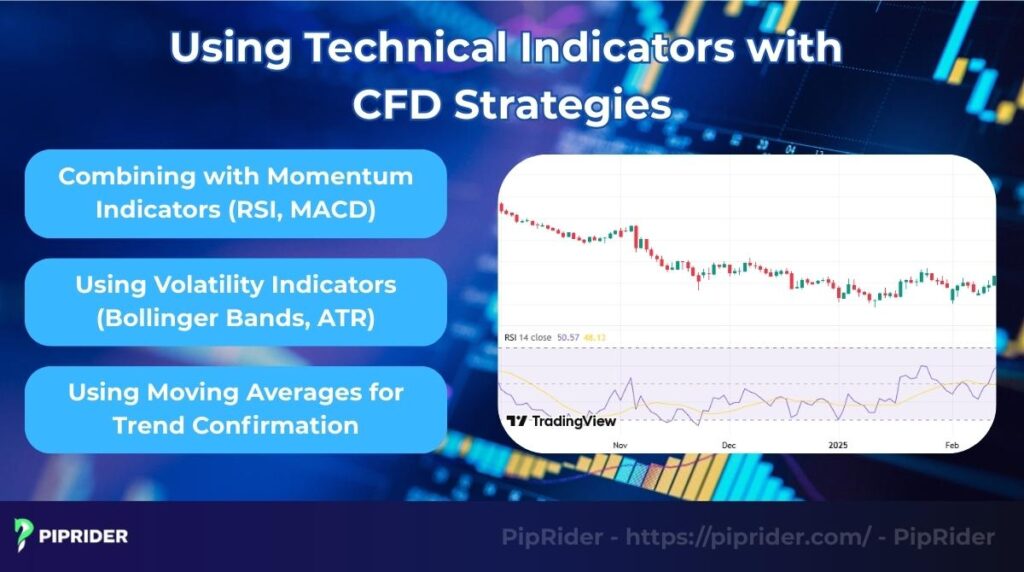
5.1. Combining with Momentum Indicators (RSI, MACD)
The combination measures the speed and strength of price movements, helping you gauge if a trend has conviction.
How to use them: We use the Relative Strength Index (RSI) to identify potential overbought or oversold conditions and, more importantly, to spot divergences that can warn of a potential trend reversal. The MACD is excellent for confirming price strength through its histogram and centerline crossovers.
Strategy fit: These are vital for Trend Following (to confirm a pullback is ending) and Mean Reversion strategies.
5.2. Using Volatility Indicators (Bollinger Bands, ATR)
These indicators measure how quiet or wild the market is, which is crucial for identifying breakout opportunities.
How to use them: Bollinger Bands are perfect for Breakout Trading; when the bands contract tightly (a “squeeze”), it often signals that a period of high market energy is imminent. The Average True Range (ATR) is our go-to tool for setting a logical stop-loss distance based on the market’s recent price movements.
Strategy fit: Bollinger Bands are the engine behind Range Trading and Mean Reversion. The ATR is a must-use tool for nearly all trading approaches.
5.3. Using Moving Averages for Trend Confirmation
Moving Averages smooth out price data to provide a clearer view of the underlying trend, acting as a powerful filter.
How to use them: A common approach in our chart analysis is to use a long-term moving average (like the 50 or 200 EMA) as a trend filter. For example, we might only consider taking long trades on a CFD if the price is trading above its 50-day EMA. They also act as dynamic price levels.
Strategy fit: They are the foundation of Trend Following and Position Trading.
5.4. Advanced Technical Confluence: Bollinger Bands, MACD, and Fibonacci
Professional traders never rely on a single technical indicator. The highest probability CFD setups occur when multiple advanced tools confirm the same narrative—a concept known as Confluence.
How to use them:
- The Setup Sequence: A pro trader looks for a specific alignment. First, a Bollinger Band Squeeze indicates volatility is at historical lows. Second, the price pulls back precisely into the Fibonacci “Golden Pocket” (the zone between the 50% and 61.8% retracement levels) that aligns with a major support zone.
- The Trigger: Finally, as price hits this zone, the MACD Histogram or RSI forms a bullish divergence (price makes a lower low, but the indicator makes a higher low), signaling that selling pressure is exhausted.
Strategy fit: This 3-step confluence is the holy grail for advanced Swing Trading and Mean Reversion, allowing for exceptionally tight Stop-Loss placement and Risk-to-Reward ratios often exceeding 1:4.
Practical Example (Apple AAPL – Daily Chart):
- The Setup: Price pulls back to $175, creating a 3-point confluence: 1) The 61.8% Fibonacci “Golden Pocket”, 2) A historical Order Block, and 3) A bullish MACD divergence.
- Execution: Enter Long at $175.50.
- Stop-Loss: $173.00 (below the 78.6% invalidation level).
- Take-Profit: $185.00 (previous swing high).
- Risk/Reward: ~1:3.8.
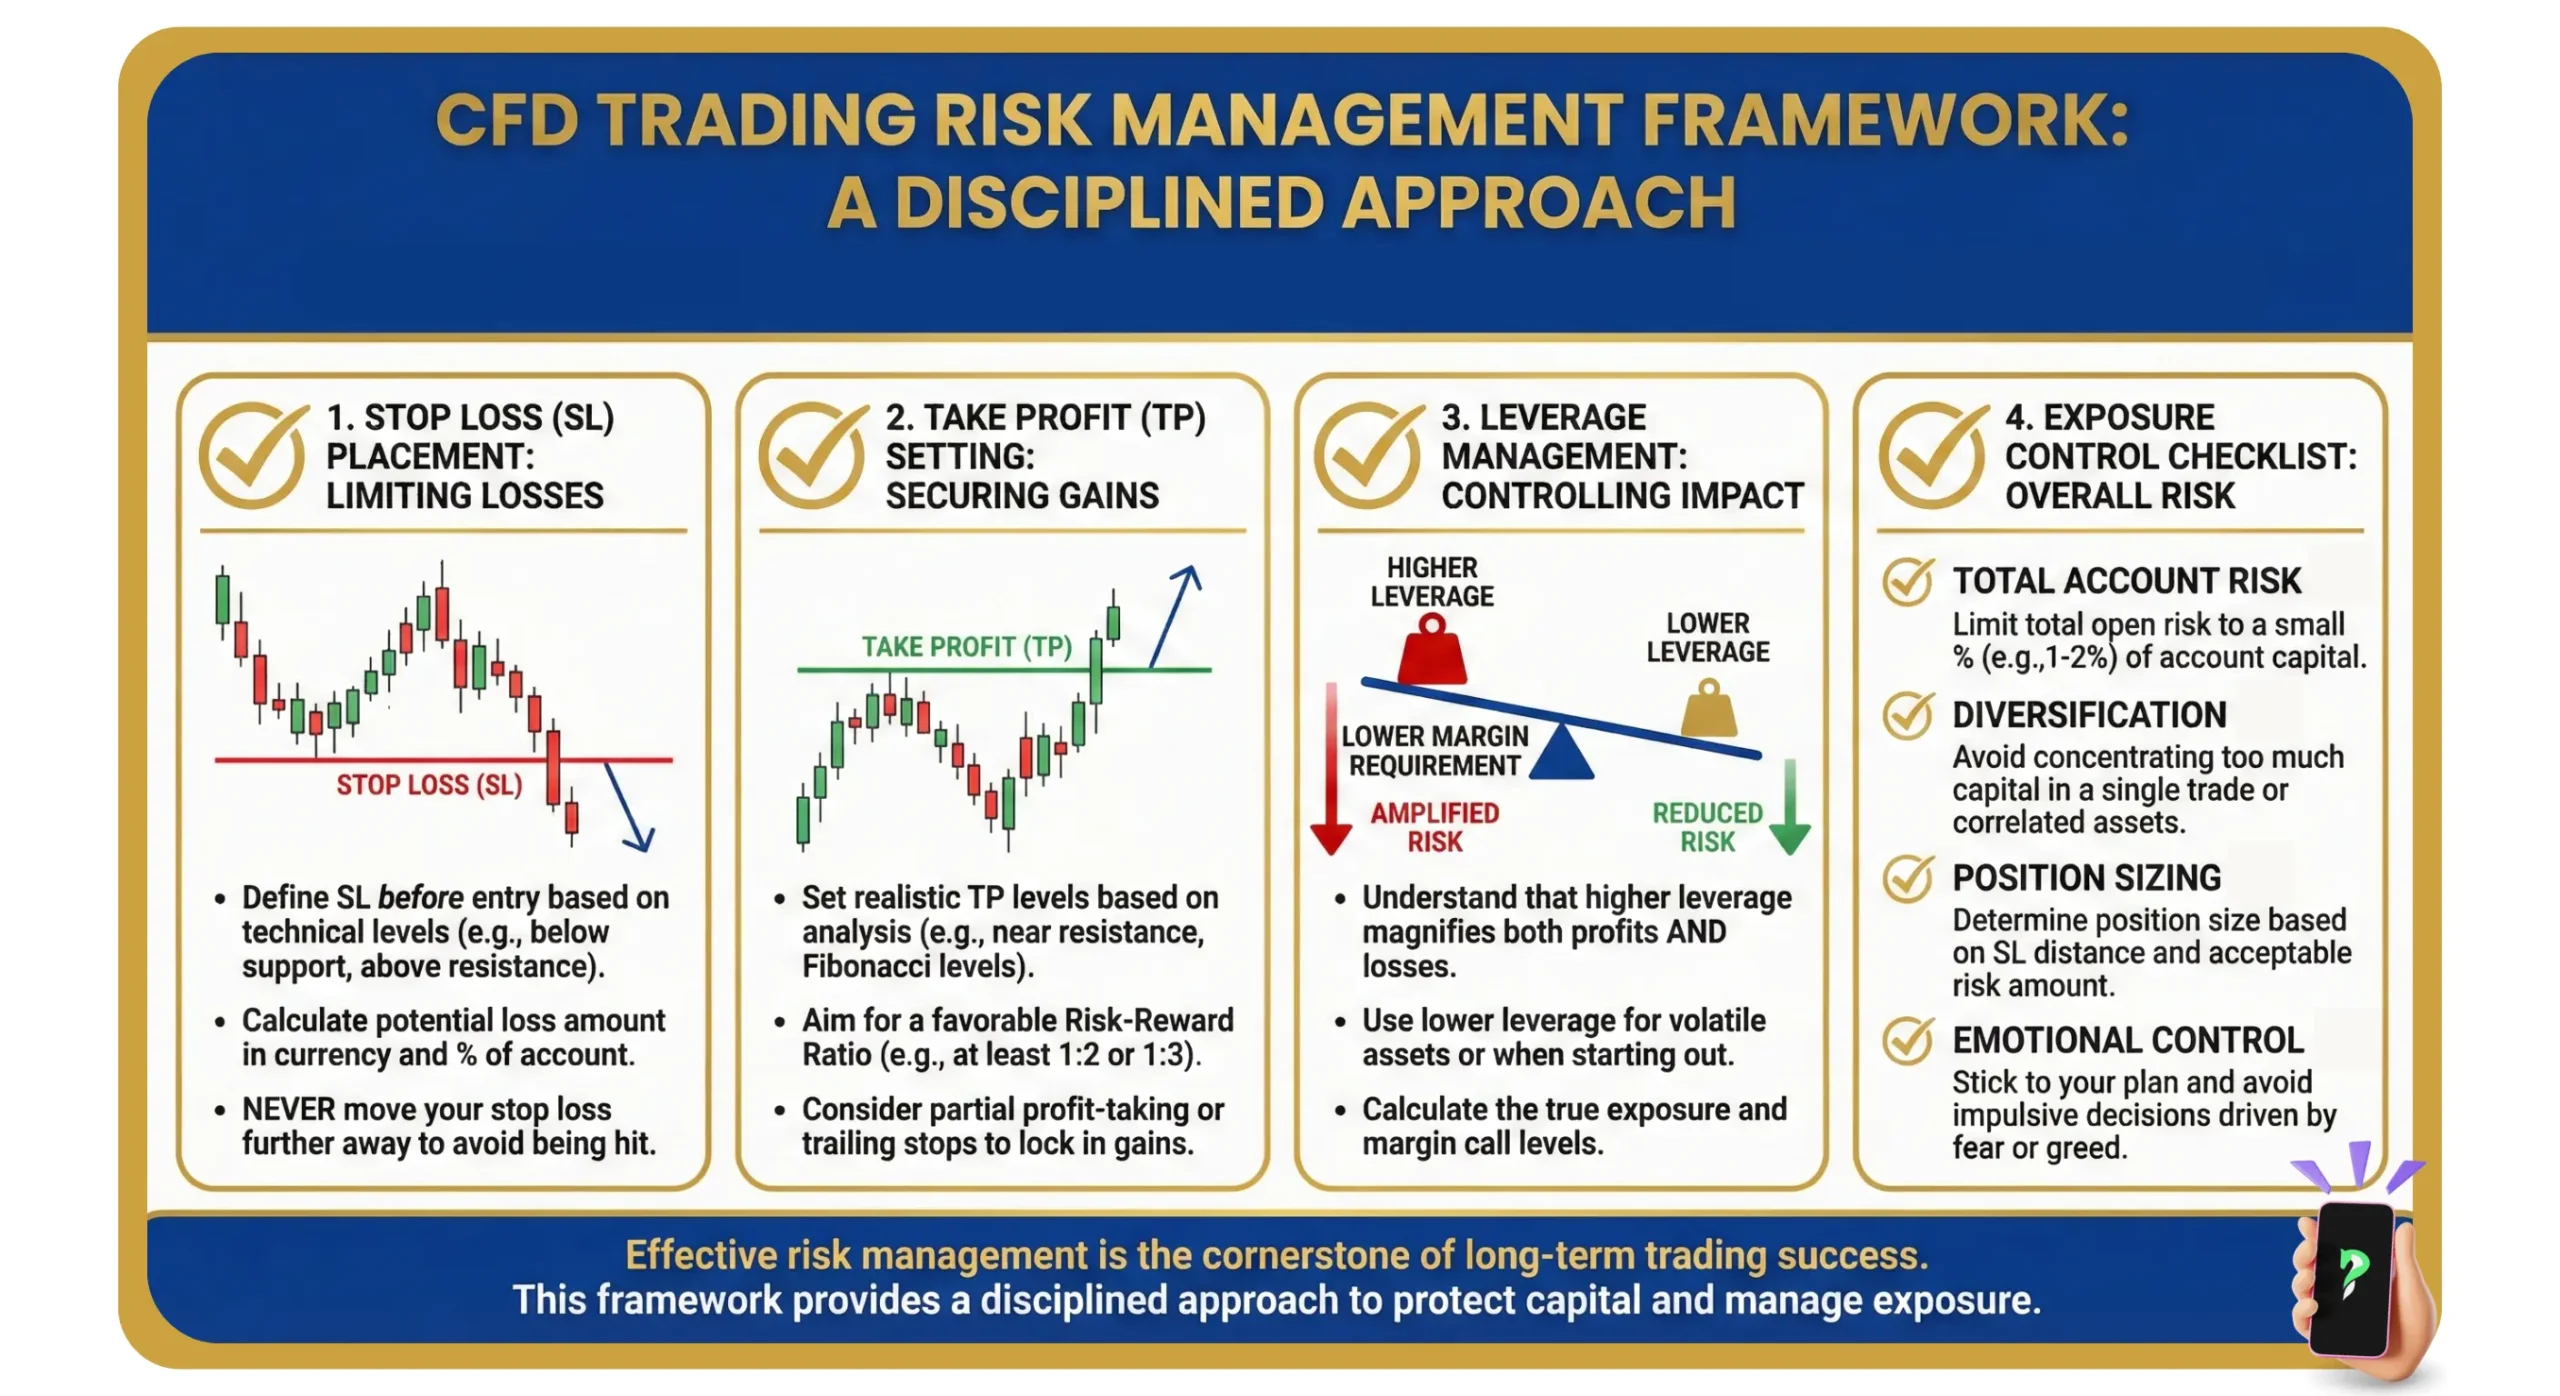
6. Advanced Risk Management: The Mathematics of Survival
In CFD trading, your strategy determines when you enter the market, but your risk management determines if you survive it. Professional traders do not guess their trade size; they calculate it. A robust system is built on mathematical execution, not emotion.
6.1. Dynamic Position Sizing (The Core of Capital Protection)
Never trade a fixed lot size. Your position size must dynamically adjust based on the distance to your Stop-Loss to ensure you strictly risk only 1% to 2% of your account per trade.
- Practical Example: You have a $10,000 account and risk 1% ($100). If your technical Stop-Loss on a Gold CFD is $50 away from your entry, your maximum position size is $2 per point. If the Stop-Loss needs to be wider ($100 away), your position size automatically halves to $1 per point. This keeps your monetary risk constant regardless of market volatility.
6.2. Volatility-Based Stop-Loss and Take-Profit
Amateurs place Stop-Losses based on how much money they are willing to lose. Professionals place them based on market structure and volatility. Mastering how to calculate stop loss effectively is a critical skill for maintaining capital longevity in high-leverage environments.
- The ATR Method: Use the Average True Range (ATR) indicator to measure daily market noise. A professional Stop-Loss is often placed at a structural low minus 1.5 × ATR. This prevents you from getting “whipsawed” out of a good trade by normal market fluctuations.
- Take-Profit Scaling: Instead of a single Take-Profit, use a “Scale-Out” approach. Close 50% of your CFD position at a 1:1 Risk/Reward level to secure capital, move your Stop-Loss to breakeven, and let the remaining 50% ride the trend toward major liquidity zones.
6.3. Asymmetric Risk/Reward Ratio (R:R) and Expectancy
A high win rate is irrelevant if your losses are larger than your winners.
- The Golden Rule: Always demand an asymmetric R:R of at least 1:2. This means risking $1 to make $2. With a 1:2 R:R, you only need to be right 34% of the time to break even.
- Trading Expectancy: Professionals track their system’s mathematical expectancy. If this number is positive, you have a verified edge. If it’s negative, no amount of leverage will save your account.
6.4. Portfolio-Level Mitigation (Hedging)
As discussed in Section 2.5, when you hold multiple CFD positions, risk isn’t just about individual stop-losses. It’s about systemic exposure.
- Correlation Checks: Ensure you aren’t inadvertently doubling your risk (e.g., going Long on EUR/USD and Short on USD/CHF is essentially betting against the US Dollar twice).
- Proxy Hedging: If you are heavily exposed to long equities but fear a sudden macroeconomic shock, shorting a broad market index CFD (like the S&P 500) acts as an insurance policy, neutralizing your directional bias without forcing you to liquidate your individual stock picks.
7. Trading Psychology: The Invisible Edge in CFD Markets
In the highly leveraged world of CFDs, your strategy dictates when to trade, but your psychology dictates if you survive. Leverage amplifies not only your financial exposure but also your emotional extremes. Professional traders understand that conquering their own minds is more critical than conquering the charts.
Here are the most common psychological traps in CFD trading and how professionals neutralize them:
- FOMO (Fear of Missing Out) & Chasing the Market:
- The Trap: Seeing a massive green candle and buying at the very top out of fear that you are missing a huge move. This is driven by greed and impatience.
- The Pro Fix: Accept that the market provides endless opportunities. If a setup misses your precise entry criteria, let it go. Professionals say: “Cash is also a position.”
- Loss Aversion and “Moving the Stop-Loss”:
- The Trap: The human brain hates losing. When a trade goes against them, amateurs will often widen or delete their Stop-Loss, hoping the price will “turn around.” This turns a small, calculated paper cut into a catastrophic blown account.
- The Pro Fix: Treat a Stop-Loss execution as a normal business expense, not a personal failure. Once a trade is executed, the Stop-Loss is absolute.
- Revenge Trading (Overtrading):
- The Trap: Immediately opening a new, often larger position after a loss to “win the money back.” This is trading out of anger, completely ignoring the trading plan and technical setups.
- The Pro Fix: Implement a “Daily Drawdown Limit.” If you hit two consecutive full losses in a day, close the trading terminal and walk away. The market will still be there tomorrow.
8. FAQs
9. Summary
CFD trading strategies are the cornerstone of optimizing profit and controlling risk. From trend following and breakout trading to scalping and hedging, each approach has unique strengths and weaknesses. Ultimately, the key to sustainable success is not finding a “perfect” strategy, but choosing a method that aligns with your personal trading style. Combining that approach with a disciplined execution and a strict protective framework is what separates consistent traders from the crowd.
Infographic Section
-
11 Best CFD Trading Strategies -
CFD Trading Risk Management -
Step by Step to Trading Strategy Process