
The Fibonacci retracement is a popular technical analysis tool that helps identify potential support and resistance zones. Based on key ratios from the Fibonacci sequence, it helps traders pinpoint where a price correction within a trend is likely to pause or reverse. This guide will cover everything from drawing the levels accurately on platforms like MT4 to integrating them into a practical trading strategy.
Key Takeaways
- Fibonacci Retracement is a tool that helps identify potential support and resistance zones.
- It’s considered a key technical indicator for trend-based strategies.
- It uses Fibonacci ratios (e.g., 38.2%, 61.8%) to predict price pauses or reversals.
- This tool works most effectively in clear, trending markets.
- It should be combined with other indicators (like RSI) for increased accuracy.
- Avoid common mistakes like picking the wrong swing points or relying on Fibonacci alone.
1. What is Fibonacci retracement? Why does it matter in forex?
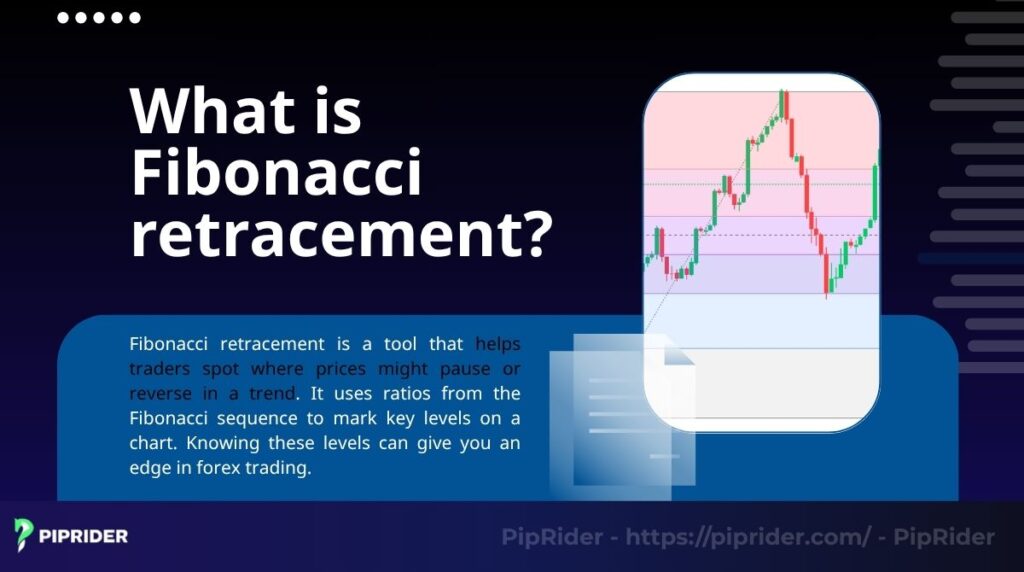
Fibonacci retracement is a technical analysis tool that helps traders spot where prices might pause or reverse in a trend. It uses ratios from the Fibonacci sequence to mark key levels on a chart (Investopedia, n.d.). Knowing these levels can give you an edge in forex trading.
Traders use Fibonacci retracement levels to identify important price points and price areas where an asset may pause, reverse direction, or maintain its movement within an ongoing trend. These levels are derived from the Fibonacci sequence.
1.1. Historical Background
The origins of the Fibonacci sequence trace back to ancient mathematics, first documented in Indian and Arabic cultures before being brought to Western Europe in the 13th century by Leonardo of Pisa (Fibonacci, 1202/2002) better known as Fibonacci.
In his influential work Liber Abaci, he introduced the sequence to a wider audience. This book also championed the adoption of the more practical Hindu-Arabic numeral system over Roman numerals.
Fibonacci’s contributions have extended far beyond pure mathematics, leaving an impact on science, nature, architecture, and finance. Its close link to the golden ratio, which can be observed in patterns from plant growth to market analysis, has made it a valuable concept across many disciplines.
1.2. Common reversal levels with fibonacci retracement
Fibonacci retracement levels are drawn at specific percentages: 23.6%, 38.2%, 50%, 61.8%, and 78.6% (Fibonacci, 1202/2002). These levels come from a number sequence discovered by Leonardo Pisano, an Italian mathematician. It’s remarkable how an ancient mathematical concept now influences crowd psychology and trading behavior in modern markets.
The sequence starts with 0, 1, 1, 2, 3, 5, 8, and so on, where each number is the sum of the two before it. Dividing these numbers gives ratios like 61.8% (the golden ratio) and 38.2%, which traders use to predict price moves. These ratios often align with where traders place entry orders.
1.3. Why Fibonacci matters in forex
In forex, the Fibonacci helps you find support (where prices might stop falling) or resistance (where prices might stop rising). For example, in an uptrend, prices often pull back to a Fibonacci level before climbing again. We’ve seen this happen time and again on pairs like EUR/USD, where a pullback to the 61.8% level often precedes the next leg up in a strong direction.
These levels work because many traders watch them, creating a self-fulfilling effect. When enough people expect a price to bounce at 61.8%, it often does! This tool is especially useful in trending markets, where clear highs and lows make it easier to spot these levels of resistance.
Summary: This is a powerful tool for spotting key price levels in forex trading. Its roots in the Fibonacci sequence make it unique, and its ability to highlight support and resistance is why traders love it. By understanding these basics, you’re ready to explore how to use this tool in your trades.
2. How does Fibonacci retracement work in forex trading?
Ever wondered how the Fibonacci pinpoints those magic price levels? It’s all about math and market behavior working together. Let’s break down how this tool functions to help you trade smarter.
2.1. Calculating Fibonacci levels
To understand how Fibonacci retracement levels work, you start by finding a trend’s swing high (peak) and swing low (trough). For an uptrend, say EUR/USD moves from a low of 1.1000 to a high of 1.1500.
Here is how the 61.8% level is calculated:
Step 1: Calculate the price range
| Price Range = Swing High – Swing Low Price Range = 1.1500 – 1.1000 = 0.0500 |
Step 2: Calculate the 61.8% level
| 61.8% Level = Swing High – (Price Range × 0.618) 61.8% Level = 1.1500 – (0.0500 × 0.618) = 1.1191 |
This becomes a potential support level where prices might bounce. Most trading platforms, like TradingView, do these calculations automatically, saving you time.
2.2. Market psychology behind Fibonacci
The power of these levels isn’t mystical; it’s rooted in crowd psychology. When thousands of traders worldwide place pending orders around the 50% or 61.8% thresholds, they inadvertently create a self-fulfilling prophecy.

This collective action is the core explanation for how the Fibonacci works as a practical tool for gauging potential reaction points, especially on major pairs like USD/JPY. This phenomenon can also lead to confirmation bias, where traders only see the signals that support their existing beliefs.
In a clear downtrend, these Fibonacci levels become evident resistance zones (Investopedia, n.d.). If prices rally back to the 38.2% level, many traders will see it as a potential resistance opportunity to sell, expecting the downtrend to resume. This very herd behavior reinforces the role of Fibonacci as a reliable guide in trending markets.
Summary: This tool works by using mathematical ratios to highlight where prices might pause or reverse. By identifying swing points and understanding trader psychology, you can use these levels to plan your trades. Its power lies in its simplicity and widespread use, making it a must-know for forex traders.
3. Steps to use the Fibonacci retracement tool on trading platform
Mastering how to use the Fibonacci retracement tool on trading platforms is a fundamental skill. The process is quite intuitive, and popular platforms like MT4 or TradingView have this tool readily available. Let’s walk through the specific steps to set it up so you can apply it accurately.
3.1. Step-by-step guide to applying the tool
Applying the Fibonacci retracement tool involves a simple, logical process. Here’s a breakdown of the steps:
Step 1: Identify the Trend and Key Points
- Open your trading platform (e.g., MT4, TradingView) and select a currency pair with a clear trend.
- For an uptrend, locate the significant Swing Low (the starting point of the move) and the Swing High (the peak of the move).
- For a downtrend, locate the Swing High and the Swing Low.
Step 2: Select and Apply the Tool
- Choose the Fibonacci Retracement tool from your platform’s toolbar.
- For an uptrend, click on the Swing Low, then drag your cursor and release it on the Swing High.
- For a downtrend, click on the Swing High, then drag and release on the Swing Low.
Step 3: Analyze the Plotted Levels
- The platform will automatically draw the key Fibonacci retracement levels (e.g., 23.6%, 38.2%, 50%, 61.8%) on the chart between the swing points you selected.
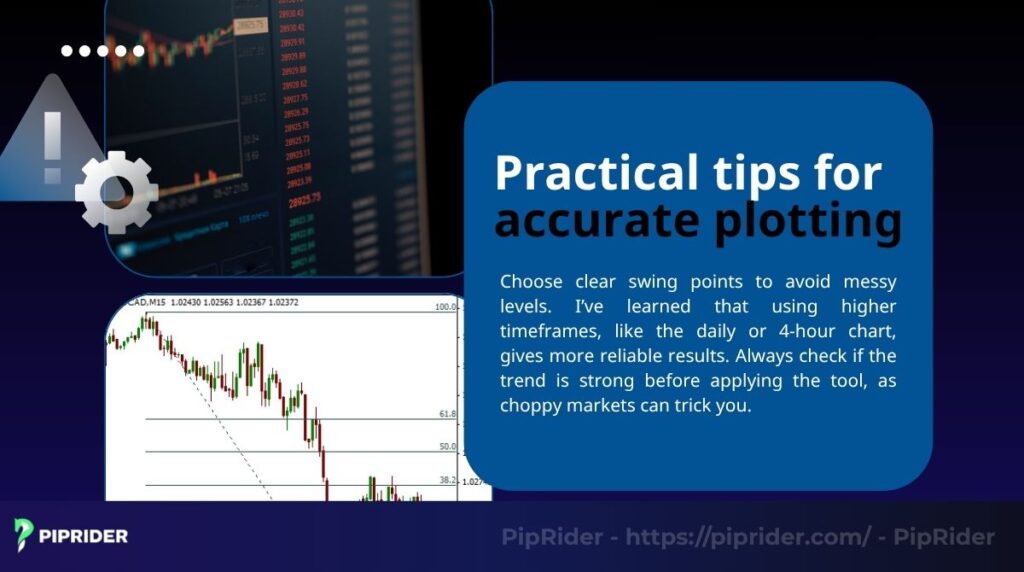
3.2. Practical tips for accurate plotting
Choose clear swing points to avoid messy levels. Using higher timeframes, like the daily or 4-hour chart, gives more reliable results. Always check if the trend is strong before applying the tool, as choppy markets can trick you.
Once plotted, watch how prices react at these levels. In an uptrend, the 50% level can serve as a support point where prices tend to rebound. Pair Fibonacci retracement with a candlestick pattern, like a bullish pin bar, to provide bullish confirmation.
Summary: Learning how to use the Fibonacci tool is straightforward and can sharpen your trading decisions. By plotting levels on platforms like MT4, you can spot key areas for entries and exits. Use a demo account to practice and become proficient with this tool, allowing for more accurate trading.
Read more:
- Fractal Trading: A Breakout Strategy Guide For Forex Traders
- Andrews Pitchfork: A simple guide to mastering this tool
4. How to interpret Fibonacci retracement levels to improve your trades
Reading Fibonacci retracement levels is like learning to spot signals in a busy market. Each level tells a story about where prices might pause or turn. Let’s explore how to interpret these levels to make sharper trading choices.
4.1. What each Fibonacci level means
Each Fibonacci retracement level has a unique role in predicting price action. The 23.6% level indicates shallow retracements, typically observed in strong trends where price declines are minimal. The 38.2% and 50% levels are common spots for prices to bounce in a healthy trend.
The 61.8% level is widely regarded by traders as an important point for potential reversals. This level is often used to signal deeper retracements in a trend. Larger pullbacks, such as the 78.6% level, can indicate a possible shift in the direction. We’ve seen prices respect the 61.8% level time and again, especially on GBP/USD daily charts.
4.2. Watching price behavior
To read Fibonacci retracement levels, observe how prices act near them. In an uptrend, prices might drop to the 38.2% level and form a bullish candlestick, signaling a buy opportunity. In a downtrend, a rally to the 50% level could stall, hinting at renewed bearish momentum.
Look for extra clues, like support or resistance zones lining up with Fibonacci levels. We often check if a moving average sits near the 61.8% level for added confidence. These confluences make your trades more reliable.
Summary: Knowing how to interpret Fibonacci retracement levels can transform your trading by highlighting key price zones. Each level 23.6%, 38.2%, 50%, 61.8%, or 78.6% offers clues about potential reversals or continuations. Use these insights alongside other indicators to enhance the accuracy of your trades.
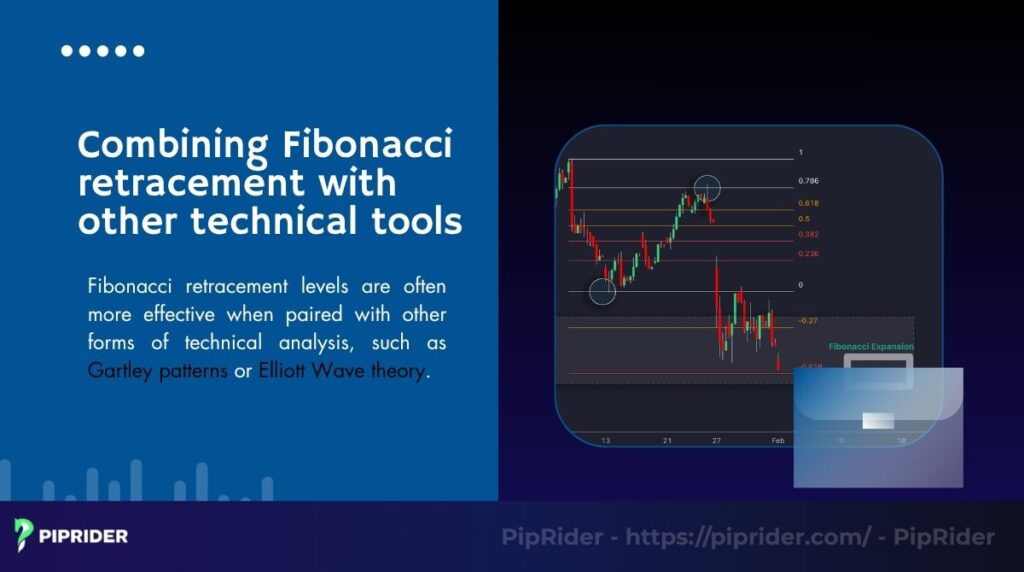
5. Combining the Fibonacci with other technical tools
Fibonacci retracement levels are often more effective when paired with other technical indicators, such as Gartley patterns or Elliott Wave theory.
The Gartley pattern, a well-known harmonic formation, employs Fibonacci ratios to define its four legs: X–A, A–B, B–C, and C–D. Typically, the D-point aligns with the 78.6% retracement level, presenting a potential trade entry (Investopedia, 2005).
Traders typically verify the confluence of Fibonacci ratios before committing to a position, set stop-loss levels beyond the X-point, and use Fibonacci extension levels to determine price targets.
Elliott Wave theory also relies heavily on Fibonacci measurements to anticipate market phases and identify both impulse and corrective structures. Retracement levels are particularly useful for locating pullback areas during Wave 2 and Wave 4, while Fibonacci extensions assist in projecting targets for Wave 3 and Wave C.
By combining Fibonacci tools with Gartley patterns, Elliott Wave analysis, trend lines, and momentum indicators like the Moving Average Convergence Divergence (MACD) and Relative Strength Index (RSI), traders can develop a disciplined, rule-driven framework for market analysis and decision-making.
6. Frequent errors to watch out for when applying Fibonacci retracement
Fibonacci is a fantastic tool, but it’s easy to trip up if you’re not careful. We made several mistakes when we first began, and we are eager to share tips on how to steer clear of them. Here’s what to watch out for to keep your trading on track.
6.1. Picking the wrong swing points
Choosing incorrect swing highs and lows can mess up your Fibonacci levels. If you pick minor price wiggles instead of clear peaks and troughs, your levels won’t match market behavior. We learned this lesson from a losing trade on a choppy USD/CAD chart. Choosing insignificant swing points rendered the Fibonacci levels meaningless and led directly to a false entry signal.
Always select obvious swing points on higher timeframes, like the 4-hour or daily chart. This ensures your levels align with where most traders are looking. Double-check your chart to avoid this rookie mistake.
6.2. Relying only on Fibonacci
Using Fibonacci retracement levels alone is like driving with one eye closed; it’s risky. Prices don’t always respect these levels, especially without confirmation. We’ve seen trades fail when we ignored other false signals like candlesticks.
Combine Fibonacci with indicators such as RSI or moving averages to create more reliable trading setups. For example, a 50% level with a bullish candle and oversold RSI is far more reliable. This combo saves you from jumping into weak trades.
6.3. Ignoring market conditions
Fibonacci works best in trending markets, but it can mislead you in choppy ones. We once plotted levels on EUR/GBP during a sideways market and got burned by false signals. Choppy prices don’t respect Fibonacci as much as clear trends do.
Determine whether the market is in an uptrend with rising highs and lows or in a downtrend with falling highs and lows. If the price is moving without direction, avoid using Fibonacci and wait for a more defined setup.
6.4. Expecting perfect reversals
Assuming prices will always reverse exactly at Fibonacci levels sets you up for disappointment. Sometimes prices blow past a level or only pause briefly. We felt that sting when a trade on AUD/JPY sliced right through the 50% level we were watching, instead of reversing as anticipated.
Treat Fibonacci levels as zones, not exact lines, and use stop-losses to manage risk management. For example, in an uptrend, set a stop-loss slightly below the 61.8% level to guard against sudden price declines. This keeps losses small.
Table: Dos and don’ts of this tool:
| Do | Don’t |
| Use clear swing points on higher timeframes | Pick minor price wiggles |
| Combine with RSI or candlestick patterns | Rely only on Fibonacci levels |
| Apply in trending markets | Use in choppy, sideways markets |
| Treat levels as zones with stop-losses | Expect exact reversals at each level |
Summary: Avoiding common mistakes with the Fibonacci can save you from costly errors and boost your trading success. Pick clear swing points, use other tools for confirmation, check market conditions, and manage expectations. These tips will help you use Fibonacci like a pro and trade with confidence.
7. FAQs: Your questions about Fibonacci retracement answered
8. Conclusion
Fibonacci retracement works best for spotting entry and exit levels during market trends. Pairing it with tools like RSI or candlestick patterns, as we’ve done on pairs like EUR/USD, can lead to winning trades. The key is to practice testing your setups on a demo account to build confidence without risking real money.
Mastering the Fibonacci is more than just plotting lines on a chart; it’s the process of learning to interpret market behavior at key price zones. Through consistent practice and combining it with other technical analysis, you will gradually develop the ability to identify trading opportunities with a higher probability of success.
At PipRider, our blog is packed with resources to support your journey, whether you’re exploring our “Beginner” section.


