Do you have a trading strategy idea but are afraid to risk real money to see if it works? The solution is backtesting.
Backtesting simulates your trading rules against historical data to reveal how they would have performed in the past. It is the only way to prove your strategy has a statistical edge before you risk a single dollar. This guide explains exactly how to backtest trading strategy step-by-step, from manual testing on charts to using automated software, bridging the gap between a theoretical idea and a proven system.
Key Takeaways
- Backtesting is simulating your trading strategy on historical data to see if it would have worked.
- It allows traders to validate their strategy and measure risk before using real capital.
- Two Methods: Manual backtesting (using the chart “Bar Replay”) or automated backtesting (using software like MetaTrader).
- A backtest must be honest. Avoid common mistakes like “overfitting” (curve-fitting) and “survivorship bias.”
- After a successful backtest, you must paper trade (forward test) your trading strategy in a live market simulation.
1. What Is Backtesting in Trading?
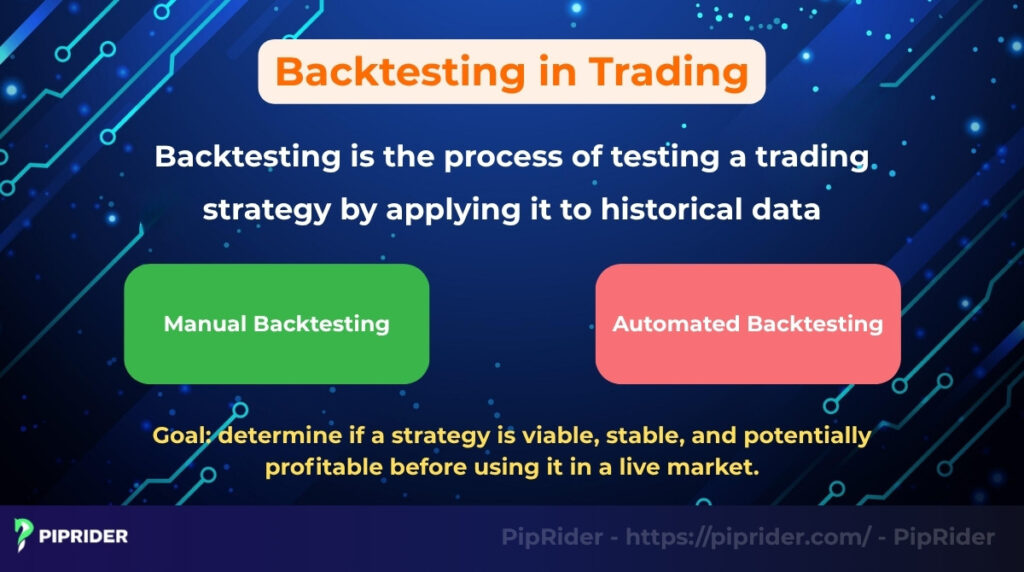
Backtesting is the process of testing a trading strategy by applying it to historical data to see how the strategy would have performed in the past without risking any actual money. This process, also known as “strategy testing” or “historical simulation,” is a fundamental part of developing any trading strategy.
The primary goal of backtesting is to determine if a strategy is viable, stable, and potentially profitable before you use it in a live market. According to financial education resources like Investopedia, backtesting is a vital step for assessing trading ideas, helping to reduce risk and build confidence in a trading plan.
Key Points:
- Backtesting helps you evaluate a trading strategy’s potential risk, profitability, and reliability.
- There are two main types: manual backtesting (testing by hand) and automated backtesting (using software).
- Good past results do not guarantee future success. However, backtesting is a necessary first step in developing a sound risk management system.
2. Why Backtesting Matters
Backtesting is not just an optional step; it is essential for developing a serious trading plan. It provides three critical advantages before you risk any real money.
2.1. Validating Strategy Performance
Backtesting allows you to check if your strategy works consistently across different market conditions. A trading strategy might look great during one-sided market trends (like a strong uptrend), but backtesting will quickly show you how it really performs during a market crash, a period of high volatility, or a flat, sideways market. This tests it against all market conditions.
2.2. Measuring Risk and Return
This is the most important reason to backtest. It forces you to move from “I think this is a good strategy” to “I know this strategy’s numbers.” It helps you calculate the key performance metrics of your trading strategy, such as its:
- Profit Factor
- Maximum Drawdown (the biggest loss from a peak)
- Win Rate
- Risk-to-Reward Ratio
This data-driven approach complements scenario analysis, which helps prepare a trader for risks not found in the historical data and reinforces the need to backtesting strict risk rules to protect capital.
2.3. Reducing Emotional Bias
Backtesting is based on data, not feelings. When you trade a live account, it is easy to get scared by a loss or greedy during a win.
Backtesting removes the emotional factor from your evaluation. This objective data analysis lets you see if the strategy is good or bad based purely on its historical performance. This data-driven proof from backtesting is what builds the real, unshakable confidence you need to follow your rules in a live, stressful trading environment.
3. How to Backtest Trading Strategy: Step-by-Step
Here is a simple, step-by-step process for how to backtest trading strategy correctly. Following these steps helps ensure your results are reliable.
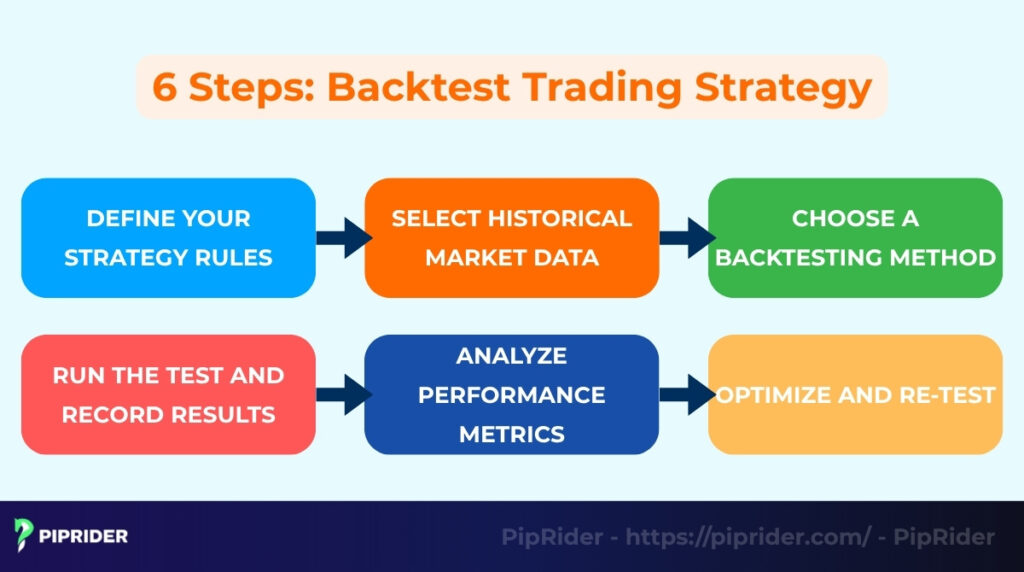
3.1. Step 1: Define Your Strategy Rules
First, you must define your trading strategy with 100% clarity. You cannot have any “maybe” rules. Your trading logic must be exact. Write down the exact trading rules for every part of the trade:
- Entry Signal: What exactly must happen to make you buy or sell? (e.g., “Buy when the 10-period RSI is below 30 and the price crosses above the 20-period Moving Average.”)
- Exit Signal (Take Profit): What is your profit target? (e.g., Fixed 20 pips, or 2x the risk distance).
- Exit Signal (Stop-Loss): What is your non-negotiable stop-loss price? (e.g., Below the recent swing low or a fixed ATR multiple).
- Position Sizing (Risk Management): How much capital will you risk on each trade? You must define the Risk % per trade (e.g., 1% of equity), Lot Size rules, and the Maximum concurrent positions allowed. This ensures your backtest reflects real-world account growth and drawdowns.
3.2. Step 2: Select Historical Market Data
Next, you need high-quality historical data to test your rules against. This data must include the Open, High, Low, and Close (OHLC) prices for each period.
- For Stock Traders: Ensure your data includes accurate Trading Volume.
- For Forex/Crypto Traders: Since these are decentralized markets, “Volume” is usually Tick Volume (a proxy for activity).
- ⚠️ Critical Warning: Tick volume varies significantly depending on the broker or data feed. You must use a consistent data source (e.g., stick to one specific broker’s feed) throughout your entire backtest. Mixing data from different brokers will corrupt your results.
3.3. Step 3: Choose a Backtesting Method
You have two main ways to conduct the test:
- Manual Backtesting: Where you do the work by hand. You use a charting platform (like TradingView) and go back in time, then move forward one candle at a time (using “Bar Replay”). Looking for your signals and manually record each trade in a spreadsheet.
- Automated Backtesting: Where you use software to do the work. You write a script (an “Expert Advisor” or “strategy”) for a platform like MetaTrader (MT4/MT5), QuantConnect, or Amibroker. The software then runs your rules against the historical data automatically.
3.4. Step 4: Run the Test and Record Results
You must now execute the test. Go through your historical data (e.g., 5 years of daily charts) and apply the rules.
For every single trade the system generates, you must record the backtesting results in a log or spreadsheet. This includes the entry/exit dates, the profit or loss of the trade, the running drawdown, and the win/loss status.
3.5. Step 5: Analyze Performance Metrics
When the backtesting is finished, it’s time to analyze the data. You must look at several key performance metrics to see if the strategy is actually good:
- Total return
- Sharpe ratio
- Profit factor
- Max drawdown
- Average win/loss
3.6. Step 6: Optimize and Re-Test
Almost no trading strategy works perfectly the first time. The final step is to optimize (or “tweak”) your rules to improve performance. You might change the indicator settings (e.g., try a 25-period MA instead of 20) or fine-tune your stop-loss size.
⚠️ Warning: Be very careful to avoid “Overfitting” (forcing the strategy to fit past data perfectly). A strategy that is over-optimized will look like a holy grail on paper but will fail in live markets.
Next Step: Once your backtest shows stable, positive results, do not trade yet. You must move to Paper Trading (Forward Testing) to validate execution in real-time (see Section 10 for details).
4. Manual vs. Automated Backtesting
When learning how to backtest trading strategy, you have two main methods. Each has clear pros and cons.
| Feature | Manual Backtesting | Automated Backtesting |
|---|---|---|
| Description | Trader manually checks charts, candle by candle (e.g., using a “Bar Replay” tool), and records results in a spreadsheet. | Trader uses software/code (e.g., MetaTrader, QuantConnect) to run the strategy automatically over historical data. |
| Primary Goal | To build chart-reading skills and gain a deep, intuitive feel for the strategy’s behavior. | To objectively assess profitability and optimize parameters based on massive historical data. |
| Pros | Builds Intuition and chart recognition skills; provides deep understanding of market context. | Very Fast (tests years of data in minutes); 100% Objective (removes emotional bias). |
| Cons | Extremely Time-Consuming; Results can be easily affected by the trader’s bias (e.g., skipping losing trades). | Requires programming skills (or software cost); Vulnerable to overfitting (curve-fitting to past data). |
In summary, most traders start with manual backtesting to learn and build confidence in their strategy. They then move to automated backtesting to validate the idea quickly and objectively across large amounts of data.
5. Key Metrics to Evaluate in Backtesting
After you finish your backtest, you will have a lot of data. These key metrics are the most important ones to analyze. They tell you if the strategy is profitable, stable, and worth the risk.
| Metric | Meaning / Purpose | Rule of Thumb (Context Dependent) |
|---|---|---|
| Win Rate | The percentage of profitable trades. High win rate often means lower risk-reward ratio, and vice versa. | Above 40-50% is typical for swing trading. Trend following systems may have lower win rates (30-40%) but huge wins. |
| Profit Factor | Gross Profit divided by Gross Loss. It answers: “For every $1 lost, how many dollars were made?” | > 1.5 is healthy. Below 1.0 is a losing strategy. However, extremely high values (> 3.0) may indicate overfitting. |
| Max Drawdown | The deepest percentage drop from an equity peak. Measures the “pain” of the strategy. | The lower, the better. Ideally < 20%. If it exceeds 30%, recovery becomes mathematically difficult. |
| Calmar Ratio | Annual Return ÷ Max Drawdown. Measures return relative to the risk taken to achieve it. | > 1.0 is decent; > 2.0 is excellent. Helps filter out strategies that make money but carry dangerous drawdown risks. |
| Sharpe Ratio | Return adjusted for volatility. Shows if returns are “smooth” (stable) or “bumpy” (risky). | > 1.0 is acceptable. > 2.0 is considered very good. Important for measuring consistency over time. |
| Max Consecutive Losses | The longest losing streak in the test. Crucial for testing psychological endurance. | Know your limit. Can you handle 10 losses in a row? If not, reduce risk per trade to survive this inevitable streak. |
| Average Trade | The average net profit per trade (after costs). Shows if the “edge” is strong enough. | Must cover costs. If the average trade is too small, slippage and commissions in a live market will turn the strategy into a loser. |
In summary, looking at all these metrics together, not just the total profit, is the only way to get a true, objective picture of your trading strategy’s historical performance, profitability, and risk.
6. Common Mistakes in Backtesting
A backtesting result is only useful if it is honest. Many traders make critical mistakes that make their results look much better than they really are, leading to false confidence and real losses.
Here are the most common pitfalls to avoid.
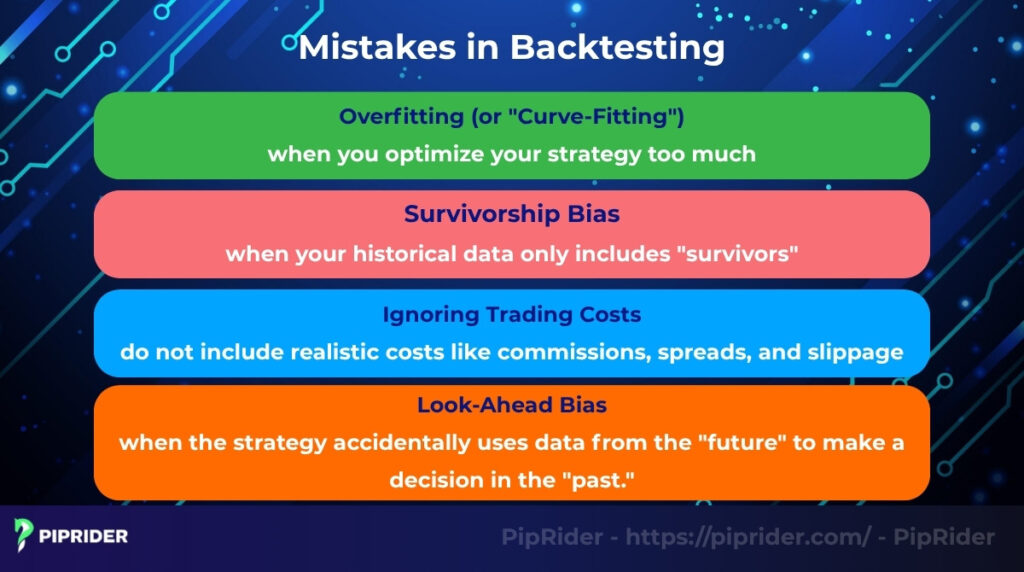
6.1. Overfitting (or “Curve-Fitting”)
Overfitting is the #1 mistake. It happens when you optimize your strategy too much until it perfectly matches the past historical data.
- The Problem: The strategy becomes so specialized to the old data that it fails to work on any new, live market data. It has learned the past, not a pattern.
- The Fix: Keep your rules simple (Occam’s Razor). If a strategy needs 10 different conditions to work, it is likely overfitted. Always use Out-of-Sample testing (Section 8) to verify results.
6.2. Survivorship Bias & Data Quality
A backtest can be flawed if the data itself is biased or incomplete. This manifests differently depending on your asset class.
- For Stock Traders (Survivorship Bias): This happens when your historical data only includes “survivors”—companies that are still trading today. The dataset ignores companies that went bankrupt or were delisted (e.g., Enron, Lehman Brothers).
- The Risk: Your results look artificially good because the “losers” were removed from history.
- For Forex Traders (Data & Spread Bias): Major currency pairs rarely disappear, so survivorship bias is less of a concern. Instead, the “silent killers” in Forex backtesting are:
- Poor Data Quality: Gaps in price history (bad tick data).
- Unrealistic Spreads: Testing with a fixed “1 pip” spread when real market spreads widen during news/rollover.
- Swaps/Rollover: Ignoring overnight holding costs.
- Session Filters: Testing a strategy 24/5 when it should only trade during London/New York sessions.
The Fix:
- For Stocks: Use a professional data provider (like Norgate Data) that includes “delisted” companies database.
- For Forex: Use high-quality Tick Data (not just M1 data) and ensure your backtesting platform accounts for variable spreads.
6.3. Ignoring Trading Costs
Forgetting to include real-world costs can make a losing strategy look profitable. This mistake involves ignoring the real trading costs from your results.
- The Problem: The backtest results will be highly exaggerated if you do not include realistic costs like commissions, spreads, and slippage (which includes execution delays). These costs add up and can turn a slightly profitable strategy into a losing one.
- The Fix: Always input realistic costs in your backtest settings. For Forex, include Spread + Commission + Swap. As a rule of thumb, assume costs are slightly higher than what your broker advertises.
6.4. Look-Ahead Bias
This subtle technical error can invalidate an entire backtest. Look-ahead bias happens when the strategy accidentally uses data from the “future” to make a decision in the “past.”
- The Problem: For example, using a stock’s closing price to decide to buy at the opening price of the same day. In reality, you would not have known the closing price at the open. This makes the strategy look perfect in the test but impossible to trade in real life.
- The Fix: Code your strategy strictly. Entries must be calculated based on the previous candle’s close (Shift +1), never the current candle’s forming price.
6.5. Cherry-Picking Data (Selection Bias)
This occurs when a trader deliberately selects a specific timeframe where the strategy performed best, while ignoring difficult periods.
- The Problem: For example, testing a trend-following strategy only during the strong 2020-2021 bull market. The results will look amazing, but the strategy will likely fail in a sideways market.
- The Fix: Always test your strategy across multiple market cycles (uptrend, downtrend, and ranging markets) to see the full picture.
6.6. Unrealistic Execution Assumptions (The “Silent Killer”)
Backtesting often assumes you get the “perfect price,” but live markets are messy. This is particularly dangerous in Forex.
- The Problem: Most basic backtests use fixed spreads and ignore slippage (price jumping) or Swap/Rollover fees (overnight costs). In reality, spreads widen during news events, and swaps can eat up all your profits in long-term trades.
- The Fix: Configure your backtest to use Variable Spreads and deduct a small commission or slippage cost from every trade to simulate real market friction.
6.7. Obsessing Over “Total Net Profit”
Many traders judge a strategy solely by how much money it made (ROI), ignoring how risky the ride was.
- The Problem: A strategy might show a 500% return, but if it had a 70% Max Drawdown at one point, it is un-tradable. You would have likely blown your account or quit in panic before realizing those profits.
- The Fix: Ignore raw profit. Instead, prioritize Risk-Adjusted Metrics like the Sharpe Ratio or Profit Factor. These tell you if the reward is worth the risk.
7. Tools and Platforms for Backtesting
Traders have a wide range of tools available for how to backtest trading strategy. These platforms range from simple, free spreadsheets for manual logging to complex software for high-speed automated testing.
7.1. TradingView
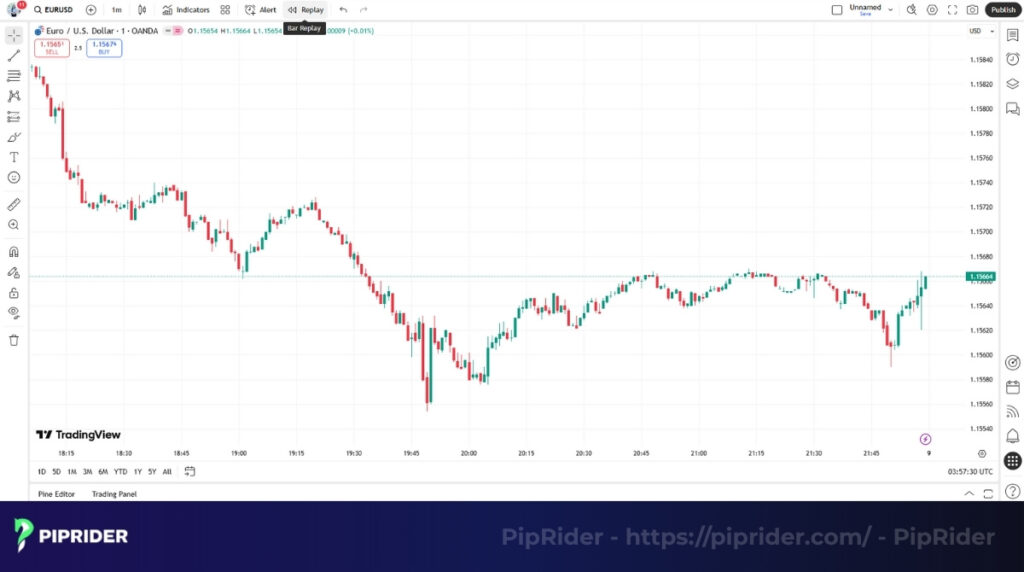
TradingView is arguably the most popular platform for modern retail traders. It is excellent for manual backtesting because of its powerful “Bar Replay” feature. This function lets you “rewind” a chart to a past date and then move forward one candle at a time, allowing you to simulate live trading without seeing the future.
TradingView also has a built-in programming language called Pine Script. This allows traders to build custom indicators and run basic automated trading strategy testers directly on the chart.
7.2. MetaTrader 4/5 (MT4/MT5)
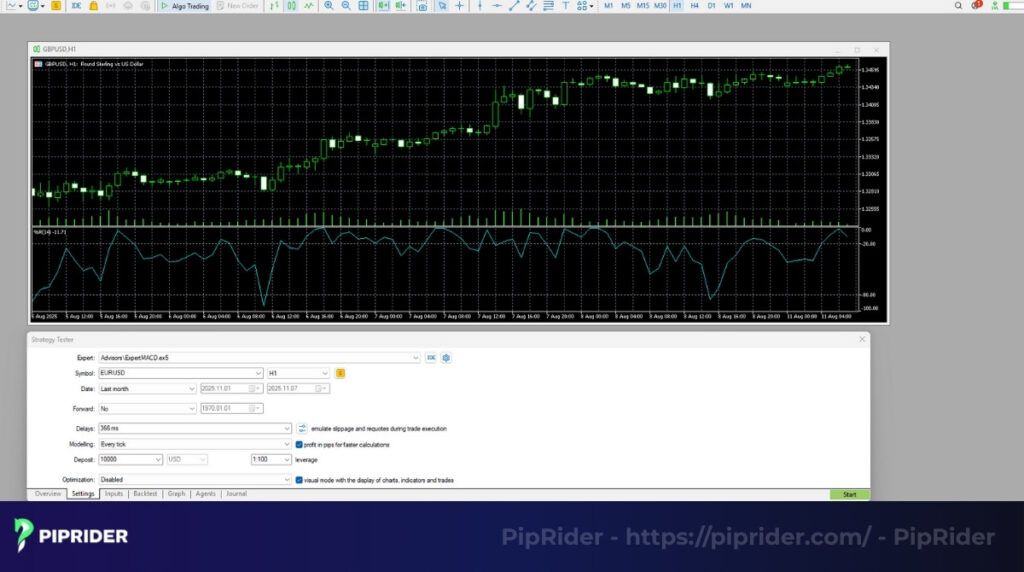
MetaTrader is an industry-standard platform, especially within the forex backtesting community. Its primary strength is the built-in “Strategy Tester.”
This feature allows you to use the MT4 strategy tester as a backtesting tool to run automated trading robots (called “Expert Advisors” or “EAs“). You can test these EAs over years of historical data in just a few minutes, making it ideal for high-speed automated testing.
7.3. QuantConnect / Amibroker / NinjaTrader
For serious algorithmic traders and system developers, platforms like QuantConnect, Amibroker, or NinjaTrader offer the next level of power.
They provide much more flexibility than MT4, including support for complex programming languages like Python and C#. These tools are designed for sophisticated portfolio-level backtesting across multiple asset classes, not just single-instrument tests.
7.4. Excel / Google Sheets
The simplest and most fundamental backtesting method involves using a basic spreadsheet. This tool is used for manual recording of your trades.
A trader will use a platform like TradingView (with Bar Replay) and then log every simulated trade (entry, exit, stop-loss) into Excel or Google Sheets.
The spreadsheet is then used to manually calculate all the key performance metrics (like win rate, profit factor, and max drawdown). This process forces the trader to fully understand their strategy’s performance.
8. How to Validate Your Backtest Results
A positive backtest is a great first step, but it is not enough. The final step is strategy validation to ensure the strategy wasn’t just “lucky” or overfitted to the past data. Validation involves testing the strategy on data it has never seen before in new market conditions. Here are three common professional methods for this process.
8.1. Out-of-Sample Testing
The most common validation method is out-of-sample testing. This approach involves splitting the historical data into two sets:
- In-Sample (Train) Data (e.g., 70%): This data (e.g., 2018-2022) is used to build and optimize the strategy.
- Out-of-Sample (Test) Data (e.g., 30%): The final, optimized strategy is then run on this “unseen” data (e.g., 2023-2025).
If the strategy still performs well on the out-of-sample data, it provides much higher confidence that the strategy is robust for new market conditions and not just overfitted.
8.2. Walk-Forward Analysis
A more advanced and powerful version is walk-forward analysis. Instead of one single split, this method involves a “rolling” test.
- Example: A strategy is optimized on 2020 data, then tested on 2021 data. The process then repeats: optimize on 2021 data, test on 2022 data. This method closely simulates how a trader might actually adapt their forex trading over time.
8.3. Monte Carlo Simulation
A final method is the Monte Carlo simulation, which is a computer-based stress test. The simulation takes all of the backtest’s recorded trades and shuffles them into thousands of different random orders.
The goal is to answer the question, “What if my worst losing streak had happened at the very beginning?” It tests the durability of the strategy and its “Max Drawdown” against a simple string of bad luck. This is an advanced form of scenario analysis.
8.4. The Ultimate Robustness Checklist
Before risking real money, subject your strategy to these four “stress tests.” A robust strategy should pass all of them without breaking.
- Multi-Market Check (The “Universal” Test): Does the strategy work on other assets? If a trend-following logic works on EUR/USD, it should theoretically show promise on correlated pairs like GBP/USD. If it works only on one specific pair but fails everywhere else, it is likely overfitted to that pair’s specific history.
- Regime Check (Market Condition Stress Test): Did the strategy survive different market moods? Isolate specific periods in your data: a strong Bull Market, a Bear Crash, and a Choppy/Sideways year. A good strategy might lose money in bad conditions, but it must not blow up the account.
- The “Slippage” Stress Test: Re-run your backtest with double the spread and add slippage costs. If the strategy turns from Profitable to Losing, your “edge” is too thin to survive real-world execution friction.
- Parameter Sensitivity (The “Stability” Test): Change your input settings slightly. For example, if you use a 50-period MA, test it with 48, 52, or 55.
- Pass (Stable Plateau): Results remain similar. This means the logic is sound.
- Fail (Overfitted Peak): Results collapse drastically. This means you just “got lucky” with the number 50.
9. Backtesting vs. Scenario Analysis
While backtesting uses real historical data to see what did happen, scenario analysis is a complementary method. It involves creating specific hypothetical situations to stress-test a trading strategy.
For example, a trader might ask, “What if the market gaps down 10% overnight?” or “What if volatility spikes by 300%?”. Scenario analysis uses these “what-if” models rather than raw past data.
The two methods complement each other. Backtesting shows what did happen. Scenario analysis explores what could happen and helps a trader understand a strategy’s breaking points.
10. Paper Trading vs. Backtesting
After you have a successful backtest, the next step is Paper Trading (also called forward testing or demo trading). These two testing methods are often confused but serve very different purposes.
| Feature | Backtesting | Paper Trading (Forward Testing) |
|---|---|---|
| Data Type | Historical data (What happened in the past). | Real-Time (live) market data in a demo account. |
| Primary Purpose | To test an idea and quickly assess if a strategy’s rules are historically viable. | To verify real-world execution and trader discipline before risking real capital. |
| Speed | Fast. Can test years of data in minutes or hours. | Slow. Must wait for signals to occur in real-time (e.g., one month to test one month). |
| Use Case | Initial strategy development and mathematical optimization. | Final evaluation of the strategy and the trader’s execution skills. |
In summary, backtesting and paper trading are not an “either/or” choice; they are two essential steps in the same process. Backtesting is the first step: a high-speed simulation that uses historical data to see if your idea for a trading strategy is even viable. Paper trading is the second step: a real-time, forward-looking test that validates if you can personally execute that strategy with discipline in live, unpredictable market conditions.
After backtesting, many traders move on to paper trading to see how forex swing trading signals perform in real-time market conditions without risking real capital.
11. Frequently asked questions about Backtest Trading Strategy
12. The Bottom Line
Understanding how to backtest trading strategy is a foundational step in building a successful trading plan. A strategy is only truly reliable after it has been verified against historical data and tested through different volatility and market conditions.
This data-driven trading logic is a core part of modern risk management. Ultimately, combining a thorough backtest with a patient paper trading (forward testing) phase is the safest way for a trader to move from theory to real-world application.
To learn more about Forex trading strategies and how to build a robust plan, follow PipRider for more in-depth knowledge.