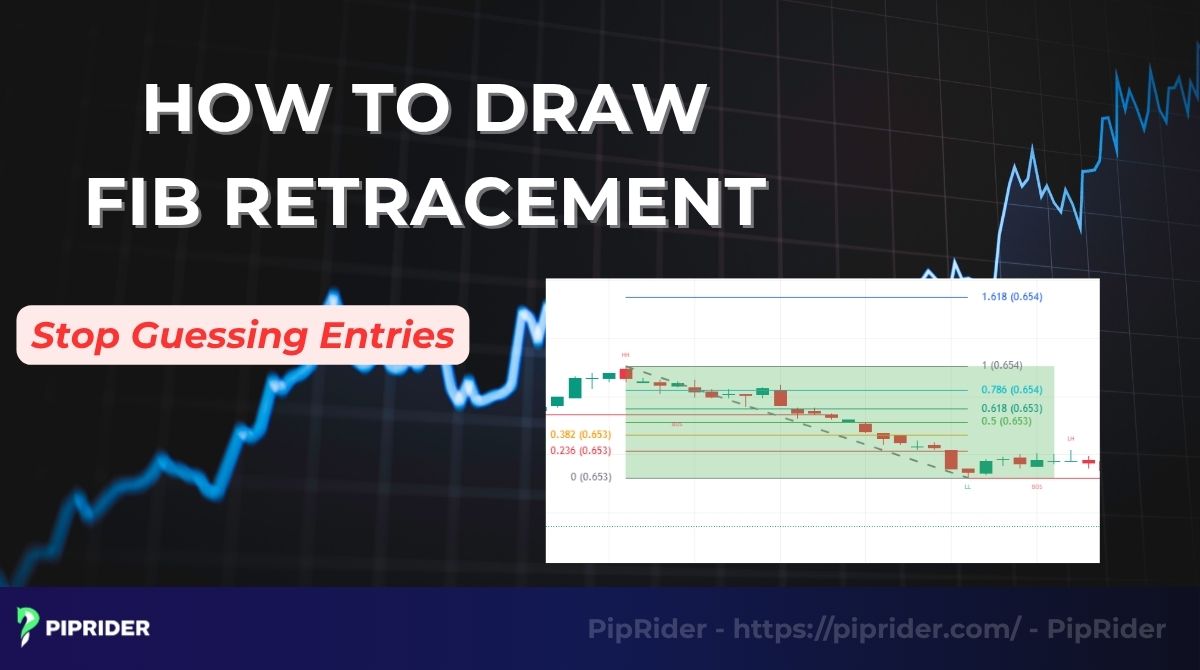
Knowing how to draw fib retracement correctly is one of the most useful skills for trading pullbacks. The key is not just drawing from point A to point B, but choosing the right swing, using a consistent method, and waiting for confirmation before entering.
This guide moves beyond basic definitions to show you exactly how to find valid “swings,” how to apply the tool in both uptrends and downtrends, and how to avoid the common drawing mistakes that lead to losing trades.
Quick Fib Rules for Beginners
- Trend first: Only use Fibonacci in a clear trending market.
- Follow the impulse: Always draw in the direction of the main price move.
- Quality over quantity: Use one major, visible swing rather than random micro-moves.
- Zones, not lines: Treat Fibonacci levels as areas of interest, not exact “magic” prices.
- Never trade alone: Always wait for price action confirmation (like a rejection candle) at the level.
Key Takeaways
- Identify support/resistance: The Fibonacci tool identifies potential reversal zones during a temporary pullback within a larger trend.
- Directional Drawing: You must draw from swing low to swing high in an uptrend, and swing high to swing low in a downtrend.
- The golden zone: While many levels exist, the 38.2%, 50%, and 61.8% levels are where the most reliable reactions occur.
- Power of confluence: Fib signals are significantly stronger when they align with market structure, trendlines, or moving averages.
- Trade management: Use retracement levels for entries and stop-losses, while using Fibonacci extensions to set logical profit targets.
1. What Is Fibonacci Retracement?
Fibonacci Retracement is a technical analysis tool that uses horizontal lines to indicate where possible support and resistance levels are located. These levels are based on Fibonacci ratios—mathematical percentages derived from the Fibonacci sequence—that help traders identify potential reversal points during a price pullback.
1.1. Why Does the Market React to These Levels?
A common question is why price often reacts to these specific ratios. While some traders view Fibonacci as a “natural law,” in modern markets, it is more accurately described as a reference zone for liquidity.
Many traders, institutional investors, and high-frequency algorithms use these levels as part of their strategy. When a significant number of market participants watch the same zones (like the 61.8% “Golden Ratio”), it can create a self-reinforcing effect. However, these levels are rarely “magic” on their own; they are most effective when they align with other factors like previous price structure or trendlines.
1.2. Retracement vs. Extension: Don’t Confuse the Two
It’s essential to understand the difference between these two tools, as they serve opposite purposes in a trade setup:
- Fibonacci retracement: Used to find pullback levels (potential entries). It measures how far a price might move back against the current trend before continuing.
- Fibonacci extension: Used to find price targets (potential exits). It projects where the price might go after the pullback is over and the trend resumes.
2. How to Choose the Right Swing for Fibonacci Retracement
Before you can draw the tool, you must identify a valid “impulse move”. Choosing the wrong swing is the most common reason traders find Fibonacci levels “unreliable.” If you draw from an insignificant micro-swing, the market is unlikely to respect those levels.
To find high-probability zones, you need to identify a major impulse move, a price surge that clearly stands out on your chart and changes the market’s trajectory.
2.1. The “Smart Swing” Checklist
Use this framework to decide if a swing is worth drawing your Fibonacci tool on:
- Break of structure (BOS): Did the move create a new higher high (in an uptrend) or a lower low (in a downtrend)? A move that doesn’t break previous structure is often too weak to trade.
- Displacement: Is the move fast and aggressive? Large, “displacement” candles indicate institutional interest. Slow, choppy moves are less reliable for Fibonacci.
- Visual prominence: If you zoom out on your chart, does the move “pop out” at you? If you have to squint to find the swing, it’s likely not a major impulse.
- Timeframe alignment: Does this swing represent the current trend on the timeframe you are trading (e.g., a clear 4H impulse for a 4H trade)?
2.2. Why Context Matters
The Fibonacci tool is not a trend predictor; it is a pullback predictor. It assumes that the current trend is strong enough to continue. Therefore, you should only select swings that occur within a confirmed trend.
Pro tip: If the market is moving sideways (choppy/ranging), do not look for swings. Fibonacci levels only carry weight when there is clear momentum for the price to “retrace” against.
By following these rules, you move from “guessing” where to draw to selecting price moves that the rest of the market is actually paying attention to.
3. How to Draw Fib Retracement (Step-by-Step)
Drawing the Fibonacci tool correctly is a technical process that requires precision. By following these five steps, you move from “guessing” where to draw to selecting price moves that the rest of the market is actually paying attention to.
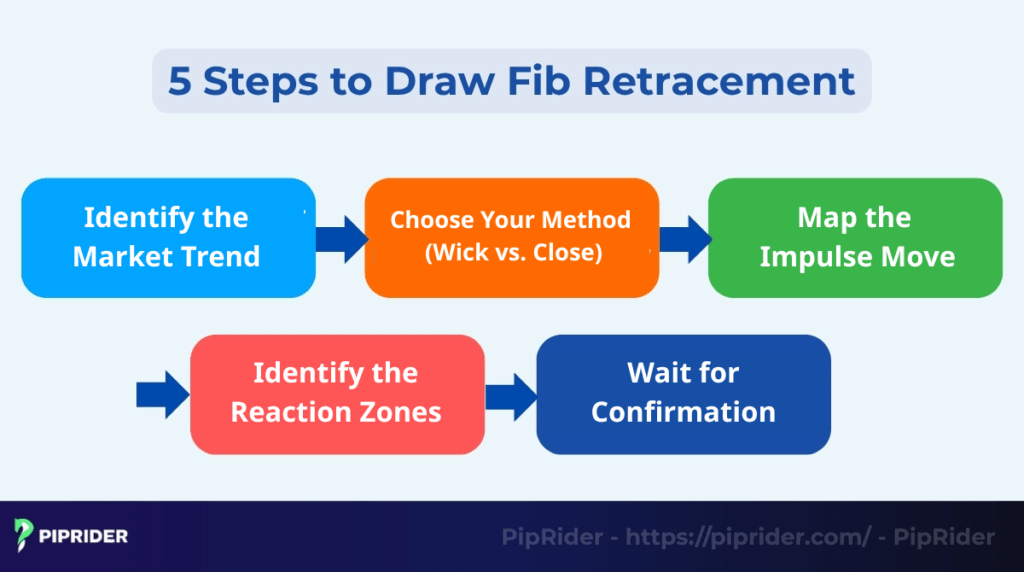
3.1. Step 1: Identify the Market Trend
The Fibonacci tool is a trend-following indicator. It loses its predictive power in sideways (ranging) markets. Before drawing, confirm the market direction:
- Uptrend: Price is making Higher Highs (HH) and Higher Lows (HL).
- Downtrend: Price is making Lower Lows (LL) and Lower Highs (LH).
3.2. Step 2: Choose Your Method (Wick vs. Close)
One of the most common questions is whether to draw from the “wicks” (extreme highs/lows) or the “closes” (candle bodies).
- Wick-to-Wick: Most popular for measuring the full price excursion and finding extreme liquidity zones.
- Close-to-Close: Often used by traders who believe closing prices are more significant than temporary intraday spikes.
The golden rule: There is no “right” way, but you must be consistent. If you start your tool at a wick, you must end it at a wick. Mixing the two methods on a single drawing will create inaccurate levels.
3.3. Step 3: Map the Impulse Move
Always draw the tool in the direction of the trend:
- In an uptrend: Click on the swing low (start of the move) and drag the cursor up to the swing high (end of the move).
- In a downtrend: Click on the swing high (start of the move) and drag the cursor down to the swing low (end of the move).
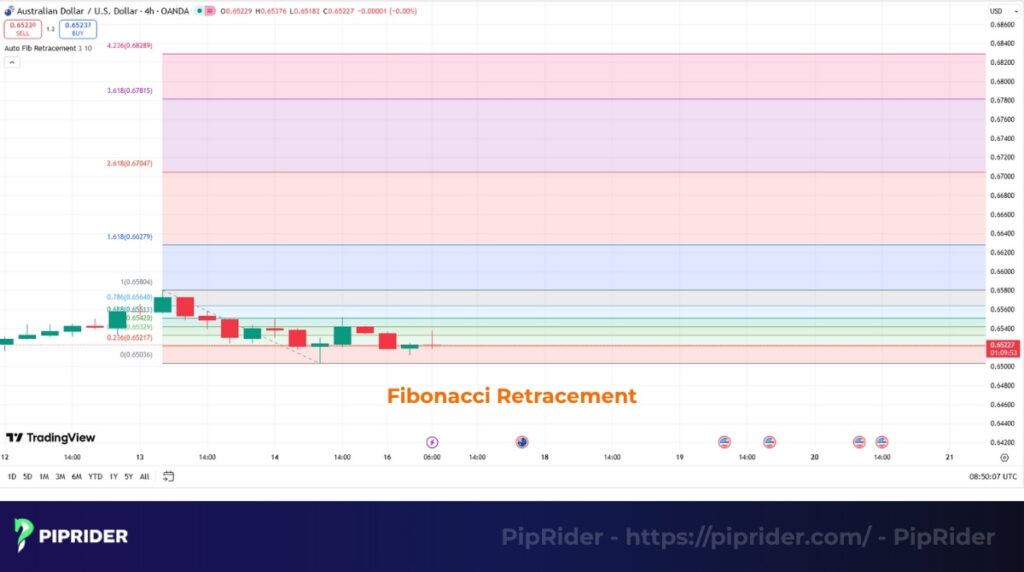
3.4. Step 4: Identify the Reaction Zones
Once the grid is placed, the key levels will appear. Professionals focus on the “Golden Zone” between 50%, 61.8%, and 78.6% for high-probability entries.
- 38.2%: Indicates a very strong trend with a shallow pullback.
- 50.0%: A critical psychological “equilibrium” or discount point.
- 61.8%: The “golden ratio” – the most watched level in technical analysis.
- 78.6%: The deep retracement zone and the “last line of defense” before a trend reversal.
3.5. Step 5: Wait for Confirmation
Never place a “limit order” exactly on a line without looking at price action. You must wait for a reaction at the zone, such as:
- A bullish or bearish engulfing candle.
- A long-wick rejection (pin bar).
- A “Shift in market structure” on a lower timeframe (e.g., watching a 5-minute break of structure inside a 1-hour Fib zone).
3.6. Plan Your Entry, SL, and TP
- Entry: After a confirmation candle closes within the 50%–78.6% area.
- Stop-Loss: Typically placed just beyond the 78.6% level or, for maximum safety, below the original Swing Low (in an uptrend).
- Take-Profit: Use the previous Swing High as the first target, or use Fibonacci Extensions (1.272 and 1.618) for extended targets.
4. How to Use Fibonacci Retracement in Trading
Drawing the tool is only the preparation; the real skill lies in execution. To improve your win rate, you must treat Fibonacci levels as part of a broader strategy. Professional traders rarely trade a Fib level in isolation; they look for “Confluence”.
Below are the three most effective ways to use Fibonacci retracement in real-market conditions.
4.1. The Classic Pullback Strategy (Uptrend vs. Downtrend)
This is the “bread and butter” of Fibonacci trading—buying the dip or selling the rally.
- In an uptrend (Buy the Dip):
- Setup: Identify a strong move up. Draw your tool from Swing Low to Swing High.
- Entry: Wait for a pullback to the 50% or 61.8% zone.
- Confirmation: Enter a “Buy” only after a bullish signal (e.g., a Pin Bar or Bullish Engulfing) forms at the level.
- In a downtrend (Sell the Rally):
- Setup: Identify a strong move down. Draw your tool from Swing High to Swing Low.
- Entry: Wait for a “relief rally” back up to the 50% or 61.8% zone.
- Confirmation: Enter a “Sell” only after a bearish signal (e.g., a Shooting Star or Bearish Engulfing) forms at the level.
4.2. The Breakout + Retest Strategyy
This strategy is used when the market breaks a major barrier and you missed the initial move. Fibonacci helps you find a logical entry on the “retest”.
- The breakout: Wait for price to break out of a major Resistance level or a consolidation box.
- The draw: Apply your Fibonacci tool to the breakout candle/move itself (from the start of the breakout move to its peak).
- The entry: Instead of “chasing” the price, wait for it to return to the 38.2% or 50% level of that specific breakout move to enter.
4.3. The Confluence Strategy (The A+ Setup)
The Confluence strategy is the most powerful way to use Fibonacci. A “confluence” is a price point where multiple technical signals align. When different types of traders (S/R traders, trendline traders, and Fib traders) all see a reason to enter at the same spot, the probability of success skyrockets.
An A+ setup typically includes:
- Fibonacci level: Price hits the 61.8% Golden Ratio.
- Horizontal S/R: The Fib level aligns perfectly with a previous “broken” support or resistance (Role Reversal).
- Dynamic support: A moving average (like the 50 EMA) or a major trendline intersects at the exact same price.
- Volume: Volume profile shows a “High Volume Node” (HVN) at this level, indicating heavy previous interest.
Rule of Thumb: A Fib level alone is a hint. A Fib level with two or more points of confluence is a trade.
5. What Are the Key Fibonacci Levels?
While the Fibonacci tool can display many different percentages, professional traders focus on a specific set of “hot zones”. Understanding the psychology behind these levels helps you determine the strength of the current trend.
The following table breaks down the most important retracement levels and how to interpret them:
| Fibonacci level | Market meaning | Best use case / Interpretation |
| 23.6% | Very Shallow Pullback | Indicates an extremely strong trend. Traders often use this as a “stop-run” or minor pause rather than a primary entry |
| 38.2% | Shallow Retracement | Suggests a strong trend remains intact. Buyers/Sellers are eager to enter and won’t wait for a deep discount |
| 50.0% | Psychological Mid-Point | Not a true Fibonacci ratio, but represents the “equilibrium” or 50% discount. It is one of the most common reaction points |
| 61.8% | The Golden Ratio | The most critical level. It represents the classic “Golden Zone” entry where high-probability reversals occur |
| 78.6% | Deep Retracement | The “Last Line of Defense.” A bounce here is valid, but a break below this level often suggests the trend has failed |
The “Golden Zone” (50% – 61.8%)
Most successful trade setups occur within this specific range. When the price enters this zone, it offers the best risk-to-reward ratio. Your stop-loss can remain relatively tight (just below 78.6% or the swing origin), while your profit target (the previous high or extensions) remains far away.
Trader’s note: Do not clutter your chart with every possible level. Focus on these five to avoid “analysis paralysis” and maintain a clear view of the price action.
6. Advanced Ways to Improve Fibonacci Accuracy
To move from a beginner to an advanced trader, you must stop viewing Fibonacci levels as “magical” bounce points. The key to a high win rate is confluence, the alignment of multiple independent indicators at the same price point.
Fibonacci Alone vs. Fibonacci with Confluence
- Fibonacci alone (weak hint): Price hits the 61.8% level in a vacuum. Without other reasons to buy or sell, this is often a “coin flip” trade.
- Fibonacci + Confluence (high-quality setup): Price hits the 61.8% level which also aligns with a previous Support/Resistance zone, a moving average, and a high-volume node. This creates a “cluster” of orders that is much harder for the market to break.

6.1. Combining Fib and Market Structure (BOS)
The most reliable Fibonacci setups occur immediately after a Break of Structure (BOS)
- The signal: Wait for price to break a previous major high or low, confirming the trend has resumed.
- The draw: Draw your Fibonacci on the specific move that caused the breakout.
- The entry: Look for the retracement to land in the “Golden Zone” (50%–61.8%) that sits inside the newly created structure. Trading with the momentum of a structure break significantly increases your probability of success.
6.2. Using Volume Profile (HVN & POC)
Volume Profile shows you where the most trading activity has occurred over a specific period.
- High-volume nodes (HVN): These are price areas where a lot of trading took place. They act as strong magnets and “floors” for the price.
- Point of control (POC): The single price level with the highest volume.
- The strategy: When a key Fibonacci level (like the 61.8%) overlaps with an HVN or the POC, you have found a “Hard Floor.” This indicates that institutional players have previously shown massive interest at this price, making a bounce highly likely.
6.3. Multi-Timeframe “Nesting” (HTF to LTF)
Professional traders use a top-down approach to find precise entries with minimal risk.
- Find the HTF zone: On a Higher Timeframe (Daily or 4H), identify a major impulse move and mark the 61.8% zone.
- Wait for the tap: Wait for the price to drop into that big Daily zone.
- Refine on LTF: Zoom into a Lower Timeframe (15m or 5m). Look for a smaller impulse move inside that zone and draw a new Fibonacci.
- The entry: When the LTF price retraces to its own 61.8% level inside the Daily 61.8% level, you have a “nested” setup. This allows for a very tight stop-loss and a massive potential reward.
7. What Makes a Fibonacci Setup Invalid?
The Fibonacci tool is powerful, but it is not a “crystal ball.” Most traders fail not because the levels don’t work, but because they apply the tool to the wrong market context. To avoid costly errors, you must recognize when a Fibonacci setup is invalid.
7.1. The “invalid setup” Checklist
Do not trade a Fibonacci level if any of the following conditions are met:
- Sideways/Ranging market: If the price is bouncing between a tight horizontal range without making new highs or lows, Fibonacci levels are meaningless. The tool requires a clear trend to function.
- Micro-swing hunting: Drawing the tool on a tiny 5-minute move while ignoring a massive 4-hour impulse. Always prioritize the most prominent, visible swing on your chart.
- Inconsistent methods: If you start your drawing at a candle wick but end it at a candle body (or vice versa), your levels will be mathematically skewed.
- No confirmation: Price hitting a level is a “prediction”; price reacting at a level is a “fact.” Entering a trade without a rejection candle (like a Pin Bar) is a high-risk gamble.
- Counter-trend drawing: Attempting to find a “sell” retracement in a parabolic uptrend. Always draw in the direction of the dominant momentum.
7.2. Top 5 Common Drawing Mistakes
- Picking the wrong swing: This is the #1 error. If you choose an insignificant move that didn’t break structure, the market won’t respect the levels.
- Analysis paralysis: Turning on every possible level (23.6%, 38.2%, 50%, 61.8%, 78.6%, 88.6%). Professional charts are clean; focus only on the Golden Zone (50%–61.8%) to keep your decision-making sharp.
- Forcing the setup: Trying to “make the Fib fit” by moving it around until a level touches the price. If a clear impulse move isn’t there, don’t force one.
- Ignoring the higher timeframe: Drawing a 15-minute Fibonacci while a massive Daily resistance is sitting just above your entry. Always check the “big picture” first.
- Trading “blind” on levels: Placing limit orders at a level without looking at how the price actually arrives there. If price approaches a Fib level with massive “god candles” (extreme momentum), it is likely to blow straight through it.
By following these rules, you move from “guessing” where to draw to selecting price moves that the rest of the market is actually paying attention to.
8. Real Trade Examples: Seeing Fibonacci in Action
The best way to master Fibonacci retracement is to see how it functions across different market conditions and timeframes. These two case studies illustrate how professional traders apply the “Golden Zone” rules in real-time.
Case 1: The uptrend pullback (Bullish setup)
- The scenario: A trader identifies a strong bullish impulse on the H4 chart where price has just broken a previous resistance level (BOS).
- The drawing: The trader identifies the absolute swing low (point A) and drags the tool to the swing high (point B).
- The execution: * Price begins to pull back. The trader waits for the “Golden Zone” (50%–61.8%).
- As price taps the 61.8% level, a Bullish Engulfing candle forms on the 1-hour chart (Multi-timeframe confirmation).
- Entry: At the close of the engulfing candle.
- Stop-Loss: Placed just below the 78.6% level to allow for “market noise.”
- Take-Profit: Target 1 is the previous Swing High (B); Target 2 is the 1.272 Fibonacci Extension.
Case 2: The downtrend retracement (Bearish setup)
- The scenario: The market is in a clear downtrend on the Daily chart. A sharp drop has occurred, creating a new Lower Low.
- The drawing: The trader draws the tool from the swing high (point C) down to the swing low (point D).
- The execution:
- Price rallies back up (a relief rally) toward the 50% “Equilibrium” level.
- At the 50% mark, the price hits a previous “Broken Support” level (Confluence).
- A Shooting Star rejection candle forms at the level.
- Entry: Sell at the break of the rejection candle’s low.
- Stop-Loss: Placed just above the 61.8% level or the Swing High (C).
- Take-Profit: Target 1 is the previous Swing Low (D).
Which timeframe is best for drawing Fib?
While Fibonacci works on all timeframes, the reliability of the levels increases as you move higher.
- Scalpers (M1 to M15): Use Fibonacci to find quick intraday bounces. Be warned that these levels are frequently “hunted” by market noise.
- Day traders (M15 to H1): This is the “sweet spot” for most traders. Levels are respected well, and trends are clear.
- Swing traders (H4 to Weekly): These levels carry the most weight. A 61.8% retracement on a Weekly chart is a major institutional zone that can lead to moves lasting months.
Pro tip: Always identify the “Major Move” on a higher timeframe first. Even if you are a scalper, drawing a Fibonacci on the 4-hour chart will tell you where the “big players” are likely to step in.
9. Where to Find and How to Configure Fibonacci Tools
The Fibonacci retracement tool is a standard feature on almost every modern charting platform. While the mathematical ratios remain the same, each platform has unique shortcuts and customization options to help you clean up your charts.
9.1. TradingView (Most Popular for Analysis)
TradingView is the industry standard for technical analysis due to its highly customizable interface.
- Location: In the left-hand drawing toolbar, it is typically the third icon from the top (under the “Gann and Fibonacci Tools” menu).
- Pro tip: You can “Star” the Fib Retracement tool to add it to your floating favorites bar for quick access.
- Configuration: Double-click the tool to open settings. Most pros uncheck “Background” to keep the chart clean and disable “Prices” if they only want to see the percentages.
9.2. MetaTrader 4 & 5 (Standard for Forex)
MT4/MT5 remains the most common platform for Forex and CFD traders globally.
- Location: Look for the “Insert” menu at the top, then select Objects > Fibonacci > Retracement. It is also usually available as a shortcut icon in the “Line Studies” toolbar.
- Configuration: To add the 78.6% level (which isn’t always a default in MT4), right-click the drawn tool, go to Fibo Levels, and click Add. Use 0.786 for the level and 78.6 for the description.
9.3. Thinkorswim / NinjaTrader (Professional Desktop)
These platforms are favored by high-volume stock, options, and futures traders.
- Thinkorswim: Press
Ctrl + For go to the Drawings menu and select Fibonacci Retracements. You can save “Drawing Sets” to switch between shallow and deep retracement levels quickly. - NinjaTrader: Use the Drawing Tools tile in the chart toolbar or press
F8on your keyboard.
9.4. Mobile Trading Apps
You aren’t limited to a desktop setup. Most modern apps (TradingView Mobile, MT4/5, and broker-specific apps) allow for touch-based drawing.
- Best practice: On mobile, use the “Magnifier” tool (often found in settings) to ensure your finger placement is exactly on the candle wick or body for accuracy.
General platform advice: Regardless of the platform, always go into the settings and ensure “Extend lines right” is turned on. This makes it much easier to see where historical Fib levels align with current price action.
10. Frequently asked questions about Drawing Fib Retracement Right
11. Conclusion
The Fibonacci retracement tool is powerful, but only if you know how to draw fib retracement correctly. It is not a magic system but a tool to find high-probability zones. The market (and other traders) reacts most reliably at the “Golden Zone” (the 50% and 61.8% levels).
To improve your win rate, never use Fibonacci alone. Always use it with confluence, combining it with the main trend, market structure, volume, and a clear confirmation candle before you enter a trade. Ready to find your edge? Keep learning with the expert guides at Piprider.