Learning how to find key levels in trading is the single most important skill for precise execution. These levels are the “map” of the market, showing you exactly where price is likely to react based on past order flow.
This guide provides a full methodology for finding key levels, starting with basic price action and moving to advanced Smart Money Concepts and multi-timeframe analysis. It is the foundation for setting accurate entries, stop losses, and take-profits in your risk management plan.
Key Takeaways
- Key levels in trading are price zones where the market has reacted multiple times in the past.
- The main types of key levels include support/resistance, swing points, liquidity zones, and supply-demand zones.
- Use multi-timeframe analysis to filter for the strongest zones.
- Combine key levels with volume, trend, and candlestick signals to increase accuracy.
- Key levels are the foundation for SL/TP placement, breakout, reversal, and pullback setups.
1. What Are Key Levels in Trading?
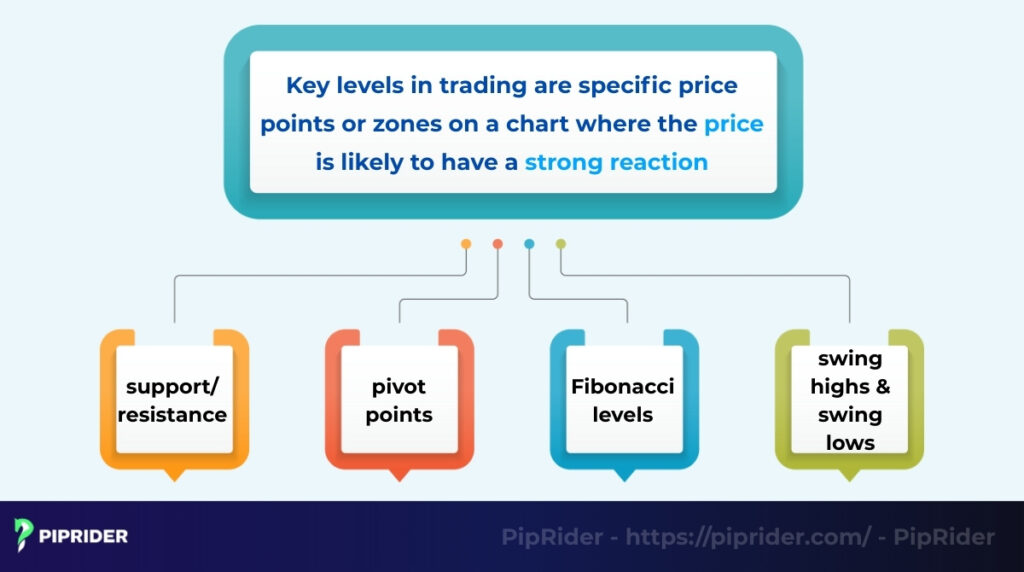
Key levels in trading are specific price points or zones on a chart where the price is more likely to attract a reaction, such as a bounce, reversal, or breakout. These levels, also known as support/resistance, pivot points, or Fibonacci levels, are the foundation of technical analysis and risk management.
1.1. Why Key Levels Work
The effectiveness of key levels is not a matter of luck; it is generally attributed to a combination of institutional order flow and human psychology. These zones tend to attract price reactions due to three primary factors:
- Market Memory: Market participants and algorithmic systems often “remember” price points where significant reversals occurred. When price returns to these historical turning points, those same participants are likely to track and react to them again.
- Order Concentration: Key levels act as liquidity magnets. A high volume of institutional and retail orders—including new entries, stop-losses, and take-profit targets—is frequently clustered in these specific areas.
- Collective Sentiment (The Self-Fulfilling Prophecy): Because a vast majority of traders expect a reaction at a well-known level, their collective actions (buying or selling) often create the very reaction they anticipated, reinforcing the level’s significance.
1.2. Key Levels vs. Random Support/Resistance
It is critical to distinguish between a significant key level and just any minor horizontal line. A common beginner mistake is drawing a line at every minor price bounce on a 5-minute chart, resulting in a cluttered, confusing screen.
To filter out the “noise” and identify potential institutional roadblocks, run every line through this test before drawing it on your chart.
The “Strong Key Level” Checklist
A price level is generally considered a strong key level if it is:
- Visible on Higher Timeframes (HTF): It stands out clearly on the Daily or H4 chart.
- Tested Multiple Times: It has attracted a reaction (tested and rejected) at least 2–3 times in the past.
- Aligned with Confluence: It aligns closely with a major swing high/low or a psychological round number, making it widely watched by market participants.
- The Source of Strong Displacement: The last time price approached this level, it resulted in a sharp rejection, leaving large momentum candles behind.
- Obvious at a Glance: It still looks like a clear turning point without needing to zoom in too much.
A Random S/R Line: Conversely, if a horizontal line is only visible on a lower timeframe (like the 15-minute chart), has only been touched once, and resulted in a weak, choppy reaction, it is typically just market “noise.” Such a level is more prone to being broken and is often best ignored.
2. Why Do Key Levels Matter in Technical Analysis?
Key levels matter because they provide objective, high-probability zones for traders. They are the most logical places to plan your entries, set your stop-loss, and place your take-profit targets. They act as a filter, making your entire trading strategy more reliable.
- Entry Points Become More Accurate: Instead of guessing or trading “in the middle of nowhere,” key levels give you a specific price zone to wait for. This patience improves your timing, as waiting for these established zones often improves trade location compared to entering randomly.
- SL and TP Placement Become Logical: Key levels solve the biggest problem for most traders. They provide the most logical price points for your exit points. A stop-loss (SL) can be placed just outside a key level (e.g., below support). A take-profit (TP) can be set just before the next key level.
- Price Action Signals Become More Reliable: A trading signal (like a pin bar or engulfing candle) is much more reliable when it forms at a major key level. The level acts as a powerful “confluence” or filter. A random signal in the middle of a range is low-probability; the same signal at a daily support level is high-probability.
- Helps Identify High-Probability Setups: By combining all these factors, key levels become the foundation for your entire trading plan. They are the “map” you use to identify all high-probability setups, whether you are trading breakouts, reversals, or pullbacks.
3. What Types of Key Levels Must You Know?
A common mistake is seeing too many lines on the chart. A professional trader learns to filter and focus only on the most important key levels. These levels (like pivot points and S/R) are created by market structure, psychology, or institutional timeframes.
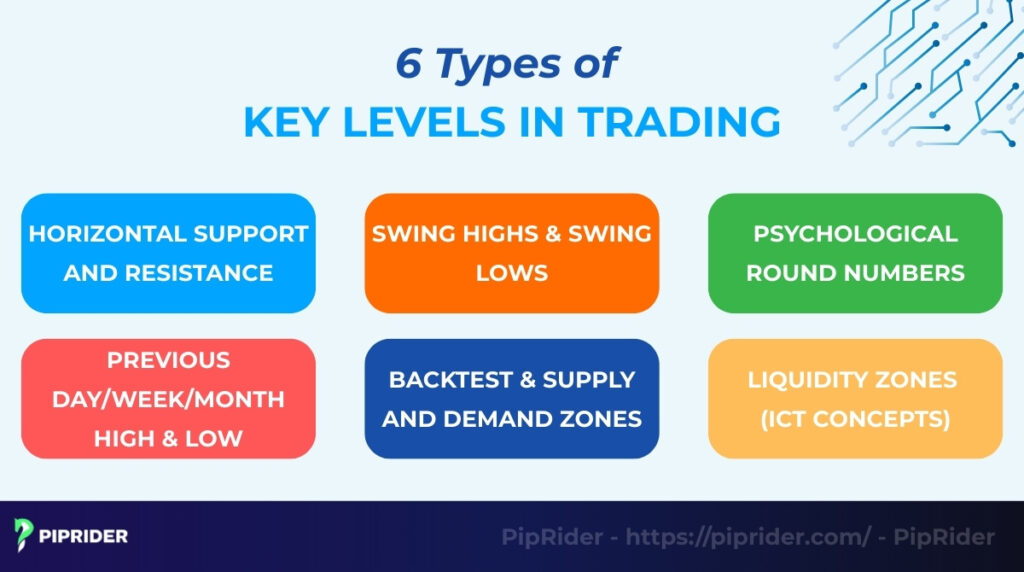
3.1. Horizontal Support and Resistance
These are the most fundamental key levels in technical analysis. They represent static price areas where supply and demand have historically reached an equilibrium, causing the price to stall or reverse. Think of them as the “floor” (support) and “ceiling” (resistance) of the market. While basic, these levels remain the primary areas of interest for institutional banks and retail traders alike.
3.2. Swing Highs & Swing Lows
Swing points are the peaks (swing highs) and valleys (swing lows) that create the chart’s “zig-zag” shape. Their role in market structure is critical. In an uptrend, the previous swing low is the key support that must hold. If the price breaks below it, the uptrend is often considered broken.
3.3. Psychological Round Numbers
The market respects psychological price levels, often called “round numbers,” due to crowd psychology.
- Levels like 1.0000 on EUR/USD, $150.00 on a stock, or 20,000 on an index act as psychological magnets.
- Millions of retail traders and bank algorithms place their orders at these clean levels, which creates a powerful, self-fulfilling support or resistance zone.
3.4. Previous Day/Week/Month High & Low
These are time-based levels that are critical for institutional trading. Day traders and algorithms pay close attention to the Previous Day’s High (PDH), Previous Day’s Low (PDL), and the Previous Week’s High/Low (PWH/PWL). These levels are often the main targets for the day’s price movement.
3.5. Supply and Demand Zones
Supply and demand zones are fresh price areas where a large number of institutional orders are waiting.
- They are identified by a strong departure candle (a very large, fast candle) that leaves a small consolidation zone behind.
- This imbalance in orders creates a powerful key level where the price often returns to fill the remaining institutional interest.
3.6. Liquidity Zones (ICT Concepts)
These zones are ‘targets’ for smart money. Popularized by Michael J. Huddleston (The Inner Circle Trader – ICT), these concepts focus on identifying where retail traders place their stop-losses (liquidity).
- The most common zones are Equal Highs (EQH) (Buy-Side Liquidity) and Equal Lows (EQL) (Sell-Side Liquidity).
- The market will often “sweep” these levels (run the stop losses) before making its true reversal.
3.7. Support/Resistance vs. Supply/Demand vs. Liquidity (A Quick Comparison)
As you mix classic technical analysis with modern Smart Money Concepts (SMC), it is easy to confuse these terms. While they all act as key levels, they are created by different market mechanics and require different trading approaches.
Here is a quick cheat sheet to help you distinguish between them:
| Type of Level | What It Shows (The Mechanics) | Best Use (How to Trade It) |
|---|---|---|
| Support & Resistance | A static, historical zone of repeated reactions. Shows where buyers/sellers historically defended the price. | Classic bounce (reversal) setups or breakout & retest strategies. |
| Supply & Demand | The origin of a massive imbalance. An untested area where a sharp, explosive institutional move started. | Return-to-zone entries (waiting for the price to retrace and tap the fresh zone). |
| Liquidity Zones | Areas where retail stop-losses and pending orders cluster (e.g., above Equal Highs or below a clean support). | Sweep / Stop-hunt context. Wait for the price to pierce the level and reverse. |
4. How Many Key Levels Should You Mark on One Chart?
As mentioned earlier, a common beginner mistake is seeing too many lines on the chart. When you mark every single price bounce, you suffer from analysis paralysis, hesitating to enter a trade because there is a “level” in every direction.
Remember this golden rule of technical analysis: If everything looks like a key level, nothing is a key level.
To keep your charts clean, professional, and actionable, enforce this strict drawing quota:
- On the Higher Timeframes (Daily/Weekly): Keep it to 3–5 zones maximum. You only need to map the immediate playground. Mark the major resistance directly above the current price, the major support directly below it, and perhaps 1 or 2 extreme macro swing points. If the price is nowhere near a level, delete it.
- On the Lower Timeframes (H1/M15): Refine only 1–2 execution areas. When you zoom in to execute a trade, do not start drawing new, minor support lines. Instead, use the 15-minute chart strictly to refine the 3-5 HTF zones you already drew (e.g., finding a specific 15-minute order block or liquidity pool inside the Daily support zone).
Keeping your chart minimalist is a superpower. Your brain needs visual clarity to pull the trigger with confidence, manage risk, and avoid being chopped up by market noise.
5. Which Timeframe Should You Use to Find Key Levels?
The concept of a “Higher Timeframe” (HTF) is relative. A 4-hour chart is a macro view for a scalper, but a micro view for a long-term investor. To avoid confusion and chart clutter, you must align your timeframes with your specific trading style.
To simplify the process, professionals divide their charts into two categories:
- Anchor Timeframe: The higher timeframe used exclusively to draw major key levels and determine the daily bias.
- Execution Timeframe: The lower timeframe used to zoom in, wait for price action confirmation, and pull the trigger.
Here is the standard multi-timeframe matrix used by professionals:
| Trading Style | Anchor Timeframe (Find Levels) | Execution Timeframe (Enter Trades) |
|---|---|---|
| Swing Trading (Days to Weeks) | Weekly / Daily | H4 / H1 |
| Day Trading (Intraday) | Daily / H4 | M15 / M5 |
| Scalping (Minutes) | H4 / H1 | M5 / M1 |
5.1. Swing Traders
Swing traders look to capture large, macro moves. You should rely on Weekly and Daily swing points, as these zones are more likely to carry the massive institutional weight needed to influence a multi-day trend. Dropping below the H1 chart is usually unnecessary and only introduces noise.
5.2. Day Traders
Day traders operate within the daily volatility range. Your most critical key levels will often be the Daily Support/Resistance and the Previous Day’s High/Low (PDH/PDL). You then drop to the M15 or M5 to watch for a clean price action confirmation around these HTF zones.
5.3. Scalpers
A fatal mistake scalpers make is drawing horizontal lines exclusively on the 1-minute chart. M1 levels are extremely weak and easily broken by random market fluctuations. Even if you execute your entries on the 1-minute chart, you must still anchor your bias to an H1 or H4 key level to avoid trading blindly against the broader intraday momentum.
6. How to Find Key Levels in Trading (A Step-by-Step Process)
When a beginner opens a chart, they often draw a line at every single price bounce, resulting in a confusing, cluttered screen. Finding key levels is a process of elimination, not addition. You must filter out the “noise” and focus only on the zones where institutional money is waiting.
Before starting the step-by-step process below, memorize this Priority Hierarchy. If you ever have too many lines on your chart, use this list to delete the weak ones. The higher the level is on this list, the stronger the reaction will be:
The Priority Order for Marking Key Levels:
- Weekly/Daily Swing Highs and Lows: The absolute boundaries of the macro market structure.
- Major Horizontal Support/Resistance Zones: Areas with 3 or more clear rejections on the HTF.
- Previous Day/Week Highs and Lows (PDH/PDL): Immediate institutional targets for intraday traders.
- Psychological Round Numbers: Big whole numbers (e.g., 1.1000 or $400) where orders naturally cluster.
- Supply/Demand Zones: Untested areas where explosive institutional moves originated.
- Liquidity Pools & LTF Refinements: Equal Highs/Lows on the M15 chart. Use these only to pinpoint entries, not to dictate the trend.
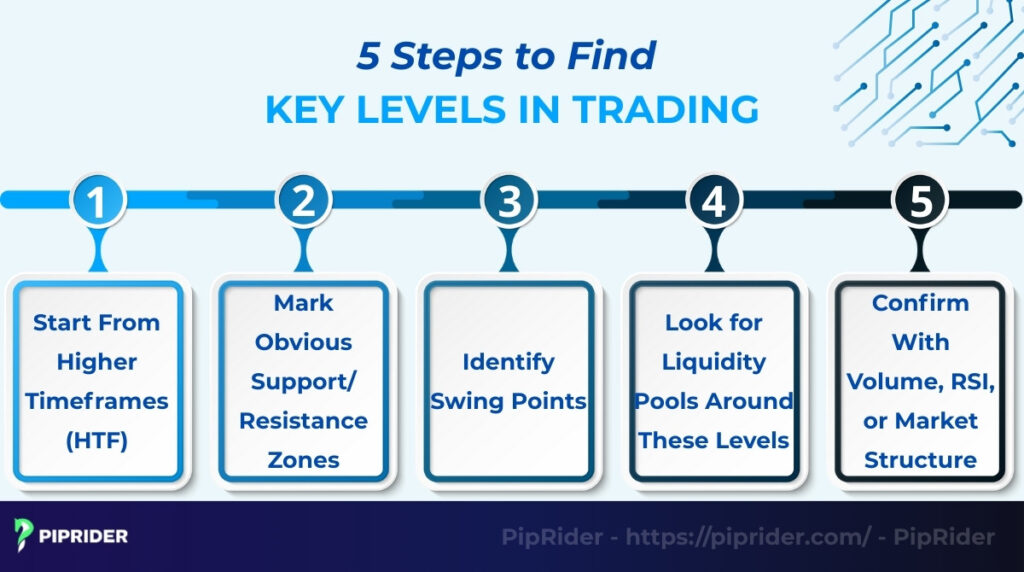
6.1. Step 1: Start From Higher Timeframes (HTF)
The most important rule is a “Top-Down” approach. Open the Weekly or Daily chart first. A key level on the daily chart is far more significant than a level on the 15-minute chart because it holds institutional weight. Your goal here is to identify the overarching trend and the major boundaries where the price has historically reversed.
6.2. Step 2: Draw Zones, Not Lines (Wicks vs. Bodies)
The golden rule of drawing is that support and resistance are zones of conflict, not thin lines. To identify a valid zone, look for at least 2 or 3 clear rejections in the same price vicinity.
- How to draw: Use the rectangle tool. Instead of clicking a single price point, encompass the space between the candle body closes and the tips of the wicks.
- Why this works: This “buffer zone” accounts for minor price fluctuations and “fake” breaches, giving you a more realistic area to watch for a reaction.
6.3. Step 3: Add Time-Based & Psychological Targets
Once the major structural zones are mapped, look for the “magnets” that will draw the price in today or this week.
- Mark the Previous Day’s High (PDH) and Previous Day’s Low (PDL).
- If a major Support/Resistance zone aligns closely with a Psychological Round Number—such as Bitcoin at a major century bond (e.g., $50,000 or $100,000) or EUR/USD at parity (1.0000)—highlight it. This confluence often significantly increases the probability of a strong market reaction, as orders from both technical and psychological players converge in the same area.
6.4. Step 4: Spot the Liquidity (The Stop Hunt Zones)
Institutions need liquidity to fill their massive orders. They find it where retail traders place their stop-losses. Look just above your resistance zones or just below your support zones. Do you see Equal Highs (EQH) or Equal Lows (EQL)? Mark these as “Liquidity Pools.” Expect the market to briefly pierce through your key level to “sweep” these stops before reversing.
6.5. Step 5: Refine on Lower Timeframes (LTF) and Confirm
Now, drop down to a lower timeframe (like the H1 or M15) to watch how the price behaves as it enters your HTF zones. Never trade a key level blindly with a limit order. Wait for confirmation that the level is holding:
- Price Action: Look for a strong rejection candle (Pin bar, Bullish/Bearish Engulfing).
- Volume: A spike in volume as the price hits the zone indicates institutional defense.
- Momentum: Look for RSI divergence showing the trend is exhausting right at your key level.
7. What Are the Common Mistakes When Finding Key Levels?
Beginners usually fail in two distinct areas: they either draw the wrong levels, or they trade the right levels incorrectly. To protect your capital, you must eliminate both habits.
7.1. Mistakes in Drawing (The “Red Flag” Filter)
Before finalizing your analysis, run your drawn lines through this quick anti-pattern filter. If a line meets any of these criteria, it is likely just market noise.
This is probably NOT a significant key level if
- It only appears on a very low timeframe: If you can only see it on the 1-minute or 5-minute chart, it lacks the institutional weight needed to influence the price significantly.
- It has no HTF relevance: It does not align with any major macro structure or trend on the Daily/Weekly charts.
- Price touched it only once: A single, minor bounce does not confirm a strong zone. It needs to have attracted a reaction multiple times.
- It sits inside noisy chop: If the line is drawn right in the middle of a messy consolidation range where the price frequently chops back and forth, delete it.
- You had to “force” it: If you find yourself zooming in too much, squinting, or trying too hard to justify why a line should be there, it is not a real level. Significant key levels are glaringly obvious.
7.2. Mistakes in Execution (Trading the Level)
Once you have the correct 3–5 zones marked on your chart, avoid these common execution traps:
- Trading “Blind” Without Price Action: A key level is just a “zone of interest,” not an automatic buy or sell signal. A critical error is entering a trade simply because the price touched the line. You should always wait for a price action signal (like a pin bar or engulfing candle) to confirm how the market is actually reacting.
- Entering “On the Line” (The Limit Order Trap): Placing a tight limit order exactly at a support line is a recipe for disaster. Institutional algorithms often drive the price slightly through the level to sweep liquidity (a “stop hunt”) before the market potentially reverses.
- Analysis Paralysis (Cluttered Charts): Keeping 20 different lines on your screen leads to hesitation. When there is a “level” in every direction, you will be too scared to pull the trigger. Stick strictly to the quota mentioned earlier: map only the most obvious zones.
Pro-Tip: A true breakout usually happens with high volume and candle bodies closing firmly above the level. A liquidity sweep (fakeout) often leaves long wicks and quickly returns inside the range.
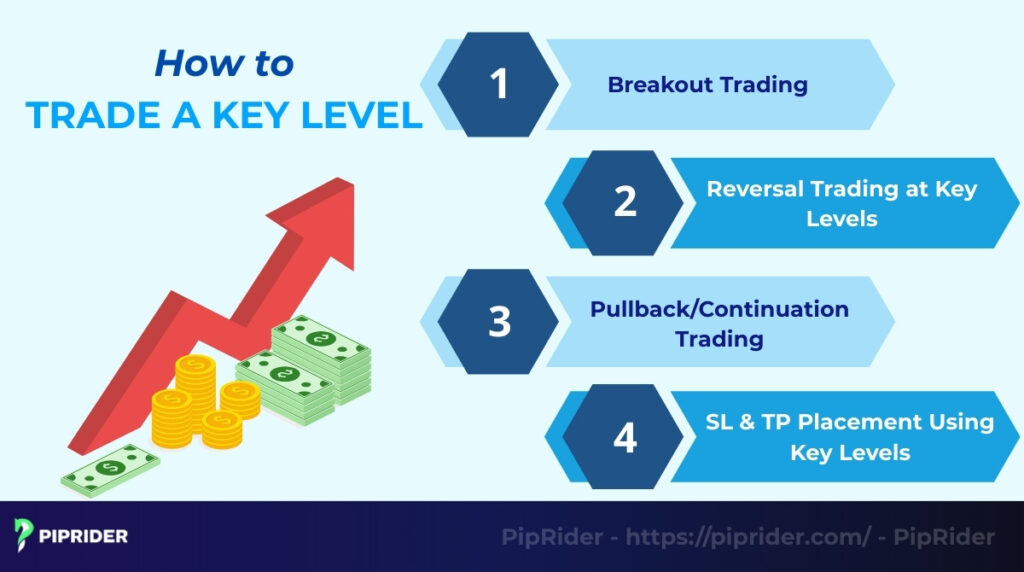
8. How Do You Use Key Levels in Trading?
Once you have identified your key levels, you can use them as the foundation for your forex trading strategies. The three main ways to trade are breakouts, reversals, and pullbacks.
8.1. The Universal Key Level Execution Workflow
Whether you are trading a reversal, a breakout, or a pullback, the sequence of your actions should remain consistent. A key level is just an area of interest, not an automatic entry signal.
Before pulling the trigger on any trade, force yourself to follow this 6-step execution flow:
- Mark the HTF Zone: Identify your 3–5 major structural zones on the Higher Timeframe (e.g., Daily or H4 chart).
- Wait for the Price: Avoid staring at the chart all day, which often leads to forced trades. Set a price alert just before the zone and wait patiently for the market to come to you.
- Watch the LTF Reaction: Once the price taps your HTF zone, drop down to your execution timeframe (e.g., H1 or M15 chart) to closely observe the market’s behavior.
- Look for Confirmation: Never enter blindly on a touch. Wait for the market to confirm that the level is holding. Look for a Market Structure Shift (MSS), a strong price action signal (like a pin bar or engulfing candle), or a noticeable volume spike.
- Place SL Beyond the Zone: Always define your risk before entering. Place your Stop-Loss (SL) safely on the other side of the key level, leaving a small buffer to survive potential stop hunts and extreme volatility.
- Target the Next Level: Identify the next logical HTF key level to use as your Take-Profit (TP). If the distance to the TP does not offer a favorable risk-to-reward ratio (e.g., at least 1:2), skip the trade entirely.
8.2. Breakout Trading
A breakout strategy involves waiting for the price to break through a key level with strong momentum.
- Break & retest: The most classic setup. You wait for the price to break above resistance. Then, you wait for it to pull back and “retest” that old resistance, which should now act as new support. This retest is your entry point.
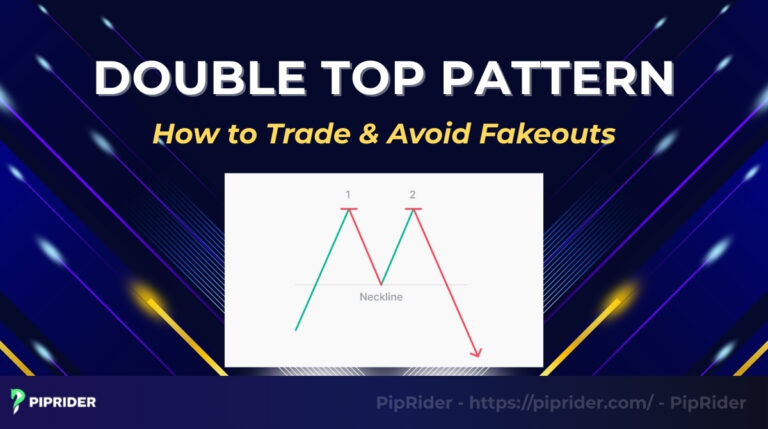
- Fakeout patterns: You must also watch for “fakeouts.” A fakeout is when the price breaks a level (e.g., a high) and then immediately reverses back down, trapping breakout traders.
8.3. Reversal Trading at Key Levels
A reversal strategy involves betting that the key level will hold and the price will “bounce” off it.
- The setup: Price approaches major key price points (like a Daily S/R zone).
- The entry: You do not enter just because the price touches the level. You wait for a clear reversal signal on your chart, such as a bullish engulfing candle, a pin bar, or a Swing Failure Pattern (SFP).
8.4. Pullback/Continuation Trading
This is a trend-following strategy. You use key levels to find an entry within an established trend.
- The setup: The market is in a clear uptrend. Price starts to pull back.
- The entry: Instead of guessing where the pullback will stop, you wait for it to hit a confirmed key level (like one of the moving averages or a 61.8% Fib level). When the price bounces off that level, you enter a “Buy” trade to join the main trend.
8.5. The Science of Strategic Placement
Buffers and ATR Placing your Stop-Loss exactly on the line is a common “stop-hunt” trap. To trade like a professional, you must give your trade “room to breathe.”
- The Strategic Buffer: Always place your SL 5–15 pips beyond the zone (depending on the timeframe). This protects you from “wick sweeps” where institutions briefly push price past a level to grab liquidity before reversing.
- Take Profit Timing: Don’t set your TP exactly on the next level. Aim to exit 2–5 pips before the level. Large orders often cluster just before a key level, and the price might reverse slightly before actually touching your target line.
9. What Are Advanced Concepts to Improve Key Level Accuracy?
Finding a basic key level is step one. The real edge for professional traders comes from confluence. Confluence in trading means finding a “hot zone” where multiple advanced signals (like market structure, Fibs, and volume) all line up at the same price.
9.1. Multi-Timeframe Confluence
Professionals consider multi-timeframe confluence the most powerful filter. It involves using two timeframes:
- Higher timeframe (HTF) (e.g., Daily, H4): Use this to find your major key level (the “zone”).
- Lower timeframe (LTF) (e.g., M15): Wait for the price to enter the HTF zone. Then, wait for a clear trading entry signal (like a pin bar or engulfing candle) on the LTF.
9.2. Premium & Discount Zones (Smart Money)
Using premium & discount zones is a Smart Money (SMC) concept that uses the Fibonacci retracement tool to filter which key levels are valid.
- Discount zone (below 50%): In an uptrend, you only look for “Buy” entries at key levels that are in the “discount” zone (below the 50% Fib level).
- Premium zone (above 50%): In a downtrend, you only look for “Sell” entries at key levels that are in the “premium” zone (above the 50% Fib level).
9.3. Volume Profiles & Value Areas
The volume profile indicator, based on J. Peter Steidlmayer’s Market Profile theory, shows you exactly where the most trading volume has occurred.
- Point of control (POC): The single price level with the most volume. It acts as a powerful magnet or support/resistance.
- Value area high/low (VAH/VAL): The top and bottom of the main “value zone.”
- Confluence: A key level (like a swing low or daily pivot point) that lines up perfectly with a POC or VAH/VAL is an extremely strong, data-driven zone.
9.4. Using Imbalance / Fair Value Gaps to Refine Levels
Another advanced Smart Money Concept (SMC) technique is to use Imbalance or Fair Value Gaps (FVGs) to refine your levels. This method identifies ‘inefficiencies’ in price action where orders were not fully filled.
- Refining the level: Instead of just looking at a big key zone, you can look for a precise FVG inside that zone.
- The trade: Many traders wait for the price to pull back and fill 50% of the FVG. This 50% level (the “equilibrium”) becomes a very precise key level for an entry.
10. Real Chart Examples: How to Trade Key Levels (Case Studies)
Theory is only useful when applied to a live chart. Below are three of the most common key level setups, structured exactly how a professional trader would log them in their trading journal.
10.1. Setup 1: The Reversal at Daily Support
This reversal setup offers one of the best risk-to-reward ratios, catching a fading trend exactly at an institutional roadblock.
- Context: EUR/USD has been in a prolonged downtrend for several days but loses downward momentum as it approaches a major previous low from the last quarter.
- Level Type: Major Daily Support Zone confluent with sell-side liquidity (a pool of stop-losses below the old low).
- Trigger: Price pierces slightly below the support zone (a classic stop hunt) and immediately rejects, printing a strong bullish pin bar on the H4 chart.
- SL (Stop-Loss): Placed 10–15 pips below the extreme wick of the pin bar to allow a safe buffer against volatility.
- TP (Take-Profit): Targeted at the next major H4 resistance or the nearest untested supply zone above.
10.2. Setup 2: The Breakout + Retest
Never suffer from FOMO (Fear Of Missing Out) when a level breaks. This setup requires patience, waiting for the price to return and confirm the broken level as a new foundation.
- Context: Gold (XAU/USD) has been consolidating under the $2,000 mark for weeks. Suddenly, a massive volume spike pushes the price cleanly above this ceiling with a strong Marubozu candle.
- Level Type: Structural Resistance turned Support, perfectly aligned with a major Psychological Round Number ($2,000).
- Trigger: Price pulls back to retest the $2,000 level. Zooming into the M15 chart, you wait for a bullish Market Structure Shift (MSS) and an engulfing candle to confirm buyers are defending the new support.
- SL (Stop-Loss): Placed safely below the retest consolidation zone to avoid minor intraday shakeouts.
- TP (Take-Profit): The recent swing high created immediately after the initial breakout impulse.
10.3. Setup 3: The Pullback Continuation in Trend
This is a classic trend-following strategy. You use key levels to find a safe entry point when an established trend is taking a temporary breather.
- Context: The S&P 500 index is in a clear, aggressive uptrend, continuously making higher highs and higher lows. The price begins a routine pullback.
- Level Type: Previous Resistance turned Support, perfectly confluent with the golden 61.8% Fibonacci retracement level.
- Trigger: A bullish engulfing pattern forms exactly at this confluence zone on the H1 chart, accompanied by hidden bullish divergence on the RSI indicator.
- SL (Stop-Loss): Placed strictly below the support zone and tucked safely under the 61.8% Fibonacci level.
- TP (Take-Profit): Target 1 is the recent swing high. Target 2 is the -27% Fibonacci extension level.
11. What Are the Best Tools to Identify Key Levels Automatically?
While marking levels manually is a great skill, many traders use automated indicators to save time. These tools scan the chart and plot important zones automatically.
- TradingView Auto-SR + Liquidity Indicators: TradingView is the most popular platform for these tools. It offers built-in “Auto Support/Resistance” (Auto-SR) indicators, and you can find many powerful community-built scripts that automatically draw liquidity levels (like PDH/PDL), pivot points, and moving averages.
- TrendSpider Automated Support/Resistance: The TrendSpider platform is built specifically for automation. Its core feature is the ability to automatically find and draw trend lines and horizontal support/resistance levels on any chart, saving the trader a lot of manual drawing time.
- Order Flow Tools (Bookmap, ExoCharts): More advanced traders use Order Flow Tools like Bookmap or ExoCharts. These platforms look beyond past price; they show the live Depth of Market (DOM). This feature visualizes exactly where the large clusters of buy and sell orders (the real-time liquidity) are waiting, which often precedes volatility.
- Smart Money Tools (LuxAlgo, ICT-based indicators): Finally, “all-in-one” Smart Money Tools (like the popular LuxAlgo suite or other ICT-based indicators) are designed to draw all key SMC zones on your chart automatically. This includes order blocks, FVGs, and liquidity sweeps, all in one indicator.
12. Frequently asked questions about finding key levels in trading
13. Conclusion
Key levels are the foundation of all technical analysis and price action trading. Learning how to find key levels in trading is the skill that separates professionals from beginners. When you choose the right key levels, you dramatically increase the accuracy of your entry, stop-loss, and take-profit exit points.
For the highest-probability setups, always use multi-timeframe analysis and look for a confluence of liquidity zones and confirmation signals. To learn more expert strategies, explore the free guides at Piprider.
Risk Disclosure: Trading foreign exchange, cryptocurrencies, and commodities on margin carries a high level of risk and may not be suitable for all investors. The content in this guide is for educational purposes only and does not constitute financial advice. Past performance is not indicative of future results. Always perform your own due diligence before risking capital.