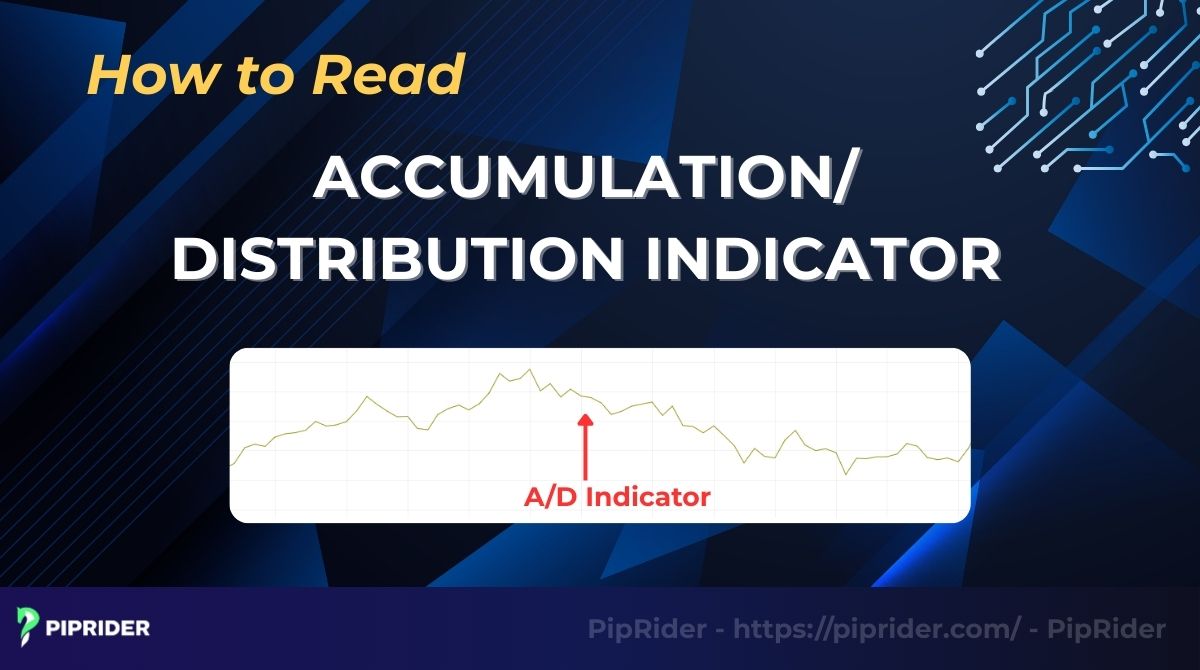
The Accumulation/Distribution (A/D) Indicator is a powerful tool that helps traders see if “Smart Money” is flowing into or out of a market. This flow is a critical signal for measuring a trend’s true strength. This guide explains how to read accumulation/distribution indicator effectively by focusing on its two most powerful signals: trend confirmation and divergence.
Key Takeaways
- The A/D indicator is a volume-based tool that measures money flow (accumulation/distribution) by combining an asset’s price and volume.
- A rising A/D line signals accumulation (buying pressure is strong), while a falling A/D line signals distribution (selling pressure is strong).
- Divergence between the A/D line and the price is the most powerful signal, often warning of a market reversal before it happens.
- The A/D line is used to confirm a trend’s strength or spot weakness, often providing clearer signals than volume alone.
- It is a popular indicator for technical analysis in stock, forex, and crypto trading.
1. What Is the Accumulation/Distribution Indicator?
The Accumulation/Distribution (A/D) Indicator a technical analysis tool developed by Marc Chaikin to measure the volume flow of money into or out of an asset (StockCharts, n.d.). By combining price movement with volume, it helps traders determine if an asset is being accumulated (bought) or distributed (sold) by institutions.
Its primary purpose is to gauge the true strength of a trend:
- If the price is rising but the A/D line is falling, it suggests the trend is weak (distribution).
- If the price is falling but the A/D line is rising, it suggests Smart Money is buying (accumulation).
Traditional volume bars only tell you how much was traded. The A/D indicator tells you who is likely in control by analyzing the Close Location Value (CLV)—exactly where the price closed relative to its high and low.
1.1. A/D vs. OBV vs. MFI vs. CMF: Which One Should You Use?
While these indicators are similar, they calculate “flow” using different mathematical lenses. Choosing the right one depends on your specific trading style and the market context.
| Indicator | Calculation Logic | Core Strength | Primary Weakness | Best Used When… |
|---|---|---|---|---|
| On-Balance Volume (OBV) | Adds/subtracts total volume based on Close vs. Prev Close. | Simple to read; great for early “hidden” breakouts. | Ignores intraday price range; sensitive to news spikes. | Confirming basic trend health and macro breakouts. |
| Money Flow Index (MFI) | Price + Volume, formatted as an oscillator (0–100). | Identifies Overbought/Oversold conditions like RSI. | Can be noisy and provide “fake” signals in low-volatility ranges. | Identifying price exhaustion and momentum reversals. |
| Accumulation/Distribution (A/D) | Uses CLV (Close Location Value) x Volume; Cumulative line. | Tracks the quality of a trend and institutional flow. | Highly sensitive to price gaps; no specific price targets. | Spotting long-term Divergence and trend sustainability. |
| Chaikin Money Flow (CMF) | A/D logic applied to a specific lookback window (e.g., 20 periods). | Clear “Zero Line” crossovers; easier to spot immediate buy/sell pressure. | Prone to lag because it only looks at a fixed “window” of time. | Confirming entries on short-to-medium term pullbacks. |
Pro-Tip: Avoid “Indicator Soup.” If you are a long-term investor, the A/D line is superior for tracking institutional accumulation. If you are an intraday trader, CMF provides more actionable signals around its zero line.
2. How Does the Accumulation/Distribution Indicator Work?
The A/D indicator works by comparing the closing price to the trading range (High-Low) of that specific period. It assumes that smart money (institutions) drives the price to close near the highs when they are buying and near the lows when they are selling.
2.1. The Role of the Price Range (Close Location Value)
To determine the direction of volume flow, the indicator first calculates the Close Location Value (CLV). This metric analyzes exactly where the price closed relative to the specific High and Low of that period to determine who “won” the session to inform your trading decisions.
- Close near high: If the price closes near the top of the day’s range, the CLV is positive (+1). This indicates strong buying pressure.
- Close near low: If the price closes near the bottom of the range, the CLV is negative (-1). This indicates strong selling pressure.
- Close in the middle: If the price closes exactly in the middle, the CLV is 0. This indicates neutrality.
The Psychology Behind CLV: Why does the closing price matter so much? In trading, there is a famous saying: “Amateurs open the market, but professionals close it.” If a daily candle has a massive rally but closes near its low (creating a long upper wick), the CLV will be negative. This tells you that despite the intraday hype, institutions aggressively sold into the rally before the day ended.
The A/D line captures this institutional footprint, whereas a traditional volume bar would just show a large, misleading “green” volume spike.
2.2. The Role of Volume
Once the price location is determined, it is multiplied by the total volume. Volume acts as the “weight” of the move. It confirms whether the price change is significant (driven by institutions) or weak.
- A move with high volume will push the A/D line up or down significantly.
- A move with low volume will barely move the A/D line. This ensures that the indicator only reacts strongly when there is real participation behind the price move.
2.3. The A/D Line Formula
While most trading platforms calculate this automatically, seeing the formula helps you understand the logic behind the signals. The mathematical foundation of this volume-flow indicator is widely documented in foundational technical analysis literature (Murphy, 1999).
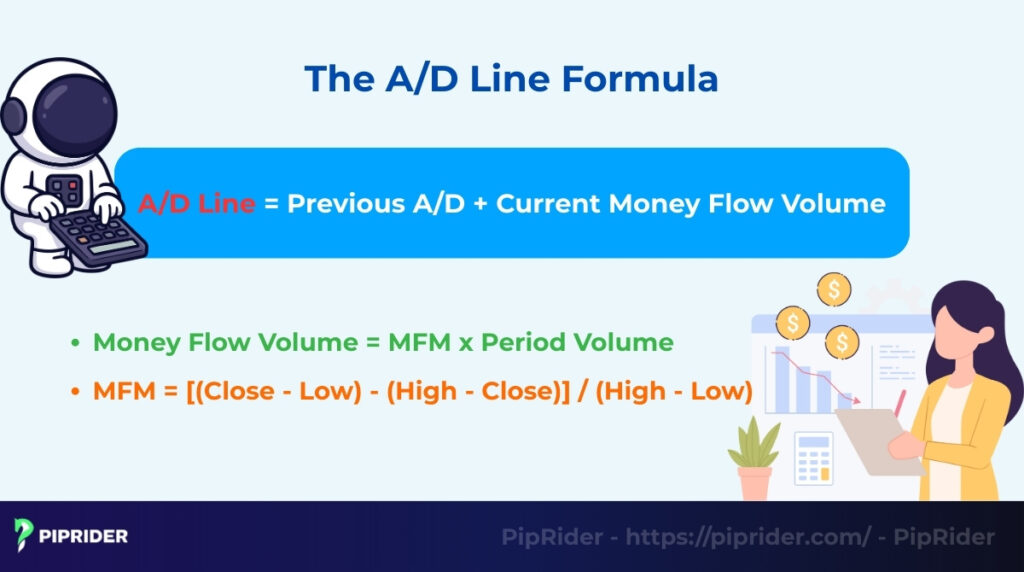
The calculation follows a three-step process:
1. Calculate the Money Flow Multiplier (MFM):
2. Calculate the Money Flow Volume:
3. Calculate the A/D Line:
In simple terms: The A/D line is a running total, or cumulative measure, of money flowing in and out of the market based on where the price closes.
3. A/D in Stocks vs. Forex vs. Crypto: Does Market Type Matter?
Because the Accumulation/Distribution formula relies entirely on volume data, the quality of that data dictates the indicator’s reliability. The A/D line performs differently depending on the underlying structure of the asset class being traded.
3.1. Stocks: The Traditional Stronghold
The A/D indicator was originally developed by Marc Chaikin for the stock market, making equities its natural environment.
- The Context: The stock market operates through centralized exchanges (like the NYSE or NASDAQ), where every transaction is recorded on a central tape.
- Data Reliability: Extremely high. The volume bars on a stock chart represent the actual number of shares traded, reflecting true capital flow.
- The Verdict: A/D is generally most reliable in the stock market. Institutional accumulation and distribution leave clear, verifiable footprints in the centralized volume data.
3.2. Forex: The Tick Volume Proxy
Applying volume indicators to the foreign exchange market requires a significant mindset shift due to its decentralized nature.
- The Context: Forex is an Over-The-Counter (OTC) market. There is no central exchange to report total global trading volume.
- Data Reliability: Moderate. Most retail Forex brokers substitute real volume with Tick Volume (the number of times the price changes within a given period) because a centralized exchange does not exist for spot FX (BabyPips, n.d.). While tick volume often correlates with real capital flow, it is strictly an estimate.
- The Verdict: The A/D indicator remains usable in Forex as a secondary filter, but its divergence signals carry less weight. Traders must remember that a rising A/D line in Forex reflects high activity, which may not always equate to massive institutional liquidity.
3.3. Crypto: The Fragmentation Challenge
The cryptocurrency market offers real volume data, but it presents a unique challenge: liquidity fragmentation.
- The Context: Cryptocurrencies trade 24/7 across hundreds of independent centralized exchanges (e.g., Binance, Coinbase) and decentralized protocols (DEXs).
- Data Reliability: Highly variable. The volume displayed on a chart is often limited to the specific exchange providing the data feed. A massive institutional buy order on one exchange might not reflect on another’s A/D chart.
- The Verdict: To use A/D effectively in crypto, traders should utilize aggregated data feeds (like composite indices) that pull volume from multiple major exchanges. It is effective for large-cap coins but can produce misleading signals on low-liquidity altcoins.
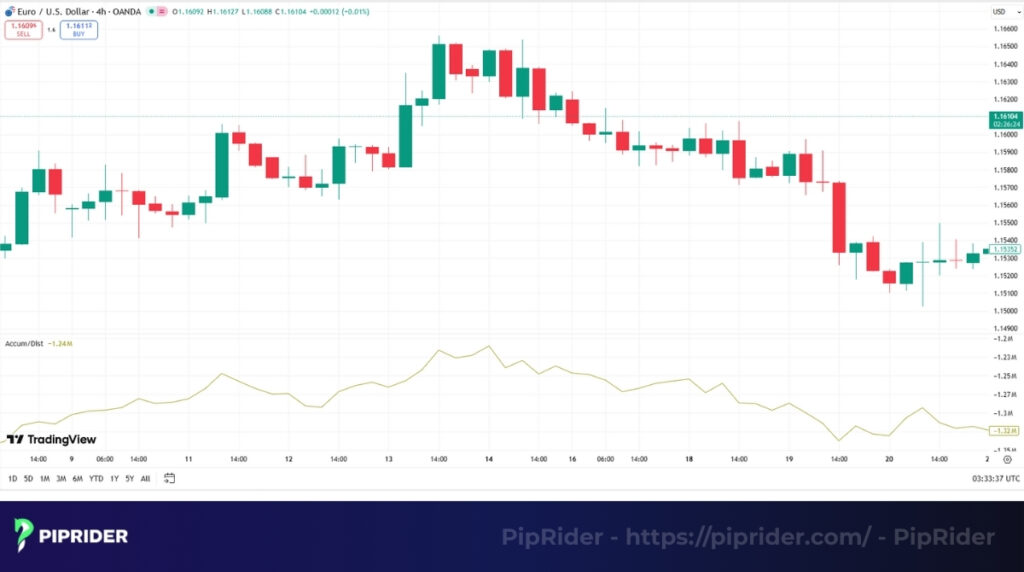
4. How to Read Accumulation/Distribution Indicator
Reading the A/D indicator is straightforward. You compare the direction of the A/D line to the direction of the price to see who is truly in control: buyers or sellers.
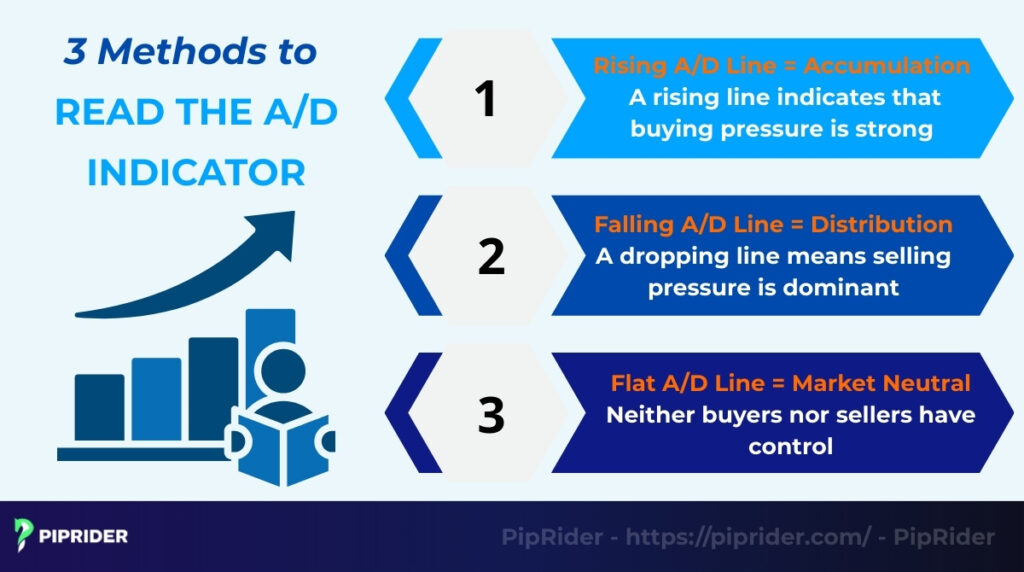
4.1. Rising A/D Line = Accumulation
A consistently rising A/D line is the classic sign of Accumulation.
- Buying pressure: A rising line indicates that buying pressure is strong. Smart money is accumulating the asset, and most volume is occurring on up-moves associated with a rising price trend.
- Trend confirmation: This confirms a healthy uptrend. If the price is dipping but the A/D line keeps making new highs, it suggests the dip is a buying opportunity.
4.2. Falling A/D Line = Distribution
Conversely, a falling A/D line indicates Distribution.
- Selling pressure: A dropping line means selling pressure is dominant. Institutions are likely distributing (selling) their positions into the market rallies.
- Warning sign: This confirms a downtrend. If the price is trying to rally but the A/D line continues to fall, it warns that the rally is weak and likely to fail.
4.3. Flat A/D Line = Market Neutral
If the A/D line moves sideways or stays relatively flat, it indicates a neutral market.
- No clear control: Neither buyers nor sellers have control. Volume is low or balanced, meaning no significant money is flowing in or out.
- Consolidation: The market is likely ranging. Traders typically stand aside and wait for a breakout in the A/D line before taking a new position.
4.4. A/D Quick Reference Cheat Sheet
| A/D Signal (Behavior) | What It Means | Best Action / Pro-Tip |
|---|---|---|
| 📈 Price Up + A/D Up | Healthy trend backed by institutional accumulation. | Favor trend-following setups (Long) on pullbacks. |
| 📉 Price Down + A/D Down | Healthy downtrend driven by steady selling pressure. | Favor trend-following setups (Short) on bounces. |
| 📈 Price Up + A/D Down | Bearish Divergence: Weak rally lacking volume (Distribution). | Tighten stop-losses; monitor for bearish reversal triggers. |
| 📉 Price Down + A/D Up | Bullish Divergence: Hidden institutional buying absorbing fear. | Avoid shorting; monitor for bullish reversal triggers. |
| 🚀 Price Breakout + A/D Breakout | Valid Breakout: The move has the capital “fuel” to sustain itself. | Consider breakout continuation or retest entries. |
| ⚠️ Price Breakout + A/D Flat | Weak Breakout: Low-volume “fakeout” designed to trap buyers. | Avoid entering; wait for a “failure to hold” reversal. |
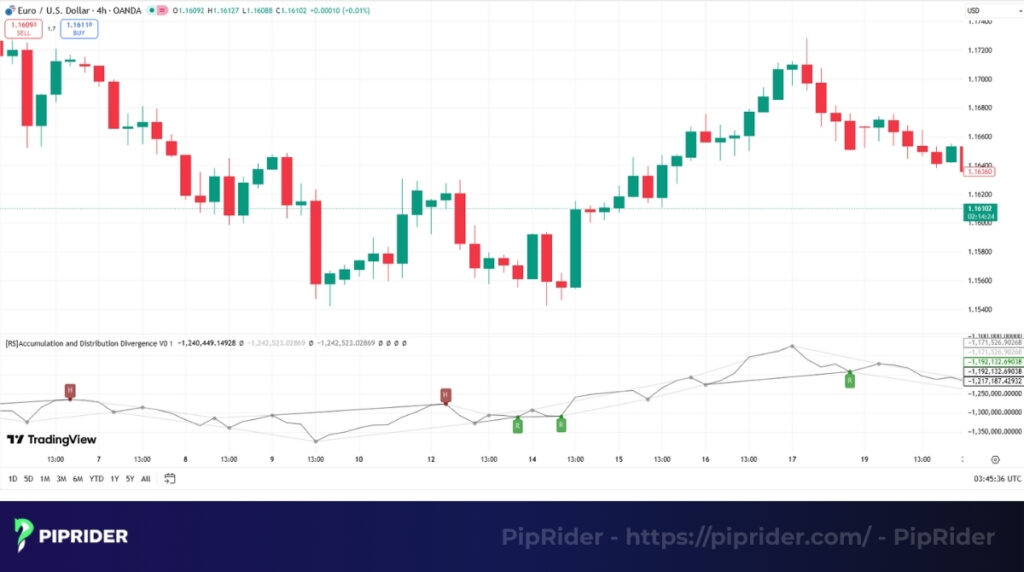
5. What Are Accumulation/Distribution Divergence Signals?
Divergence is often the most useful advanced signal on the A/D indicator. Divergence happens when the price is moving in one direction, but the A/D line is moving in the opposite direction. This disagreement can serve as an early warning that a reversal is approaching, though it requires careful confirmation.
5.1. Bullish Divergence (The Buy Signal)
Bullish divergence occurs when the price is falling to new lows, but the A/D line starts to rise.
- Hidden accumulation: Even though the price looks weak, smart money is quietly buying shares. The rising A/D line reveals this hidden buying pressure.
- Reversal opportunity: This signals that the downtrend is losing energy. Traders watch for this setup to enter a “Buy” position near the bottom.
5.2. Bearish Divergence (The Sell Signal)
Bearish divergence is the opposite. It happens when the price is rallying to new highs, but the A/D line is falling or failing to make a new high.
- Smart money exit: The price looks strong, but the “fuel” (volume) is gone. Institutions are selling into the rally, causing the A/D line to drop.
- Warning sign: This warns that the uptrend is exhausted. It is a clear signal to take profits or prepare for a downward reversal (short trade).
5.3. Hidden Divergence (The Pro Setup)
While regular divergence signals a trend reversal, hidden divergence signals trend continuation (often catching retail traders off guard).
- The Setup (Bullish Hidden Divergence): The price makes a Higher Low (a standard pullback in an uptrend), but the A/D line makes a Lower Low.
- The Logic: A plummeting A/D line means there is aggressive selling volume in the market. However, because the price formed a higher low despite this massive selling pressure, it proves that institutional buyers are heavily absorbing the supply with limit orders. Once the weak sellers are exhausted, the uptrend will resume forcefully.
6. How to Read the A/D Indicator Step-by-Step on a Live Chart
Reading the Accumulation/Distribution line in isolation often leads to premature entries. Professional traders treat the indicator as a secondary confirmation tool, not a primary trigger.
To filter out market noise and increase your probability of success, follow this systematic 6-step workflow every time you analyze a live chart:
6.1. Step 1: Define the Market Structure (Price Action First)
- The Action: Before looking at the A/D indicator, map the “battlefield.” Identify whether the broader market is in an uptrend, downtrend, or a consolidation phase by drawing major support and resistance zones on a higher timeframe (e.g., Daily or H4).
- The Logic: The A/D line is a derivative of price and volume; it is meant to confirm price structure, not replace it.
6.2. Step 2: Assess the A/D Baseline Trend
- The Action: Evaluate the general slope of the A/D line to see if it agrees with the current price action. If the price is making higher highs, check if the A/D line follows suit.
- The Logic: When price and volume flow agree, the trend is generally healthy. Your bias should remain trend-following, and you should avoid looking for reversals in a fully confirmed trend.
6.3. Step 3: Hunt for Divergence at Key Levels Only
- The Action: Look for a disagreement between price and the A/D line (Divergence) only when the price is actively testing one of the major support/resistance zones you identified in Step 1.
- The Rule: Divergence in the middle of a random price range is often just market noise. A valid signal requires the confluence of volume divergence and a structural roadblock.
6.4. Step 4: Wait for a Lagging Price Action Trigger
- The Action: Never enter a trade simply because the A/D line shows divergence. Wait for a lagging confirmation signal, such as a Bullish/Bearish Engulfing candle, a Pin Bar, or a clear Market Structure Shift (MSS).
- The Logic: The indicator tells you that volume is shifting, but it does not predict when the price will react. The A/D line can diverge for extended periods before a reversal actually occurs.
6.5. Step 5: Define Structural Stop-Loss Placement
- The Action: Place your Stop-Loss (SL) safely beyond the recent swing high or low, leaving a small buffer to survive intraday volatility spikes.
- The Logic: Because the A/D formula (based on Close Location Value) does not project specific price targets or support floors, your risk management must be dictated strictly by price structure.
6.6. Step 6: Target the Next Logical Liquidity Zone
- The Action: Set your Take-Profit (TP) at the next major structural level on the chart.
- The Logic: If the distance to your TP does not offer a favorable risk-to-reward ratio (e.g., at least 1:2), skip the setup entirely. A compelling A/D signal is effectively invalidated if the mathematical expectancy of the trade is poor.
7. How to Trade with the Accumulation/Distribution Indicator
Trading success with the A/D indicator depends on aligning your strategy with your experience level. Beginners should prioritize trend-following signals before attempting to catch market reversals through complex divergence patterns.

Strategic Roadmap for Beginners:
To build consistent results, follow this progression as you master the indicator:
- Phase 1 (Start Here): Use Trend Confirmation to ensure you are trading in the same direction as institutional money.
- Phase 2 (Intermediate): Apply Breakout Validation to filter out low-volume “fakeouts” at key structural levels.
- Phase 3 (Advanced): Practice Divergence Reversals only after you can confidently read market structure and price action triggers.
7.1. Trend Confirmation (The “Go-With-The-Flow” Strategy)
Trading in alignment with the broader money flow remains the safest approach. Identifying a healthy trend ensures that volume supports the price movement, reducing the risk of being caught in a weak rally.
- Bullish Confirmation: Look for a rising price accompanied by a rising A/D line. Such a setup proves that buyers are aggressively accumulating the asset on every move up, indicating a sustainable trend.
- Bearish Confirmation: Monitor for a falling price paired with a falling A/D line. Declining volume flow confirms that sellers are in control, and the downtrend is likely to continue until money flow stabilizes.
7.2. Breakout Validation (The “Filter” Strategy)
False breakouts are common retail traps designed to catch “FOMO” buyers. Verifying these moves with the A/D indicator significantly increases your win rate by identifying real institutional “fuel.”
- Valid Breakout: A price break above resistance must be supported by the A/D line hitting a new high. Institutional participation confirms the breakout has the momentum needed to sustain a long-term move.
- Fakeout Warning: If the price breaks a level while the A/D line remains flat or declines, the move lacks real capital backing. Avoid entering such trades, as they often reverse quickly back into the original range.
7.3. Reversal Trading (The “Divergence” Strategy)
Catching a market top or bottom offers high rewards but requires advanced technical skills. Wait for the market to signal exhaustion through volume flow before betting against the current momentum.
- The Setup: Locate a clear Bullish or Bearish Divergence on a higher timeframe (H4 or Daily). Divergence is a “leading” indicator that suggests the trend is running out of gas.
- The Trigger: Never enter on the divergence alone. Market entry requires a lagging price action signal, such as a trendline break or a market structure shift (MSS), to prove the reversal has actually begun.
7.4. Strategic Exit: Stop Loss & Take Profit
Defining your exit plan is critical because volume flow indicators do not provide specific price targets. Use market structure to manage your risk and protect your capital.
- Stop-Loss (SL): Position your SL just below the recent swing low for long trades or above the recent swing high for short trades. This placement ensures the trade is invalidated only if the money flow logic changes.
- Take-Profit (TP): Target the next major horizontal key level or aim for a minimum 1:2 Risk/Reward ratio. Taking partial profits at the first major level is recommended to secure gains during volatile sessions.
8. How Can You Combine A/D with Other Indicators for Confluence?
No single indicator is perfect, so professional traders never rely on just one tool. To increase your success rate, combine it with other technical tools to create confluence, a situation where two different indicators give the same signal at the same time.
8.1. A/D + RSI (Dual Divergence)
Combining momentum with volume creates a highly reliable reversal setup known as “dual divergence.” The Relative Strength Index (RSI) measures the speed of price changes, helping you identify overbought (above 70) or oversold (below 30) conditions, while A/D measures the money flow.
- The setup: If you see the price making a lower low, but BOTH the RSI and the A/D line are making higher lows, you have a confirmed signal.
- Why it works: This shows that both momentum and volume are shifting upward, making a reversal much more likely than if only one indicator was diverging.
8.2. A/D + Moving Averages
Confirming the long-term trend is essential before entering any trade. Moving Averages (like the 50-period or 200-period MA) provide a clear visual of the overall market direction.
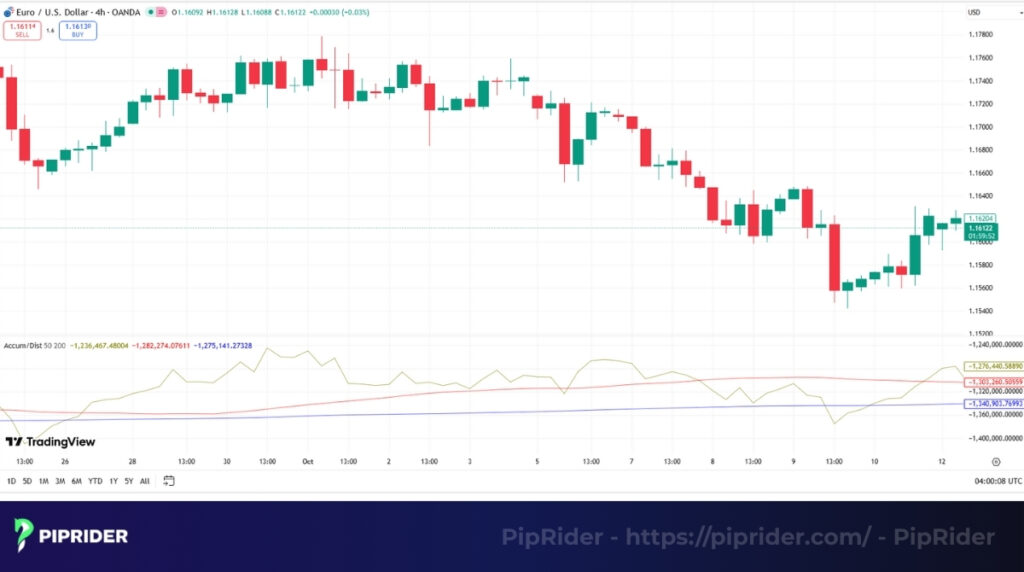
- The strategy: Use the Moving Average to define the trend (e.g., price above the 200 MA equals an uptrend). Then, look at the A/D line to ensure buying pressure is actually supporting that trend. You should avoid buying if the price is above the MA but the A/D line is crashing (divergence).
8.3. A/D + Volume Profile
While both tools analyze volume, they answer different questions: Volume Profile tells you WHERE the volume is located (Price), while A/D tells you WHO is in control of that volume (Buyers vs. Sellers).
- The Strategy: Use the Volume Profile to find horizontal support, specifically the High Volume Nodes (HVN) or Point of Control (POC). When the price pulls back into these heavy liquidity zones, watch the A/D line on a lower timeframe.
- The Trigger: If the price hits the POC and the A/D line aggressively spikes upward, it confirms that institutions are stepping in to defend their accumulation zone. If the A/D line crashes through the POC, step aside—the level will likely break.
8.4. A/D + Price Action Patterns
Timing your entry requires a specific trigger, which the A/D line does not provide. Price action patterns act as the final “green light” for entering a trade once the A/D line indicates a good setup.
- The Trigger: If you spot bullish divergence on the A/D line, do not buy immediately. Wait for a specific candlestick pattern, such as a Bullish Engulfing, Inside Bar, or a Swing Failure Pattern (SFP), to form. This proves that price is reacting to the money flow in real-time.
9. Real A/D Chart Analysis: Trade Execution Examples
Mastering the A/D indicator requires moving beyond mere observation toward structured execution. While the A/D line reveals the “Why” (Institutional Flow), Price Action provides the “When” (The Trigger).
9.1. Case Study 1: The Bullish Divergence Reversal
Identify market bottoms where retail panic selling is absorbed by institutional “Smart Money” accumulation.
The Context: An asset sits in a sustained downtrend, reaching a major historical support zone. Price prints a fresh Lower Low, creating a peak bearish sentiment among retail traders.
The A/D Signal (The Why): Market volume reveals a clear Higher Low on the indicator, diverging from price. Such a “disagreement” proves that despite falling prices, capital is flowing into buy orders under the surface.
Execution Trigger (The When): Avoid buying on the divergence alone. Wait for a Bullish Engulfing or a Pin Bar to close on the H4 or Daily chart as a final green light.
Exit Logic:
- Stop-Loss (SL): Position 10–15 pips below the lowest wick of the reversal candle.
- Take-Profit (TP): Target the nearest H4 resistance or maintain a fixed 1:2 Risk/Reward ratio.
9.2. Case Study 2: Distribution Before a Market Crash
Protect your capital from “buying the top” by spotting when a rally is no longer backed by real money.
The Context: A market enters a parabolic rally, hitting new Higher Highs. Retail sentiment reflects “extreme greed” as the price nears a macro supply zone.
The A/D Signal (The Why): The indicator prints a lower peak, known as Bearish Divergence. Such weakness confirms that institutions are distributing their positions into the buying frenzy of the crowd.
Execution Trigger (The When): Look for a Break and Close below the nearest H1 support level or a massive Bearish Engulfing pattern on the H4 chart to confirm the trend shift.
Exit Logic:
- Stop-Loss (SL): Positioned strictly above the recent “false” high wick.
- Take-Profit (TP): Target the previous major swing low or the 50% Fibonacci retracement of the entire rally.
9.3. Case Study 3: Validating a False Breakout (The Trap)
Filter out low-volume “FOMO” breakouts that often lead to heavy retail losses.
The Context: Price aggressively pierces a long-term resistance level. The move appears as a classic breakout, tempting traders to “jump in” late to avoid missing the move.
The A/D Signal (The Why): A flat or declining A/D line fails to break its own corresponding resistance. Such lack of volume support exposes the breakout as hollow and likely artificial.
Execution Trigger (The When): Wait for a “Failure to Hold”—the price must close back inside the original range. Enter a “Short” trade on the close of the candle that returns below the broken level.
Exit Logic:
- Stop-Loss (SL): Above the peak of the “fake” breakout candle.
- Take-Profit (TP): Target the opposite side of the consolidation range (Range Low).
10. Common Misreads: Avoid These 4 A/D Traps
Even with a solid strategy, traders often lose money because they misinterpret what the Accumulation/Distribution line is actually saying. To protect your capital, avoid these four common analytical traps:
10.1. Trap 1: Treating Every Divergence as a Guaranteed Reversal
One of the most expensive mistakes a new trader can make is assuming that a divergence pattern equals an immediate market U-turn.
- The Mistake: Seeing the A/D line diverge from price and instantly entering a counter-trend trade, expecting an immediate reversal.
- The Reality: Divergence is a warning sign, not a timing tool. An asset in a strong trend can show bearish divergence for days or even weeks before finally breaking down.
- The Fix: Treat divergence strictly as a signal to tighten your stop-losses or take partial profits. Never trade the reversal until a lagging price action trigger (like a trendline break) confirms the shift.
10.2. Trap 2: Ignoring Higher Timeframe Market Structure
Volume flow on a micro-level means very little if it directly contradicts the macro-trend controlled by institutional players.
- The Mistake: Zooming in on a 15-minute chart, spotting a perfect A/D breakout, and buying—only to get crushed by a macro downtrend.
- The Reality: Institutional volume flows from the top down. A short-term accumulation signal is easily overpowered if the Daily or Weekly chart is hitting major resistance.
- The Fix: Always establish your directional bias on a higher timeframe first (e.g., Daily). Only take A/D signals on lower timeframes (e.g., H1) if they align with that macro direction.
10.3. Trap 3: Using A/D Without Checking Volume Quality
Because the A/D formula is mathematically bound to volume data, applying it during low-liquidity periods generates heavily distorted signals.
- The Mistake: Trusting an A/D spike during holiday trading sessions, late Fridays, or on illiquid, low-cap altcoins/penny stocks.
- The Reality: The A/D formula multiplies the Close Location Value (CLV) by volume. If the overall trading volume is exceptionally thin, a single large order can create a massive, artificial spike in the A/D line that does not reflect true market sentiment.
- The Fix: Contextualize the move. If the A/D line surges but the actual volume bars at the bottom of your chart are significantly below average, ignore the signal.
10.4. Trap 4: Expecting Exact Entries or Price Targets
Traders often try to force the A/D line to do a job it wasn’t designed for: pinpointing exact execution prices.
- The Mistake: Trying to use the A/D line to figure out exactly where to place a limit order or where to take profit.
- The Reality: Unlike the Money Flow Index (MFI) or RSI, the A/D indicator is an unbounded cumulative line. It does not fluctuate between 0 and 100, meaning it has no mathematical “Overbought” or “Oversold” levels.
- The Fix: Rely on the A/D indicator solely to read intent (who is in control). You must switch back to raw price action (support/resistance, Fibonacci, or pivot points) to determine your exact entry levels, Stop-Loss, and Take-Profit.
11. When the Accumulation/Distribution Indicator Fails
While the A/D line is a sophisticated volume-flow tool, it is not a magic crystal ball. Understanding its mathematical limitations is crucial to avoid “false positive” signals that lead to costly mistakes.
To trade like a pro, you must exercise extreme caution or ignore the A/D line entirely during these five scenarios:
11.1. The “Price Gap” Blind Spot
The biggest mathematical flaw in Marc Chaikin’s formula is that it is strictly intra-period. It calculates the Close Location Value (CLV) based only on the current bar’s High, Low, and Close, completely ignoring the “Price Gap” from the previous session.
- The Technical Failure: If a stock gaps down 10% on an earnings miss but manages to close near the top of its new, lower daily range, the A/D line will rise.
- The Risk: The indicator will signal “accumulation” despite a massive institutional exit.
- Pro-Tip: For gap-heavy assets, cross-reference A/D with On-Balance Volume (OBV), as OBV accounts for the gap by comparing today’s close to yesterday’s close.
11.2. Low-Volume Consolidation (Market Noise)
In sideways markets where institutional participation has dried up, the A/D line often loses its predictive power.
- The Technical Failure: When volume is thin, the “weight” used in the A/D formula is negligible. Any small, random retail trade can disproportionately sway the CLV.
- The Risk: You may see “fake” divergences that imply a reversal, but in reality, there is no “Smart Money” driving the move—just random market noise.
- Pro-Tip: Only trust A/D signals when they occur alongside a breakout in volume or an expansion in volatility.
11.3. High-Impact News Spikes
During “Event Risk” (like NFP reports or Interest Rate decisions), price action is driven by high-frequency trading (HFT) algorithms and emotional spikes rather than steady accumulation.
- The Technical Failure: The rapid oscillation of the “Close” relative to the “High/Low” happens too quickly for a cumulative indicator like A/D to provide reliable data.
- The Risk: You may see a massive “Bearish Divergence” that is simply a byproduct of a 1-second price spike.
- Pro-Tip: Always wait for the “post-news settlement” (usually 15-30 minutes) before trusting any money flow indicators.
11.4. Parabolic Moves (Exhaustion vs. Distribution)
When an asset goes “parabolic” (vertical price move), the A/D line often fails to keep up with the sheer speed of the trend.
- The Technical Failure: In a “blow-off top,” daily ranges become so wide that the CLV might fluctuate wildly even if the trend is clearly one-sided.
- The Risk: You might see a “Divergence” simply because the price closed a fraction lower from its high, even if thousands of new buyers are still entering.
- Pro-Tip: In parabolic trends, Momentum Oscillators (like RSI) are generally more reliable for spotting exhaustion than volume-flow indicators.
12. Frequently asked questions about Reading Accumulation/Distribution Indicator
13. Conclusion
The Accumulation/Distribution (A/D) Indicator is a powerful tool for “looking under the hood” of the market. It reveals the hidden money flow and helps traders determine the true strength of a trend.
While it is not a magic bullet, its accuracy increases significantly when you combine it with price action and other volume tools.
For beginners, the best way to master how to read accumulation/distribution indicator signals is by practicing how to spot divergence on historical charts. Ready to test your skills? Explore the free educational guides at Piprider to deepen your market analysis today.