
The Ichimoku Kinko Hyo (commonly known as the Ichimoku Cloud) is a technical analysis system developed to visualize market equilibrium. Unlike standard indicators that typically track a single data point, Ichimoku aggregates trend direction, momentum gauges, and forward-looking support and resistance zones onto one chart.
In this guide, you will find the Ichimoku Cloud indicator in Forex explained by decoding its mechanics and outlining the standard rules for interpreting these signals.
Key Takeaways
- Ichimoku functions as an integrated system: It simultaneously shows the trend’s path, its strength, and key dynamic support/resistance levels.
- The Ichimoku Cloud is the visual foundation: Price holding above the cloud signals a bullish environment, while action below it suggests a bearish one.
- The Tenkan/Kijun cross flags strength shifts: This serves as an initial alert for a potential trend reversal.
- The Chikou Span offers final confirmation: It validates signals by checking if the path is clear of historical price congestion.
- Confluence is paramount: The highest-probability setups occur when all five elements of the system align to tell a unified story.
1. What is the Ichimoku Cloud indicator?
The Ichimoku Cloud is an all-in-one technical analysis indicator that displays a comprehensive view of the market on a single chart. Unlike simpler trend-trackers like the Half Trend Indicator which focus on a single line, Ichimoku clearly shows the prevailing trend, momentum, and key support and resistance zones simultaneously, eliminating the need for multiple separate tools.
Japanese journalist Goichi Hosoda spent decades (1930s-1960s) refining this system before releasing it publicly. Ichimoku was engineered to let a trader instantly evaluate three critical market aspects “at a single glance”:
- Trend direction: Is the market trending up, down, or is it directionless?
- Momentum: Is the current move powerful and sustained, or is it weakening and likely to fade?
- Support and resistance: Where are the key dynamic zones that price will likely respect?
The “at a glance” philosophy: Reading the market in 5 seconds
Ichimoku can help traders to make a quick market assessment by focusing on three key visual cues.
- Price vs. Kumo: Is the current price above, below, or inside the Cloud? This instantly tells traders if the trend is bullish, bearish, or in a state of consolidation.
- Future Kumo: The Cloud’s color and direction 26 periods ahead confirm trend strength. A blue cloud signals a future uptrend, while a red one indicates a downtrend. This change, known as a kumo twist, is determined by Senkou Span A’s position relative to Senkou Span B.
- Chikou Span: Is it above or below past price action in “open air”? This final check validates that the current price move is legitimate and not obstructed by historical resistance levels.
When these three elements align, traders can form a high-probability bias in just a few seconds.
2. Why Ichimoku Fits the Forex Market
Although originally designed for equities, the Ichimoku system aligns with currency market dynamics for three specific reasons:
- Capturing Sustained Trends: Forex pairs often trend for days or weeks due to macroeconomic divergence. Ichimoku is explicitly built to filter out short-term noise and keep traders positioned in these extended moves.
- Navigating Session Transitions: The Cloud projects support and resistance 26 periods into the future. This allows traders to visualize potential volatility zones ahead of key market shifts, such as the overlap between the London and New York sessions.
- Rapid Multi-Pair Scanning: Since Ichimoku relies on immediate visual cues (e.g., Price above/below Cloud), traders can scan dozens of currency pairs in minutes to identify “Grade A” setups without drawing manual trendlines.
3. How the Ichimoku Cloud works
The Ichimoku Cloud works by plotting five distinct lines that together provide a complete view of the market:
- Defining Trend and S/R: The Senkou Span A and Senkou Span B form the “Cloud” (Kumo). This Cloud is the system’s foundation.
- When the price is above the Cloud, the trend is bullish (the Cloud acts as support).
- When the price is below the Cloud, the trend is bearish (the Cloud acts as resistance).
- When price is inside the Cloud, the market is seen as consolidating or choppy.
- Signaling Momentum: The Tenkan-sen (Conversion Line) and Kijun-sen (Base Line) function like moving averages. Similar to the concept behind the Guppy Multiple Moving Average, a crossover between these two fast and slow lines signals a potential shift in market momentum.
- Confirming Signals: The Chikou Span (Lagging Span) provides confirmation by showing the current closing price shifted 26 periods into the past. If it’s above the past price, it confirms bullish strength.
The system is distinguished by the Cloud’s forward projection: it is displayed 26 periods ahead to outline potential future support and resistance zones.
4. Decoding the 5 components of Ichimoku
To master the system, traders must first understand the specific role of its five elements. Think of them as five members of a board; a trading decision is only validated when they reach a consensus.
Quick Reference: Ichimoku Formulas
| Component | Calculation Formula (Midpoints) | Shift |
| Tenkan-sen | (Highest High + Lowest Low) / 2 over 9 periods | None |
| Kijun-sen | (Highest High + Lowest Low) / 2 over 26 periods | None |
| Chikou Span | Current Closing Price | Backwards 26 periods |
| Senkou Span A | (Tenkan-sen + Kijun-sen) / 2 | Forwards 26 periods |
| Senkou Span B | (Highest High + Lowest Low) / 2 over 52 periods | Forwards 26 periods |
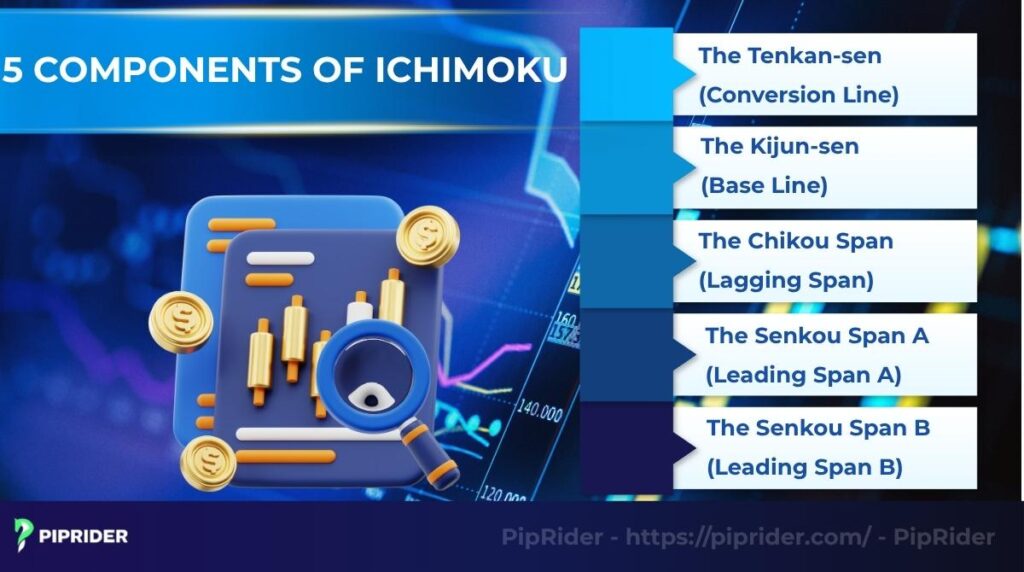
4.1. The Tenkan-sen (Conversion Line)
The Tenkan-sen is the system’s most responsive line. Think of it as the system’s “initial trigger” or a gauge of short-term momentum. It is highly sensitive to immediate price shifts.
4.2. The Kijun-sen (Base Line)
The Kijun-sen acts as the market’s medium-term equilibrium point. An upward-sloping line suggests a healthy trend, whereas a horizontal Kijun indicates a market in balance (consolidation).
4.3. The Chikou Span (Lagging Span)
This is one of Ichimoku’s most distinctive features. Its function is to provide ultimate confirmation. By looking backward, it helps traders instantly see if the current price is free from historical price congestion or recent Fractal Trading resistance levels.
4.4. The Senkou Span A (Leading Span A)
The Senkou Span A establishes the faster edge of the Ichimoku Cloud. It represents the midpoint of the short and medium-term price equilibrium, projected forward.
4.5. The Senkou Span B (Leading Span B)
The Senkou Span B serves as the Ichimoku Cloud’s slower-moving and more structurally significant boundary. It represents the long-term price equilibrium, giving the cloud its foundational strength.
5. Core Ichimoku trading strategies for Forex
Now, let’s assemble the components into actionable trading signals. The most reliable signals emerge when these events unfold in a logical sequence.
5.1. The Tenkan-sen and Kijun-sen cross
The Tenkan-sen and Kijun-sen cross is often the first indication of a potential momentum shift. It is analogous to moving average crossovers but is generally more responsive.
- Signal for bulls: This happens when the quicker Conversion Line moves across and above the slower Base Line.
- Signal for bears: This happens when the Conversion Line moves across and below the Base Line.
Important note: The signal’s validity is highly dependent on its location relative to the Ichimoku Cloud. An upward-trending cross occurring above the cloud is significantly more robust than one happening below it.
5.2. The Kumo breakout
The price exiting the cloud serves as the primary trend validation signal.It suggests that price has conclusively moved out of a consolidation phase and is embarking on a new trend.
- Bullish breakout signal: Price moves upward and secures a closing candle above the Ichimoku Cloud’s resistance.
- Bearish breakout signal: Price breaks out and closes below the Ichimoku Cloud.
This is one of the most dependable methods for entering a newly established, powerful trend.
5.3. The Chikou Span cross
The Lagging Span cross acts as the final confirmation filter. It verifies that there are no significant price hurdles in the recent past that could obstruct the new trend.
- Bullish confirmation: It moves above the price action from 26 periods ago and is in “open air” (not obstructed by past candles).
- Bearish confirmation signal: It is observed crossing below the price levels from 26 periods in the past.
6. A complete Ichimoku checklist for high-probability trades
The system’s real power comes from “confluence”, the alignment of all its elements. Here is a simple checklist for spotting a robust, high-probability setup.
6.1. Checklist for a strong buy signal
Price is positioned above the Kumo
- The forward-looking Kumo should favor the bulls, with Senkou Span A positioned higher than Senkou Span B.
- The Conversion Line has crossed above the Base Line.
- The Lagging Span is above the price from 26 periods ago and has clear space to move up.
- An upward trajectory on the Base Line provides additional validation for the trend’s positive strength.
6.2. Checklist for a strong sell signal
Price is positioned below the Kumo
- The forward-looking Kumo should favor the bears, with Senkou Span A positioned lower than Senkou Span B.
- The Conversion Line has crossed below the Base Line.
- The Lagging Span is positioned below the price from 26 periods ago.
- The Base Line is angled downwards.
6.3. Defining your exit strategy
Knowing how to exit a trade is just as critical as entering it. The Ichimoku system provides its own logical levels for managing risk and protecting profits.
- Using the Base Line: For a long position, traders can place a stop-loss just below it. This line represents the market’s medium-term equilibrium, and a close below it signals a potential shift in strength. For a short position, traders would place one just above.
- Using the Kumo: For a more conservative stop-loss, place it on the opposite side of the cloud. For a long position, this means placing the stop-loss below this zone. The Kumo is a strong support/resistance area, and a breakthrough indicates a significant change in the trend.
A price break below these levels is a strong signal that the initial trade setup may be invalidated.
7. Real-World Trading Examples
Theory is essential, but seeing the Ichimoku system in action brings the concepts to life. Below are two examples demonstrating how a high-probability setup aligns with the checklist from Section 6.
7.1. The Bullish Breakout (Buy Setup)
This chart illustrates a classic high-confluence buy signal on the EUR/USD pair moving out of consolidation.
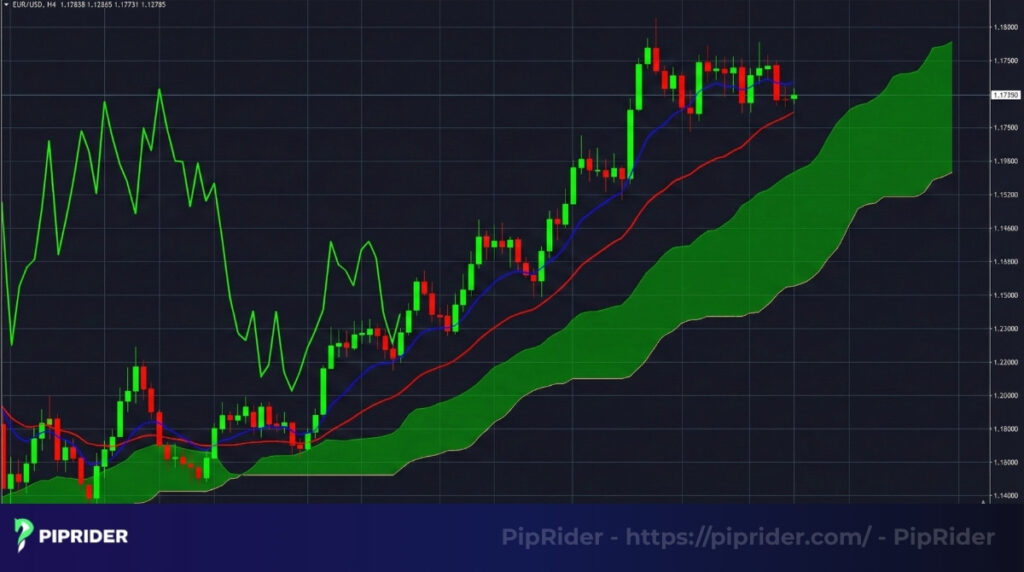
Why this works:
- Price Action: The candles have forcefully broken out and closed above the Green Cloud, turning resistance into support.
- Momentum: The Tenkan-sen (Blue) has crossed above the Kijun-sen (Red), confirming upward momentum.
- Confirmation: The Chikou Span (Green line on the left) is floating freely above historical price action, indicating no overhead resistance.
7.2. The Bearish Reversal (Sell Setup)
This example shows the GBP/JPY transitioning from an uptrend into a confirmed downtrend.
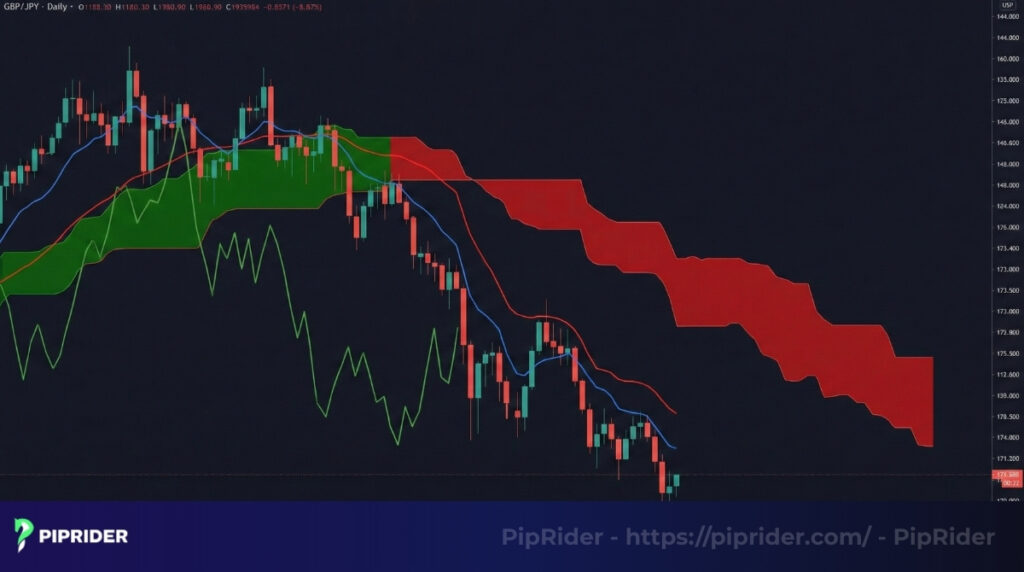
Why this works:
- Price Action: Price has dropped significantly below the Cloud, and the future Cloud has twisted to Red.
- Momentum: The Tenkan-sen (Blue) has crossed below the Kijun-sen (Red).
- Confirmation: The Chikou Span has crashed below past price candles, confirming that the path of least resistance is now downwards.
8. Advanced Ichimoku combination strategies
While Ichimoku is a powerful methodology on its own, its signals can be further refined by pairing it with complementary indicators. This practice helps filter out market noise and validate trades with greater confidence.
8.1. Ichimoku and RSI for filtering entries
The Relative Strength Index (RSI) is an excellent tool for assessing short-term momentum exhaustion. It can be used to avoid buying at a local top.
- Strategy: In a confirmed upward-trending trend (price above Kumo), await a pullback that brings the RSI close to the 50 level. A subsequent bounce from this level provides an excellent, high-probability entry point to rejoin the main trend.
- Benefit: This approach prevents traders from chasing an overextended trend and allows for entry during a consolidation period, often resulting in a superior risk/reward ratio.
8.2. Ichimoku and MACD for momentum confirmation
The MACD is an outstanding tool for corroborating momentum. An Ichimoku signal carries much more weight if the MACD tells the same story.
- Strategy: Look for an upward-trending price exiting the cloud. This signal’s potency is greatly increased if it’s accompanied by an upward-trending MACD crossover (when the MACD line moves above the signal line) at roughly the same time.
- Benefit: Creates a “dual-engine” confirmation of strength, lending much higher confidence that a new trend possesses legitimate underlying power.
8.3. Ichimoku and Tick Volume (Volatility Proxy)
In spot Forex, most platforms display tick volume (the count of incoming price updates) rather than centralized traded volume. While not perfect, this serves as a useful proxy for market activity.
- Strategy: When identifying a Cloud breakout, check for a spike in tick volume. High tick counts indicate increased market participation, suggesting the move has genuine momentum behind it.
- Important Note: Tick volume is broker-dependent and varies between platforms. Always use it as a secondary confirmation rather than a primary signal.
9. Pros & Cons: Is Ichimoku Right for You?
While powerful, Ichimoku is not perfect. Understanding its limitations is just as important as knowing its strengths to avoid costly mistakes.
| Pros (The Edge) | Cons (The Limitations) |
| All-in-One View: Displays trend, momentum, and S/R simultaneously. | Chart Clutter: The 5 distinct lines can obscure price action, causing “analysis paralysis.” |
| Future Projection: The Cloud identifies support/resistance zones 26 periods ahead. | Lagging Nature: As a moving average-based tool, signals often appear after a trend is underway. |
| Noise Filter: The Cloud effectively ignores minor corrections in a strong trend. | Steep Learning Curve: It is visually intimidating and less intuitive than a simple RSI. |
Critical Limitations:
- The “Whipsaw” Risk: Ichimoku is a trend-following system. During sideways consolidation (ranging markets), the lines will flatten and tangle, generating frequent false signals. Do not use it in a flat market.
- Late Entries: Because the Cloud confirms trends rather than predicting them, you will rarely catch the exact bottom or top. Accept that you are trading the “meat” of the move, not the extremities.
10. Common mistakes with Ichimoku and how to avoid them
Like any complex tool, Ichimoku can be misapplied. Traders new to the system frequently fall into the same predictable pitfalls. Recognizing them is the first step toward avoiding them.
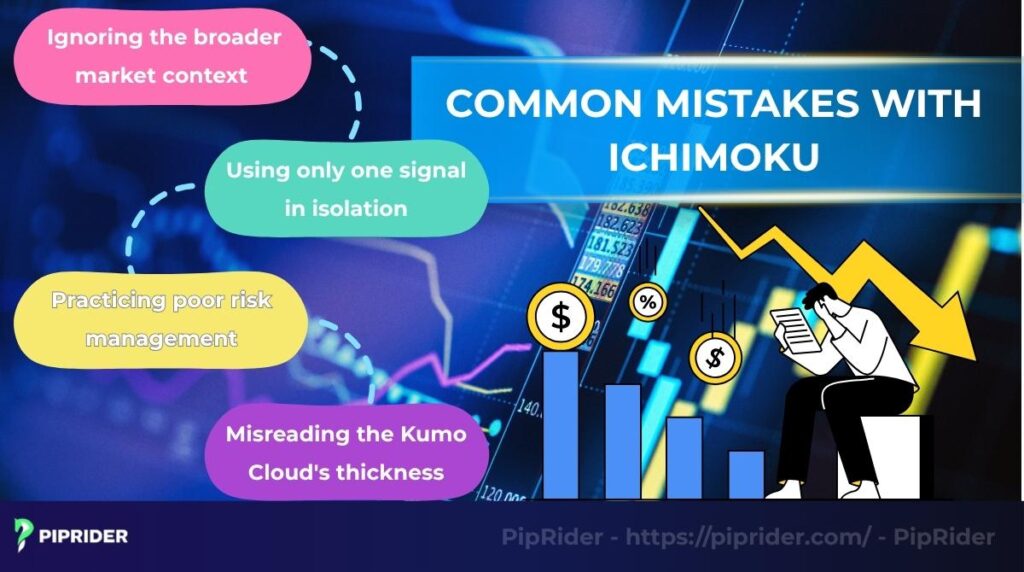
10.1. Ignoring Multi-Timeframe Context
- The Mistake: Buying on a lower timeframe (e.g., H1) while the price is heading directly into a thick bearish Cloud on the Daily chart.
- The Fix: Always check the next higher timeframe first. If the Daily Kumo is Red (Bearish), ignore any Buy signals on the H1, no matter how good they look.
10.2. Acting on Isolated Signals
- The Mistake: entering a trade the moment Price breaks out of the Cloud without waiting for secondary confirmation.
- The Fix: Wait for “consensus.” A Kumo breakout is only a high-probability setup if it is supported by a TK Cross and a clear Chikou Span.
10.3. Placing Stops Too Close
- The Mistake: Setting a tight stop-loss just below the entry candle to minimize risk, often leading to premature stop-outs during normal volatility.
- The Fix: Use the indicator’s natural barriers. Place stops on the opposite side of the Kijun-sen or, for maximum safety, on the far side of the Kumo Cloud.
10.4. Misjudging Cloud Thickness
- The Mistake: Assuming a thin, flat Cloud will act as strong support or resistance.
- The Fix: Remember that Thickness = Strength. A thick cloud represents heavy historical volume and strong support. A thin cloud indicates low volatility and is easily broken by price.
11. Pro tips for using the Ichimoku Cloud in Forex
To move from an intermediate to an advanced user, stop viewing the lines merely as support/resistance barriers and start seeing them as equilibrium zones.
11.1. The “Magnet Effect” of Flat Lines
While sloping lines indicate a trend, a Flat Senkou Span B or a Flat Kijun-sen tells a different story.
- The Secret: A flat line represents a price level that the market has not moved away from for 26 or 52 periods. It acts as a powerful magnet.
- Action: If price moves too far away from a flat Cloud, do not chase it. Expect a “rubber band” effect where price snaps back to test the flat line before resuming the trend.
11.2. Pyramiding on Kijun-sen Bounces
Since Ichimoku signals can be late (see Limitations), trying to catch the exact bottom is futile. Instead, Focus on maximizing the “meat” of the trend.
- The Strategy: Once a trend is established, use the Kijun-sen (Base Line) as a dynamic value zone. Place limit orders at the Kijun-sen.
- The Edge: This allows you to add to your winning position (pyramiding) safely during pullbacks, significantly increasing your Reward-to-Risk ratio without trying to predict market turns.
11.3. The H4 “Sweet Spot”
Forex markets are noisy on lower timeframes. The Ichimoku Cloud is mathematically designed to smooth out volatility, but it needs sufficient data to function.
- The Rule: Avoid the M15 chart or lower. The 4-Hour (H4) chart provides the perfect balance between capturing the trend early enough and filtering out intraday noise, making the Cloud’s projection far more reliable.
12. Frequently asked questions about the Ichimoku Cloud indicator
13. Conclusion
The Ichimoku Kinko Hyo stands out as a uniquely potent and visual analysis tool that, once mastered, can bring exceptional clarity to your trading strategies. By offering a complete perspective on trend, strength, and support/resistance levels, it empowers you to make more informed choices.
With the Ichimoku Cloud indicator in Forex explained through this guide, you now have a comprehensive roadmap to harness the full capabilities of this system and improve your trading performance.
If you’re still unsure about trading indicators, follow Piprider to read more interesting articles in our Learn Forex category.


