Many traders are familiar with momentum oscillators like the MACD. However, the MACD only looks at price. The Klinger Oscillator is a more advanced technical indicator because it combines both price and volume into one signal.
This oscillator is designed to measure the long-term trend of money flow. It helps traders assess if volume participation actually supports the price trend or if a reversal is imminent. This guide explains how the Klinger Oscillator works, how to read its signals, and how traders use it to find potential price reversals.
Key Takeaways
- The Klinger Oscillator is a momentum indicator that tracks both price and volume to measure the trend of money flow.
- It was developed by Stephen Klinger to identify the underlying strength or weakness of price trends.
- Think of Klinger as a “MACD for volume.” It confirms price momentum with volume data, unlike the MACD which only tracks price.
- Traders watch for crossovers (with its signal line) for entry/exit triggers and divergences (between the indicator and price) to spot potential price reversals.
- It helps confirm the long-term trend (above/below zero) and identify potential market turning points.
1. What Is the Klinger Oscillator?
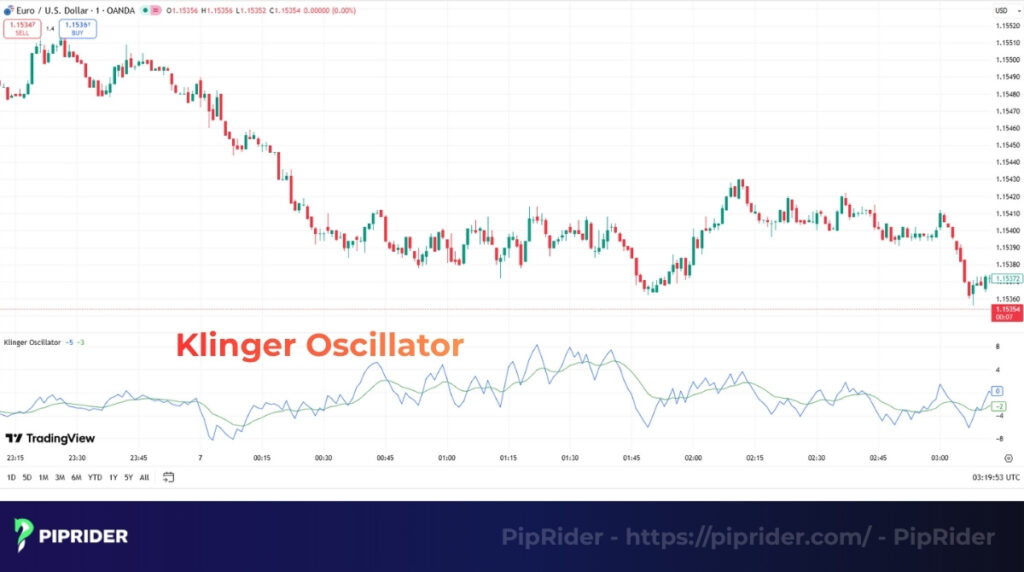
The Klinger Volume Oscillator (KVO) is a momentum indicator designed to combine both price and volume to identify the long-term trend direction while still being sensitive enough to react to short-term fluctuations.
Developed by Stephen Klinger, this technical analysis indicator measures the “Volume Force” or the strength of money flowing in and out of an asset. It does this by comparing two exponential moving averages (EMAs) of this force: a fast 34-period EMA and a slow 55-period EMA (Corporate Finance Institute, n.d.).
This creates a main oscillator line. A 13-period EMA of this oscillator is then typically added as a signal line. Traders watch for two main things:
- Crossovers: When the Klinger line crosses its signal line.
- Divergences: When the asset’s price makes a new high or low, but the Klinger Oscillator fails to do the same. This signals that the money flow does not support the price, warning of a potential reversal.
2. How the Klinger Oscillator Works
The Klinger Oscillator works by turning complex market data price and volume into a simple oscillator. It measures the “Volume Force” (sometimes called force volume), or the strength of money flowing in or out of a security or an asset.
2.1. Core Concept
The core concept is to measure “smart money.” Stephen Klinger believed that traders must look at Cumulative Volume Flow (CVF) to see if institutions are buying or selling.
- Rising Oscillator: Confirms that volume accumulation is occurring. The uptrend is healthy and supported by strong market participation.
- When the oscillator is falling, it signals potential weakness and that “smart money” is selling.
Some traders prefer comparing Klinger and Chaikin oscillators since both track volume accumulation. The key difference is Klinger uses dual EMAs while Chaikin focuses on the high-low range.
2.2. Formula of the Klinger Oscillator
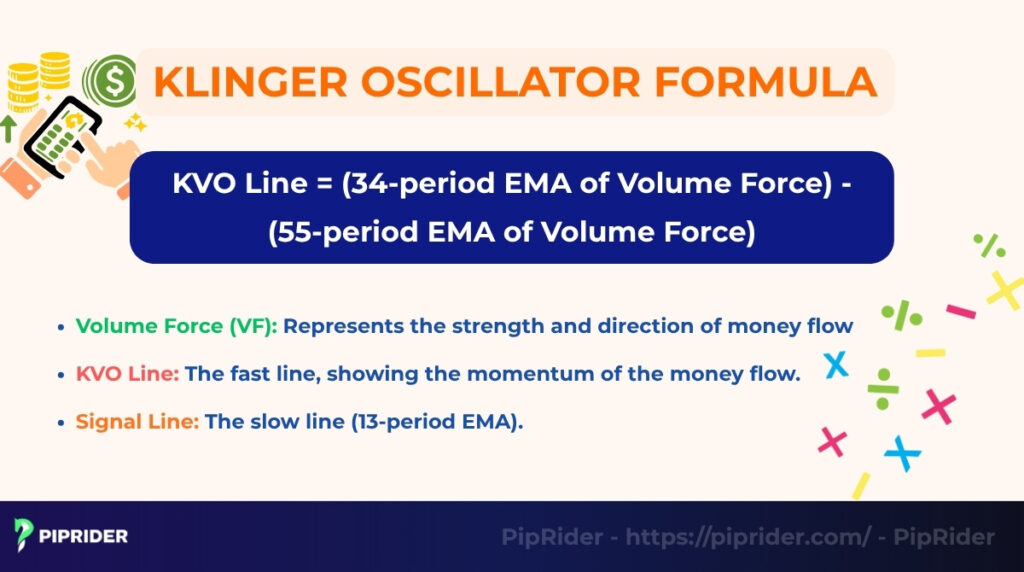
While trading platforms calculate this automatically, understanding the logic helps you trust the signals. The Klinger Oscillator is derived from Volume Force (VF), constructed in a four-step logical process.
The Core Formula:
The “Volume Force” (VF) Breakdown:
Instead of just looking at raw volume, Stephen Klinger created a sophisticated algorithm to determine if volume is truly bullish (accumulation) or bearish (distribution).
🧮 How Volume Force is Calculated (The 4-Step Flow)
- Step 1: Trend Direction (Typical Price): The algorithm compares the average price of the current bar (High + Low + Close / 3) with the previous bar.
Result: Determines if the immediate pressure is Positive (+1) or Negative (-1). - Step 2: Volatility Check (Daily Range): It measures the distance between the High and Low prices. This prevents the indicator from overreacting to volume spikes that happen within a very narrow, quiet price range.
- Step 3: Volume Force (VF): The raw volume is multiplied by the Trend Direction (Step 1) and adjusted by the Volatility (Step 2).
Result: A “Force” number that reflects buying/selling pressure that is significant enough to move price. - Step 4: Smoothing (The Oscillator): Finally, the raw VF is smoothed using exponential moving averages (fast 34 and slow 55) to create the fluctuating KVO line you see on the chart.
Why this matters: This logic allows the Klinger Oscillator to distinguish between “strong volume” (which drives trends) and “churn” (high volume with no price progress), offering a clearer picture of market intent than volume alone.
3. Best Settings for Klinger Oscillator
While the Klinger Oscillator calculates complex data, its settings are straightforward. Choosing the right parameters depends entirely on your trading style and timeframe.
Most trading platforms (like TradingView or MT4) use the default settings developed by Stephen Klinger. However, traders can adjust these to make the indicator faster (more sensitive) or slower (smoother).
| Trading Style | Fast EMA | Slow EMA | Signal | Best Timeframe |
|---|---|---|---|---|
| Swing Trading (Default) | 34 | 55 | 13 | Daily (D1), 4-Hour (H4) |
| Intraday / Day Trading | 21 | 34 | 13 | 1-Hour (H1), 15-Min (M15) |
4. Interpreting the Klinger Oscillator Signals
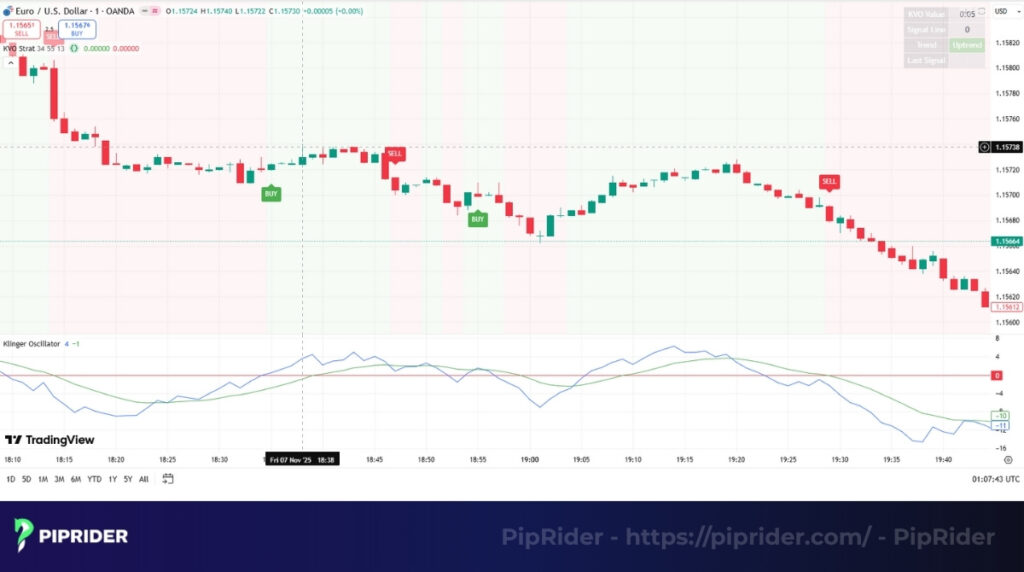
The Klinger Oscillator generates trading signals in two main ways: through crossovers (with its signal line) and through divergences (with the price).
Here is a simple breakdown of the four most common signals:
| Signal Type | Description | Trader Action |
|---|---|---|
| Bullish Crossover | The KVO line (fast) crosses ABOVE its signal line (slow). | Potential Buy Signal (Timing entry). |
| Bearish Crossover | The KVO line (fast) crosses BELOW its signal line (slow). | Potential Sell Signal (Timing exit). |
| Zero-Line Crossover | The KVO line crosses the Center (0) Line. | Trend Confirmation. Above 0 = Accumulation (Up). Below 0 = Distribution (Down). |
| Bullish Divergence | Price makes a New Low, but Klinger makes a Higher Low. | Warning: Selling pressure is weakening. Expect a Reversal Up. |
| Bearish Divergence | Price makes a New High, but Klinger makes a Lower High. | Warning: Buying pressure is weakening. Expect a Reversal Down. |
5. How to Use the Klinger Oscillator in Trading
Traders use the Klinger Oscillator for more than just its basic signals. It is a flexible tool for identifying trend strength, spotting reversals, and confirming breakouts.
5.1. Identifying Trend Strength
One of the Klinger’s main jobs is to determine if the “smart money” (volume) supports the current price trend.
Traders watch the oscillator’s position relative to its zero line (or centerline).
- If the KVO is above 0: The long-term money flow is positive (bullish). These zero-line crossovers are the first indication of a major trend shift, providing a similar perspective to market breadth indicators like the advance decline line regarding the overall health of the market.
- If the KVO is below 0: The long-term money flow is negative (bearish).
A strong, healthy trend exists when the KVO and the price move “in-sync.” For example, if the price is making new highs and the Klinger Oscillator is also rising and staying above its zero line, it confirms the uptrend is strong.
5.2. Spotting Divergences
This is the most popular way to use the Klinger Volume Oscillator. A divergence occurs when the price and the oscillator move in opposite directions, warning that the current trend is losing momentum and a reversal may be near.
- Bullish Divergence (A Buy Signal): The price makes a new low, but the Klinger makes a higher low. This signals that selling volume is drying up and the price may be ready to reverse upwards.
- Bearish Divergence (A Sell Signal): The price makes a new high, but the Klinger makes a lower high. This signals that buying volume is weakening and the price may be ready to reverse downwards.
This is a very common technique in swing trading and is a classic example of volume-based analysis.
5.3. Confirming Breakouts
Price breakouts on a chart can often be “false breakouts” (or fake-outs). The Klinger helps traders confirm if a breakout is real by checking if volume supports the move.
If a stock’s price breaks above a key resistance level, a trader will look for the Klinger Oscillator to confirm this. A strong confirmation signal is when the KVO also rises above the zero line (or centerline) and crosses its signal line, showing that long-term money flow has turned positive and supports the new price high.
6. Klinger Oscillator vs. Other Indicators
The Klinger Oscillator is often compared to other popular indicators, especially the MACD and On-Balance Volume (OBV). Understanding their key differences helps traders know what signal they are actually getting. This comparison also helps link these related concepts, improving topical authority.
Traders looking for simpler volume analysis might consider the percentage volume oscillator as an alternative. The PVO focuses purely on volume momentum without blending price data like the Klinger does.
| Indicator | Primary Focus | Key Difference / Advantage |
|---|---|---|
| Klinger Oscillator (KVO) | Price + Volume Combined | Combines trend direction (price) with money flow (volume) into a single, smoothed signal. |
| MACD | Price Momentum Only | Popular trend tool, but ignores volume completely. Only compares price averages. |
| On-Balance Volume (OBV) | Volume Flow Only | Tracks cumulative volume pressure but is unsmoothed and doesn’t measure price momentum directly. |
7. Trading Strategies Using Klinger Oscillator
The Klinger is a flexible tool. Traders can use it in several different strategies, from confirming trends to spotting trading opportunities. Here are three common examples.
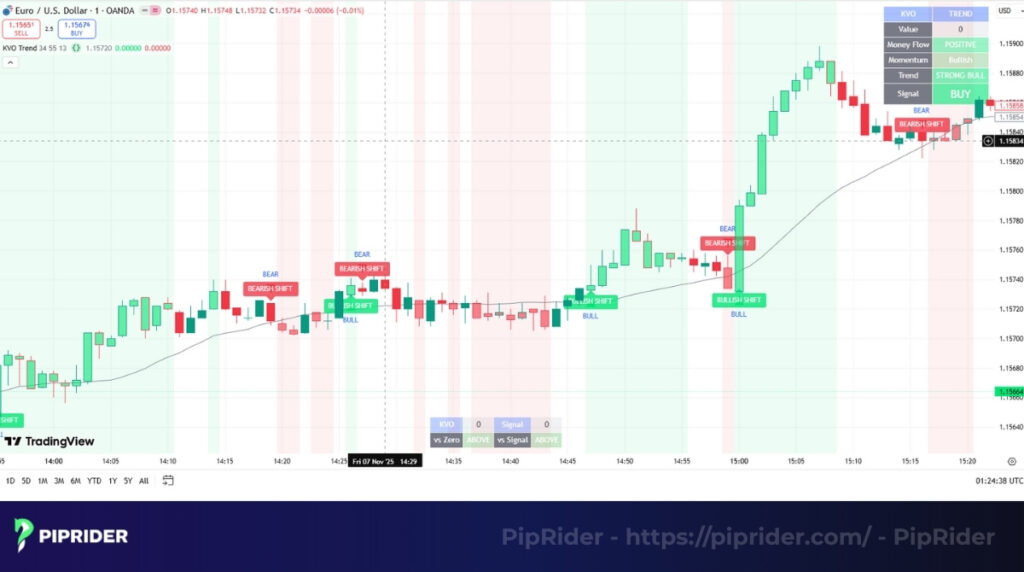
7.1. Strategy 1: Trend Confirmation
Trend confirmation is the most basic trading strategy. It uses the KVO’s zero line to determine the main trend and the signal line for the entry trigger.
- Buy Signal: A trader looks for a Buy Signal when the KVO line is above the 0 line (confirming a long-term uptrend) AND the KVO line crosses above its 13-period signal line.
- Sell Signal: A trader looks for a Sell Signal when the KVO line is below the 0 line (confirming a long-term downtrend) AND the KVO line crosses below its 13-period signal line.
7.2. Strategy 2: Divergence Reversal Setup
Divergence reversal setup is the most popular way to use the KVO. A trader will look for a divergence between the price and the KVO, often on a higher timeframe like the Daily (D1) or 4-Hour (H4) chart.
A divergence is only a warning sign, not a full signal. To confirm the trade, many traders will combine the KVO divergence with a signal from another technical analysis indicator, such as an RSI overbought/oversold signal or an MACD crossover.
7.3. Strategy 3: Combine with Moving Averages
This strategy blends a classic price-based trend indicator with the KVO’s volume confirmation.
- Step 1 (Find Trend): A trader first uses a long-term Moving Average (MA), like the 50-day or 200-day MA, to identify the main, primary trend. (e.g., if the price is above the 200-day MA, they only look for buy signals).
- Step 2 (Find Entry): Once the main trend is confirmed, the trader then uses the Klinger Oscillator to find a safe entry point. For example, in an uptrend, they will wait for the price to pull back (dip) and then enter only when the KVO shows a bullish crossover.
8. Strengths and Limitations of the Klinger Oscillator
Like any technical tool, the Klinger Oscillator is not perfect. It is important for traders to understand its advantages (why to use it) and its weaknesses (when to be careful).
8.1. Strengths (Pros)
The KVO’s unique calculation method provides several key advantages for macro and swing traders:
- Combines price and volume: Its biggest advantage is that it blends price momentum and volume flow. This provides a deeper, more confirmed signal than price-only indicators (like the MACD).
- Excellent for divergence: The Klinger is highly effective at spotting divergences. When price makes a new high but the oscillator makes a lower high, it’s a strong warning that buying pressure (volume) is fading.
- Good for swing trading: The indicator’s default settings (34 and 55) are slow. This makes it well-suited for swing traders and medium-term traders who want to catch the larger, multi-day or multi-week trends.
8.2. Limitations (Cons)
However, the Klinger Oscillator has constraints that limit its effectiveness in certain market environments:
- Noisy in sideways markets: Like most oscillators, the KVO can give false signals (noise) when the market is choppy or moving sideways. It works best in clear trending markets.
- Lagging indicator: Because it is based on Exponential Moving Averages (EMAs), it is a lagging indicator. The buy or sell signals will always appear after the price has already started to reverse.
- Not suitable for scalping: This financial tool is too slow for scalping or very high-speed day trading. The signals are not designed to catch tiny, rapid price moves.
9. Common Mistakes to Avoid
Even pro traders make mistakes with the Klinger Oscillator. Being aware of these 5 common pitfalls will save you from unnecessary losses.
Mistake 1: Trading in Sideways Markets
The Klinger Oscillator is very sensitive. When the market is flat (ranging between support and resistance), the indicator will produce constant “false crossovers,” leading to multiple losing trades.
- The Fix: Only look for signals when the market is trending or expanding. If the price is stuck in a tight box, ignore the Klinger until a breakout occurs.
Mistake 2: Entering on Divergence Alone
A common error is buying immediately just because a Bullish Divergence appears. Divergence is merely a warning that momentum is changing; it is not a signal to trade yet. A stock can remain divergent for weeks while the price continues to drop.
- The Fix: Always wait for a “Trigger.” Use the divergence to get ready, but only enter the trade when you get a confirmation, such as a Signal Line Crossover or a break above a trendline.
Mistake 3: Fighting the Major Trend
Taking a “Sell” signal while the stock is in a massive long-term uptrend (e.g., price is well above the 200-day Moving Average) is a low-probability bet.
- The Fix: Don’t fight the tide. If the long-term trend is Up, ignore the short-term Sell signals and focus only on the Buy signals (dips).
Mistake 4: Blind Trust in Forex Tick Volume
Forex traders often assume “tick volume” is 100% accurate. However, tick volume depends on your specific broker’s data feed. If your broker has low liquidity, the Klinger signal might be distorted.
- The Fix: Treat tick volume as a helpful approximation, not an absolute fact. Cross-reference with price action to ensure the signal makes sense.
Mistake 5: No Clear Exit Strategy
Many traders enter a trade perfectly but don’t know when to get out, turning a winner into a loser.
- The Fix (The Cross-Back Rule): Establish a mechanical exit rule. A simple method is to close your position when the KVO line crosses back across the signal line in the opposite direction. For example, if you bought on a Bullish Crossover, sell immediately when the lines make a Bearish Crossover.
10. Example of the Klinger Oscillator in Action
Theory is best understood with real-world application. Since the Klinger Oscillator is versatile, it can be applied to both centralized markets (Stocks) and decentralized markets (Forex/Crypto).
Below are two distinct scenarios showing how to read signals in these different environments: an accumulation setup on a stock (using real volume) and a reversal setup on a currency pair (using tick volume).
10.1. Bullish Example: Accumulation on Stock (Real Volume)
- Asset: Apple (AAPL) – Daily Chart.
- Scenario: The stock price has been moving sideways in a flat, boring range for several weeks after a correction.
- Klinger Signal: While the price is flat, the trader notices the KVO line is steadily rising and has crossed above its zero line.
- What it means: This indicates Volume Accumulation. Even though the price hasn’t moved yet, the rising “Volume Force” shows that buyers are aggressively entering the market. This “hidden” buying pressure often precedes a valid breakout to the upside.
10.2. Bearish Example: Divergence on Forex (Tick Volume)
- Asset: EUR/USD – 4-Hour Chart.
- Scenario: The pair is in a strong uptrend and pushes to make a fresh new high.
- Klinger Signal: As the price hits the new peak, the Klinger Oscillator makes a lower high (Bearish Divergence).
- What it means: This signals Exhaustion. Since Forex uses “Tick Volume” (activity counts), this divergence tells us that trading activity is drying up at these high prices. The market is running out of steam, warning the trader to tighten stop-losses or prepare for a potential reversal.
⚠️ Important Note on Forex Volume: Unlike stocks, the Forex market is decentralized and has no central volume data. The Klinger Oscillator here uses “Tick Volume” (the number of price changes per bar) as a proxy. While not perfect, tick volume is highly correlated with true liquidity and is effective for spotting divergences in major pairs like EUR/USD or GBP/JPY.
11. Frequently asked questions about Klinger Oscillator
12. The Bottom Line
The Klinger Oscillator is a powerful tool, especially when it is combined with other momentum indicators or trend-following filters. It provides a unique insight by adding volume data to a momentum reading.
However, traders should avoid using it in isolation, as it can produce false signals in choppy markets. For optimal results, combine the KVO with price action analysis (like support and resistance) and basic volume confirmation.
To learn more about the best technical indicators and how to build a complete trading strategy, explore the many in-depth guides at PipRider.