
Price action tells you what is happening, but volume reveals the conviction behind the move. The Price Volume Trend indicator (PVT) is a powerful tool designed to connect these two critical pieces of information. By integrating the percentage change in an asset’s price with its trading volume, the PVT offers a more nuanced look into money flow and trend strength than many other tools.
This comprehensive guide will break down everything from the formula to practical PVT trading strategies you can apply.
Key Takeaways
- The PVT is a momentum indicator that tracks cumulative volume, giving more weight to periods with significant price changes.
- Unlike On-Balance Volume, the Price Volume Trend considers the magnitude of price moves, offering potentially earlier and more sensitive signals.
- It is primarily used to confirm the strength of a trend and to spot potential reversals through bullish and bearish divergences.
- This indicator is most effective when used to confirm signals from other technical analysis tools like moving averages or the RSI.
- This guide focuses on interpreting and applying the volume trend indicator for real-world analysis and trading setups.
1. Understanding the Price Volume Trend Indicator
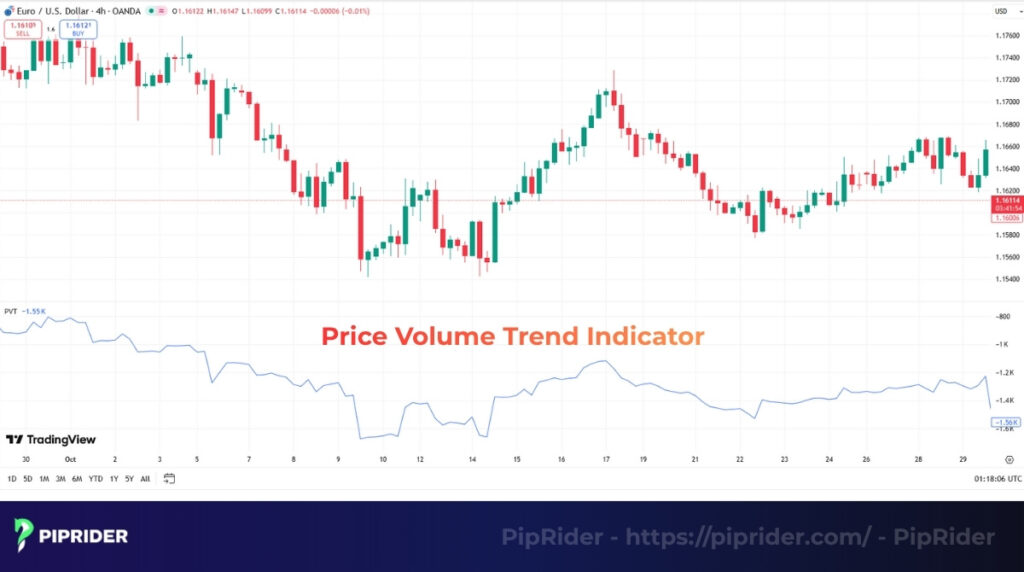
The Price Volume Trend (PVT) is a technical indicator that measures momentum by combining an asset’s price and volume (or a tick volume proxy in Forex) into a single cumulative line (Commodity.com, n.d.).
PVT’s primary purpose is to aid in trend identification, gauge the strength of a trend, and confirm price movements. By weighting volume with the percentage of price change, it helps traders see if a trend is backed by broad market participation and genuine volume-weighted demand.
The price and volume trend indicator stands apart due to its unique methodology. Here’s a quick comparison to other common tools:
- vs. On-Balance Volume (OBV): The PVT is considered more sensitive. While OBV adds or subtracts the entire daily volume based only on direction, the PVT incorporates the magnitude of the price change, offering a more nuanced view of market conviction.
- vs. Money Flow Index (MFI): The MFI is a bounded oscillator, scaled from 0 to 100, used to identify overbought or oversold conditions. In contrast, the PVT is an unbounded, cumulative line focused purely on trend confirmation and money flow.
- vs. Accumulation/Distribution (A/D) Line: The PVT’s calculation is simpler, using only the percentage change from the previous close. The A/D Line uses a more complex formula involving the high, low, and close to measure intraday pressure.
2. How the Price Volume Trend Works
The logic of the Volume Price Trend is that not all trading activity carries equal weight. A 5% price surge backed by heavy trading shows far more conviction than a 0.5% nudge on the same share turnover. To capture this, the PVT multiplies a period’s traded shares by its percentage price change, measuring a trend’s true force as a reflection of supply and demand.
This mechanism makes the PVT an excellent tool for evaluating the underlying strength of a price move. When the price and the PVT rise together, it supports the validity of the uptrend and adds confidence that the move is sustainable. Conversely, if the price inches up while the indicator is flat or falling, it acts as an early warning that the move lacks volume-weighted conviction and could be vulnerable to a reversal.
Market Structure Caveat: The accuracy of the PVT relies entirely on the quality of the volume data. Therefore, “volume-weighted demand” is only an observable reality in centralized markets (like Stocks, ETFs, and Futures) where absolute share turnover is recorded. In decentralized Over-The-Counter (OTC) markets like Spot Forex, platforms only provide “Tick Volume” (price change frequency). Applying the PVT to Tick Volume will yield skewed results that do not accurately represent real market conviction.
3. Formula and Calculation of the PVT
The Price Volume Trend is a cumulative indicator, meaning its current value is always based on its previous value. The calculation adds a volume-weighted amount to the prior period’s total.
3.1. The Formula
PVT = Previous PVT + [((Current Close – Previous Close) / Previous Close) * Volume]
Where:
- Previous PVT: The value of the PVT from the prior period.
- Current Close: The closing price of the current period.
- Previous Close: The closing price of the prior period.
- Volume: The total volume traded during the current period.
The key part of this formula is that it multiplies the period’s volume by the percentage price change. This result is then added to (or subtracted from) the previous PVT value to create a continuous line.
3.2. Step-by-Step Calculation Example
To see how this works, let’s break it down with a simple two-day example for a stock.
- Previous PVT (starting value) = 200,000
- Previous Day’s Close = $50.00
- Current Day’s Close = $51.00
- Current Day’s Volume = 100,000 shares
Calculation Steps:
Step 1: Calculate the percentage price change
( ($51.00 – $50.00) / $50.00 ) = 0.02 (a +2% move)
Step 2: Apply the PVT formula
New PVT = 200,000 + (0.02 * 100,000) = 200,000 + 2,000 = 202,000
The PVT line moves up from 200,000 to 202,000, reflecting positive, volume-weighted money flow.
Comparison with OBV:
For the same data, the On-Balance Volume (OBV) calculation would simply add the entire volume since the price closed higher:
New OBV = Previous OBV + 100,000
This comparison highlights the PVT’s sensitivity. The PVT’s value increased by only 2,000 because the price move was relatively small (+2%). The OBV, however, registered a massive increase of 100,000. This shows how the PVT adjusts its reading based on the conviction behind the price move, not just its direction.
4. How to Interpret the Price Volume Trend
Interpreting the Price Volume Trend indicator is less about its absolute numerical value, since it is an unbounded cumulative line, and more about its trajectory relative to price action. Technical analysts typically look for three primary structural signals to gain a statistical edge.
4.1. Identifying Trend Direction (The Signal Line Approach)
The simplest interpretation is to follow the indicator’s slope as a proxy for directional participation.
- Bullish Phase: A rising PVT line confirms an uptrend, showing sustained volume-weighted demand.
- Bearish Phase: A falling PVT line confirms a downtrend, indicating dominant volume-weighted supply.
- Pro Tip (Objective Reading): Because visual slopes can be subjective, professional traders often overlay a Moving Average (e.g., a 20-period SMA) directly onto the PVT line. When the PVT crosses above its own SMA, it objectively signals bullish momentum flow, and vice versa.
4.2. Divergences (Leading Reversal Signals)
Divergences offer powerful leading signals when the PVT momentum and price structure disagree, exposing a shift in underlying market mechanics.
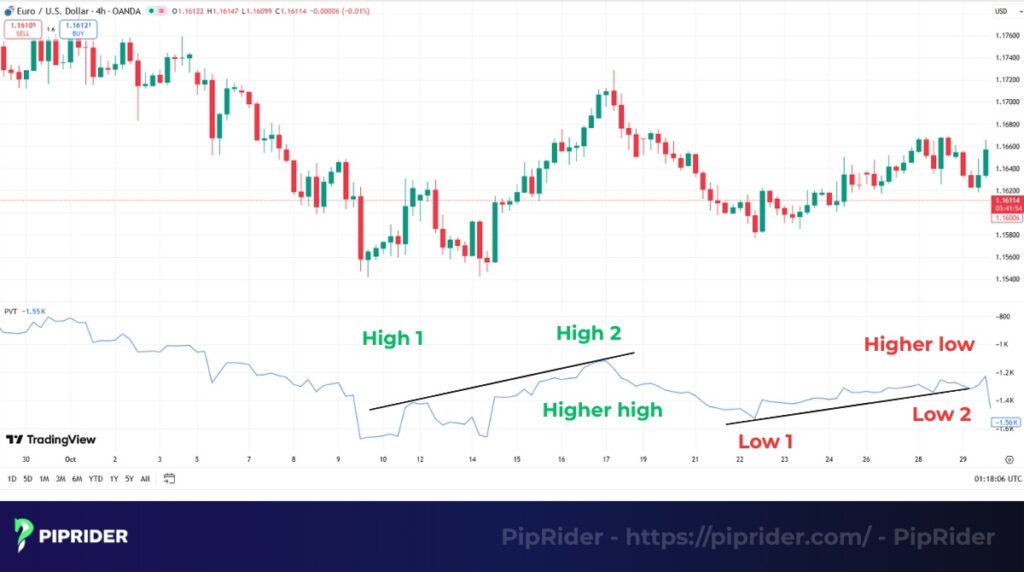
- Bearish Divergence (Distribution): This occurs when the price makes new Higher Highs (HH) while the PVT makes Lower Highs (LH). It signals that upward conviction is fading (fewer participants are driving the new highs), and a downward reversal may be near.
- Bullish Divergence (Accumulation): This appears when the price hits new Lower Lows (LL) while the PVT forms Higher Lows (HL). It suggests downward pressure is exhausted, and “stealth” volume-weighted demand is absorbing the selling.
Execution Warning: Divergence is an early warning, not an entry trigger. In strong trends, divergences can build up over several price swings. Always wait for a structural price break (e.g., breaking a trendline or a previous swing point) to confirm the reversal before entering a trade.
4.3. Volume Confirmation for Breakouts and Breakdowns
The PVT is highly effective for validating structural breakouts beyond key levels, helping traders filter out algorithmic noise.
- Validating Breakouts (Resistance): A price move above a resistance ceiling is credible only if the PVT is also rising sharply. This confirms the breakout is backed by broad market participation. Without this rise, the breakout is likely an algorithmic false signal or a “bull trap.”
- Validating Breakdowns (Support): Conversely, if the price drops below a key support floor, the PVT should fall aggressively. This confirms that the breakdown is driven by heavy, volume-weighted selling. If the price breaks down but the PVT remains flat, it is a high-probability “bear trap” (liquidity grab).
5. PVT vs. OBV: What’s the Difference?
On the surface, the Price Volume Trend (PVT) and the On-Balance Volume (OBV) seem very similar. Both are cumulative volume indicators used to confirm trends and spot divergences. However, the core difference lies in their calculation, which makes the PVT a more sensitive and nuanced tool for institutional flow analysis.
| Factor | Price Volume Trend (PVT) | On-Balance Volume (OBV) |
|---|---|---|
| Calculation Method | Volume is weighted by the percentage of price change. | The entire period’s volume is added/subtracted based solely on price direction. |
| Sensitivity | Highly sensitive to the magnitude of price moves (Result vs. Effort). | Less sensitive; treats a $0.01 move the same as a $10.00 move if the direction is the same. |
| Best Use Case | Identifying the conviction and efficiency behind short-term price swings. | Confirming long-term trends where general direction is more important than volatility. |
| Divergence Signals | Can appear earlier and clearer due to its sensitivity to price intensity. | Broader movements can sometimes mask subtle, early divergences. |
In short, the PVT is the superior tool if you want to measure the conviction behind price moves, as it accounts for the strength of price change. The OBV is simpler and better suited for tracking the general, long-term flow of volume without the nuance of price volatility. Many traders prefer the PVT for its added layer of sensitivity.
6. How to Trade Using the PVT Indicator
While the PVT can provide valuable insights, it is most effective when integrated into a structured, rule-based trading plan. Below are three common strategies that leverage the PVT’s strengths for trend confirmation, reversal signals, and breakout filtering.
6.1. Strategy 1: Trend Confirmation
This is the most straightforward way to use the Price Volume Trend indicator. The goal is to ensure that the volume-weighted momentum supports the price action before entering a trade. This helps you trade in alignment with the dominant trend and avoid weak or choppy markets.
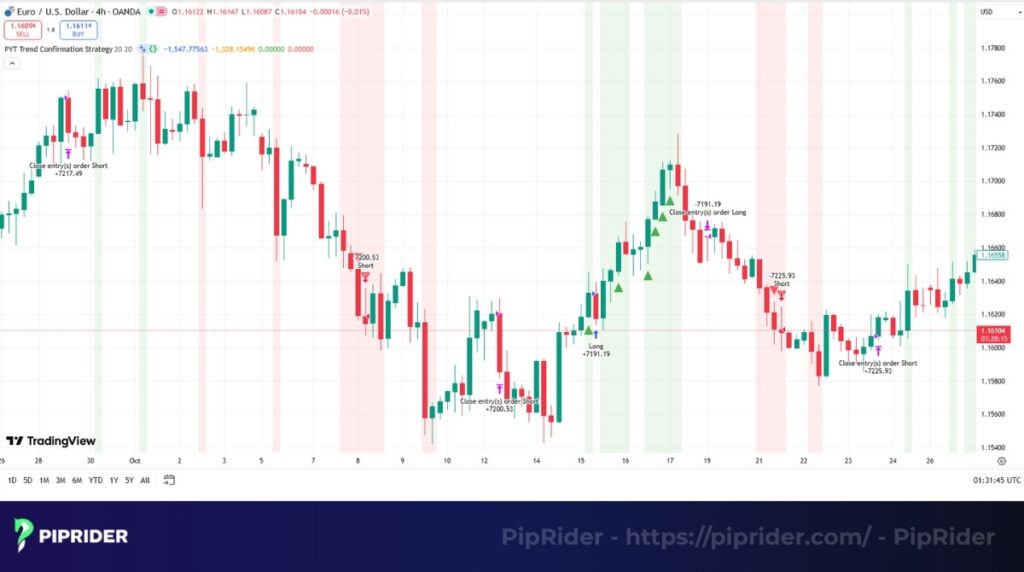
- Buy Signal: A trader looks for a clear structural uptrend on the price chart (e.g., Higher Highs and Higher Lows) and confirms it with a steadily rising PVT line. An entry is taken only when both metrics are in agreement.
- Sell Signal: Conversely, a short (sell) trade is considered only when the price is in a clear downtrend and the PVT line is also falling, confirming that volume-weighted supply is dominant.
6.2. Strategy 2: Divergence Reversal Setup
This strategy aims to catch trend reversals early by spotting momentum divergences. It is a more advanced technique that can lead to highly favorable risk/reward setups, but it strictly requires structural price confirmation.
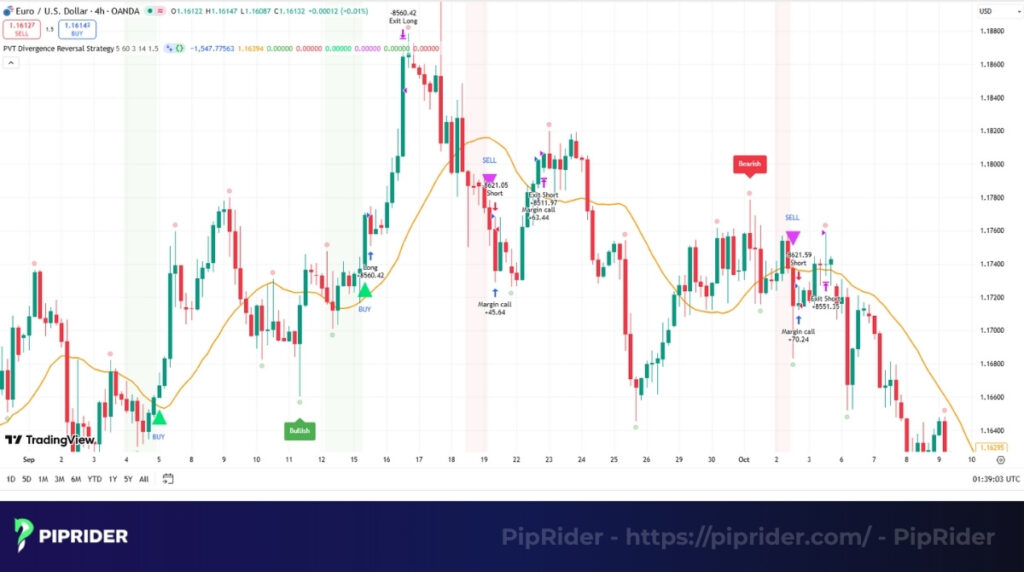
- Bullish Reversal: Look for a bullish divergence (price makes a Lower Low (LL), but PVT makes a Higher Low (HL)). This is not an immediate buy signal. Instead, wait for the price to confirm the reversal (e.g., by breaking a downward trendline or a previous lower high) before entering a long position.
- Bearish Reversal: Spot a bearish divergence (price makes a Higher High (HH), but PVT makes a Lower High (LH)). Then, wait for the price to show structural weakness (e.g., breaking below a key support level) before entering a short trade.
6.3. Strategy 3: Breakout Filter
False breakouts are a common problem for traders. The PVT indicator acts as a powerful filter to distinguish between legitimate breakouts and fakeouts by validating the presence of broad market participation.
When the price breaks above a key resistance level or trendline, an entry is only considered if the PVT is simultaneously rising strongly. This confirms the breakout is supported by volume-weighted demand rather than low-liquidity spikes.
(Note for Spot Forex Traders: Because Forex relies on a tick volume proxy, trading breakouts requires a strict volatility filter. Please refer to Section 7.3 for the exact ATR and Candle Close confirmation rules).
7. PVT in Different Market Conditions
A good indicator should adapt to the market’s current state. The Price Volume Trend’s behavior changes distinctly between trending and ranging conditions and offers valuable context-specific clues to a trader.
7.1. In a Trending Market
During a strong, healthy trend, the PVT should move in lockstep with the price. This is its primary function: to confirm that the trend has real momentum behind it, driven by significant, volume-weighted money flow.
For example, in a powerful uptrend, you should see both the price making higher highs and the PVT line also charting a clear path upwards. This harmony confirms that each new price leg is supported by an inflow of capital, giving traders the confidence to stay in their long positions.
7.2. In a Ranging Market
When a market is consolidating or moving sideways, the PVT line will typically go flat, mirroring the price’s lack of direction. This indicates a period of equilibrium where neither buying nor selling pressure is dominant, showing a lack of significant money flow.
However, the indicator can provide an early warning of an impending breakout. If the price is still moving sideways but you notice the PVT beginning to subtly creep upwards, it can be a sign of subtle accumulation. This suggests that sustained volume-weighted demand is building up before the actual price breakout occurs, giving you a valuable heads-up. The same logic applies to a subtle downward drift in the PVT, which can foreshadow a breakdown.
7.3. Special Application: PVT in Spot Forex
Applying the Price Volume Trend (PVT) indicator to the spot Forex market requires a strict understanding of market microstructure. Because spot Forex is a decentralized, Over-The-Counter (OTC) market, it does not record universal capital-traded data. Instead, retail platforms provide Tick Volume (the frequency of price updates).
- TThe Tick Volume Proxy: While spot Forex cannot measure exact dollar flow, landmark research by quantitative analysts such as Caspar Marney (2011), supported by insights from major liquidity providers like OANDA, demonstrates that tick volume has a highly positive correlation with actual traded volume. Therefore, applying PVT to tick volume remains a statistically valid method for measuring the intensity of market participation.
- The Confirmation Rule (ATR + Close): Tick volume can occasionally spike due to algorithmic noise during low-liquidity news events. To filter false signals, Forex traders must pair the PVT with a volatility metric. When trading a PVT breakout, require both an ATR (Average True Range) expansion and a decisive candlestick body close above the structural level to validate the move.
8. Combining PVT with Other Indicators
The Price Volume Trend indicator is powerful, but it should never be used in isolation. Its signals become significantly more reliable when confirmed by other indicators that measure different aspects of market dynamics.
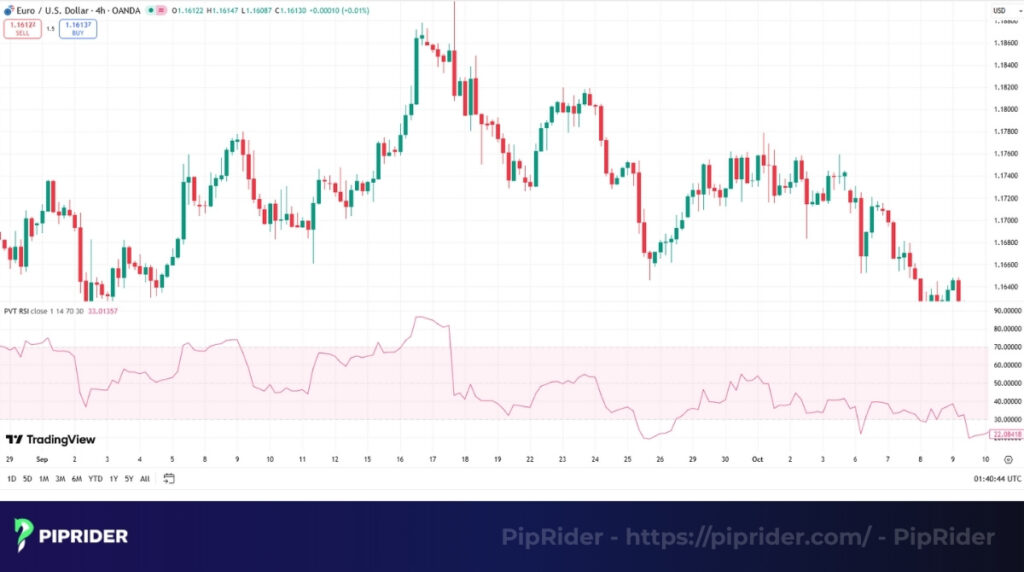
- Combining with Relative Strength Index (RSI): Confirm reversals by combining RSI overbought/oversold readings with a PVT divergence. RSI reading above 70 paired with a bearish PVT divergence creates a high-probability sell signal.
- Combining with MACD: Strengthen entry signals by requiring alignment. A bullish MACD crossover becomes a much stronger buy signal when the PVT is also in a clear uptrend. This alignment confirms that both price momentum and the underlying volume flow agree, increasing the probability of a successful trade.
- Combining with Moving Averages (MAs): Filter for trend direction by using an MA (e.g., 50 EMA) to define the primary trend. Only take buy signals from the PVT when the price is above the MA to avoid risky counter-trend trades.
- Combining with Volume Profile: Pinpoint key levels by using this indicator to find high-volume support/resistance zones. A price bounce from a major support level is confirmed if the PVT also begins to rise, indicating strong volume-weighted demand is defending the zone.
9. Limitations of the Price Volume Trend Indicator
No indicator is perfect, and the PVT is no exception. Understanding its weaknesses is crucial for avoiding common traps and using it effectively.
- Lagging nature: The PVT is a lagging indicator because it is based on past data. It will always confirm a move after the price has already started to change, which can lead to delayed signals.
- Dependence on a Volume Proxy (Forex limitations): Unlike centralized stock or futures markets, the OTC Forex market lacks universal volume data. As detailed in Section 7.3, retail platforms must use Tick Volume as a proxy. While studies show it correlates highly with actual activity (Marney, 2011), traders must remember it is an activity gauge, not a literal dollar-volume counter. Relying solely on this proxy during low-liquidity algorithmic spikes can be dangerous without a volatility filter.
- Susceptibility to noise on lower timeframes: On very short timeframes (e.g., 1-minute or 5-minute charts), erratic volume spikes can create significant noise and false signals. The indicator is generally more reliable on higher timeframes (4-hour, daily).
- Requirement for confirmation: Relying solely on the PVT is a risky strategy. Its signals, especially divergences, should always be confirmed with other forms of analysis, like price action, the RSI, or Bollinger Bands.
10. How to Add PVT on TradingView (and What to Use on MT4/MT5)
Adding the Price Volume Trend indicator to your workflow is straightforward, but its availability depends entirely on your charting platform.
10.1. On TradingView (Native Support)
TradingView includes the PVT as a standard, built-in technical tool. To apply it to your chart:
- Click the Indicators, Metrics & Strategies button (or press
/) at the top of your screen. - Type “Price Volume Trend” or “PVT” into the search bar.
- Select the built-in indicator from the list to attach it below your price chart.
10.2. On MetaTrader 4 / MetaTrader 5 (Custom Setup)
Unlike On-Balance Volume (OBV) or the Accumulation/Distribution (A/D) line, the PVT is not included as a default indicator in MT4 or MT5 out-of-the-box.
- TheThe Custom Route: To use PVT, you must download a custom
.mq4or.mq5file from the MQL5 Community Code Base. To install it, open your terminal, navigate to File > Open Data Folder, and drop the downloaded file into the MQL4/Indicators (or MQL5/Indicators) folder. Restart your platform to apply it. - The Native Alternative: If you prefer not to install custom files, the closest native alternative available in your MetaTrader “Volumes” folder is OBV. Just remember that OBV acts as a basic cumulative counter and lacks the percentage-weighting sensitivity of the PVT.
11. Practical Example and Chart Setup
Let’s combine these concepts into a complete trading setup. This example uses a Daily (D1) chart, a 20-period EMA to define the short-term trend, and a PVT divergence to spot the reversal. The goal is to use the indicator for an early warning and the EMA for a precise entry trigger, creating a rule-based, high-probability trade.
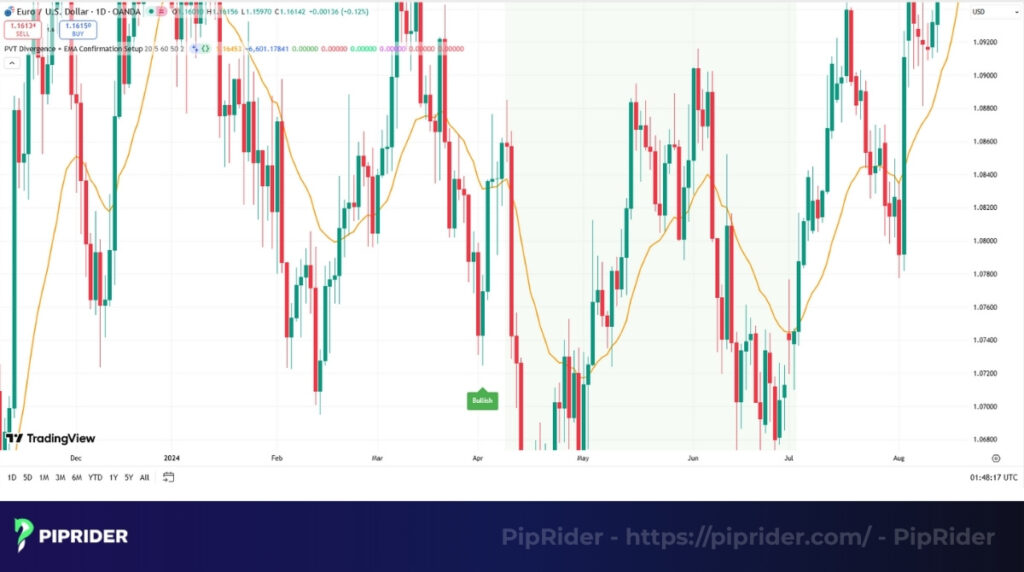
- The Signal: First, we identify a bullish divergence where the price makes a new Lower Low (LL) but the PVT forms a Higher Low (HL). This is our signal that volume-weighted supply is fading and the downtrend may be exhausting.
- Entry: After spotting the divergence, wait for structural price confirmation. The entry is triggered only when a candlestick closes decisively above the 20 EMA. A decisive breakout means the actual body of the candle closes clearly above the moving average, not just a temporary wick piercing through it. This confirms that momentum has officially shifted in your favor.
- Stop Loss: A logical stop loss should be placed strictly below the recent swing low that formed the divergence. This ensures your trade idea is immediately invalidated and you exit with a small, controlled loss if the reversal fails.
- Take Profit: An initial profit target can be set at a previous, significant structural resistance level where sellers previously defended the price. For stronger trends, a trader might choose to trail the stop loss (e.g., behind the 20 EMA) to capture a larger portion of the move.
12. Frequently asked questions about Price Volume Trend Indicator
13. The Bottom Line
The Price Volume Trend indicator (PVT) is a powerful tool that goes beyond simple price analysis. By integrating volume with the magnitude of price changes, it helps traders authenticate trends and see the real conviction in the market. It is highly effective when used to confirm breakouts, spot divergences, and gauge the true strength behind a price move.
When combined with indicators like the RSI and moving averages, the PVT transforms into a comprehensive money-flow filter, allowing for a more sophisticated and reliable trading approach. To continue building your analytical edge, follow our technical indicators list at Piprider to discover and master more essential Forex Indicators.