
When major indices hit new highs, a common question arises: Is this strength genuine, or is the rally masking underlying weakness? To answer this, traders need a tool that looks beyond simple price movement to gauge the market’s internal health.
This is the exact purpose of the TRIN Arms Index, also known as the Short-Term Trading Index. Unlike typical trend indicators, TRIN acts as a sentiment gauge, analyzing the genuine distribution of buying and selling pressure across the market.
In this guide, Piprider will explain the TRIN Arms Index formula, show how to interpret its buy and sell signals, and discuss how it provides a crucial edge in confirming overall market sentiment.
Key Takeaways
- Market Health Gauge: The TRIN measures true investor sentiment by comparing the number of advancing vs. declining stocks against their trading volume.
- Inverse Logic: It works counter-intuitively. A high reading signals market panic (bullish opportunity), while a low reading signals complacency (bearish risk).
- Two Trading Modes:
- Raw TRIN (Intraday): Used for spotting panic spikes. Readings > 2.0 (or extreme > 3.0) indicate “washout” oversold conditions.
- 10-Day MA (Swing): Used for trend filtering. Readings > 1.20 are oversold, while those < 0.80 are overbought.
- Scope: It is a breadth indicator designed for broad stock indices (NYSE), not for individual stocks or Forex.
1. What is the TRIN Arms Index?
The Arms Index, also known as TRIN (Short for TRading INdex), is a technical market breadth indicator developed by Richard W. Arms, Jr. in 1967. Originally displayed on a large wallboard at the NYSE floor to help traders gauge sentiment instantly, the TRIN measures the internal strength of the entire stock market.
Unlike standard indicators that focus on the price of a single stock, the TRIN looks at the participation. It answers the critical question:
“Is the market rally real (broad participation), or is it fake (driven by just a few influential stocks)?”
Formula Snapshot
TRIN = (AD Ratio) / (AD Volume Ratio)
The Market’s “EKG” (Electrocardiogram)
To put it simply, think of the TRIN as the market’s EKG.
- The Price Index (e.g., Nasdaq 100) shows you the “Face” of the market. It might look healthy and rising on the outside.
- The TRIN shows you the “Heartbeat.” It reveals if that rise is supported by strong blood flow (Volume) or if the heartbeat is weak (an illusion).
2. How is the Arms Index calculated? (Formula & Intuition)
You don’t need to be a math wizard to use the TRIN, but understanding the logic behind it is crucial to avoid misinterpreting the signals.
At its core, the TRIN evaluates the relationship between Market Breadth (Participation) and Trading Volume (Conviction).
2.1. The Formula
The Arms Index is a ratio of two ratios:
(The Numerator represents Breadth / The Denominator represents Volume)
2.2. The Intuition: Participation vs. Conviction
Instead of just looking at price, the TRIN asks: “Is the movement supported by money flow?”
- The Numerator (Issues Ratio) represents Participation: How many stocks are joining the move? (The “Vote” count).
- The Denominator (Volume Ratio) represents Conviction: How much money is backing that move? (The “Weight” of the vote).
The “Inverse” Logic:
Because Volume is in the denominator, the formula works inversely to price:
- Strong Volume = Low TRIN: If massive volume flows into rising stocks, the denominator gets huge, pushing the TRIN value down (towards 0).
- Weak Volume = High TRIN: If stocks fall but volume is light, the denominator shrinks, pushing the TRIN value up.
2.3. Calculation Example (The Panic Scenario)
Let’s look at a typical market sell-off to see why the TRIN spikes above 2.0.
- Participation (Breadth): 500 stocks Up vs. 2,500 stocks Down. (Ratio = 0.2)
- Conviction (Volume): 100M Volume Up vs. 1,000M Volume Down. (Ratio = 0.1)
👉 Result: A TRIN of 2.0 signals Panic.
Interpretation: The selling volume (denominator) is overwhelming the market even more intensely than the number of falling stocks suggests. This indicates Capitulation, investors are dumping shares at any price.
📉 Why TRIN < 1.0 = Bullish Strength
Mathematically, for the TRIN to be less than 1.0, the Volume Ratio must be larger than the Issues Ratio.
In plain English: It means the stocks moving up are receiving a disproportionately large amount of volume. The buying pressure is “heavier” and more aggressive than the selling pressure. This is the hallmark of a strong bull market.
3. How to read and interpret the Arms Index
Learning to properly interpret the Arms Index is a critical skill. The most important rule to remember is that these levels are not rigid tripwires. Market volatility changes, and so should your expectations.
Instead of looking for exact numbers, view the TRIN in terms of Psychological Zones.
3.1. The Neutral Zone (0.90 – 1.10)
When the TRIN oscillates tightly around 1.0, the market is in equilibrium. The buying pressure and selling pressure are roughly equal.
- The Market State: This typically represents a “tug-of-war” or a consolidation phase where the market is deciding its next move. You will often see this during lunchtime trading or just before major news events (like a Fed announcement).
- Actionable Advice: Caution is required. This is often a “No-Trade Zone” for trend followers. Trading broad indices (like the S&P 500) in this zone can lead to “whipsaws” (getting stopped out repeatedly) because there is no dominant momentum.
- Strategy: Sit on your hands and wait for the TRIN to break out of this range to confirm the day’s true direction.
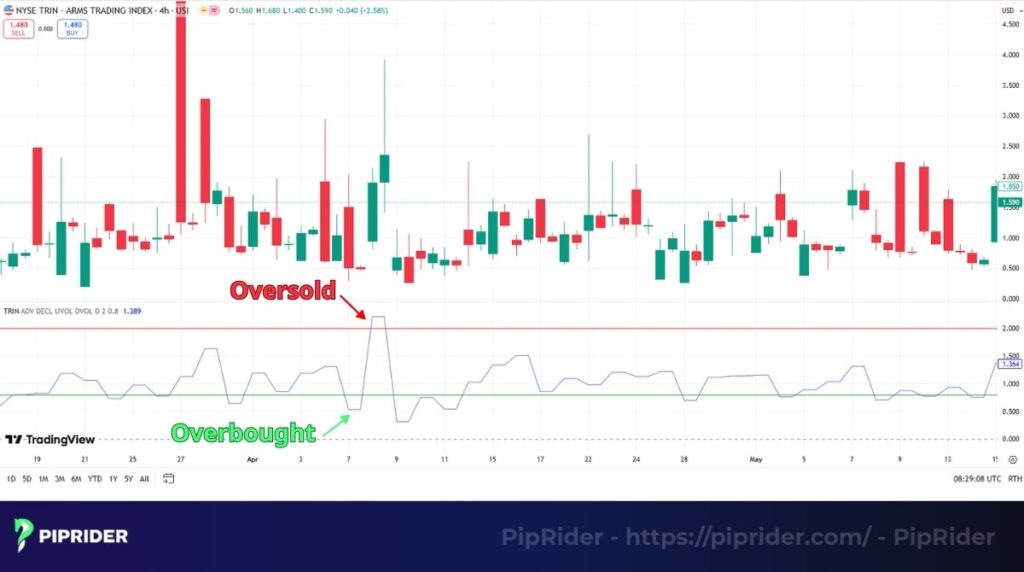
3.2. The Overbought Zone (Readings < 0.80)
This area is often misunderstood. A low TRIN means strong buying volume, but context is key.
- Bullish Confirmation (0.60 – 0.80): In a strong uptrend, if the TRIN stays in this range, it confirms that the rally is supported by strong volume. Do not sell. The trend is healthy.
- Overbought / Euphoria (< 0.50): If the TRIN drops to extreme lows (e.g., 0.40 or 0.50), it indicates complacency. Everyone is buying, and no one is hedging.
- The Signal: Be cautious. The market is overextended and vulnerable to a sharp pullback if buying dries up.
3.3. The Oversold Zone (Readings > 2.00)
When the TRIN spikes above 1.0, selling pressure is dominant. This is where contrarian traders make their money.
- Bearish Pressure (1.20 – 1.80): The market is weak, but not yet in panic mode. The downtrend is likely to continue.
- Panic / Capitulation (> 2.00): This is the “Washout” signal. Sellers are dumping positions at any price.
- The Signal: A reading above 2.0 (or even 3.0+ during crashes like 2008 or 2020) suggests that the selling climax is near. This is often a high-probability buying opportunity for a bounce.
Pro Tip: Never trade the raw number in isolation. If the S&P 500 makes a Lower Low, but the TRIN makes a Lower High (Divergence), it means the internal selling pressure is exhausted, even if the price chart still looks scary.
📉 Real-World Case Study: The March 2020 Crash
For a textbook example of capitulation, look at the COVID-19 market crash. In mid-March 2020, as the S&P 500 plummeted, the NYSE TRIN spiked above 3.0 multiple times.
This was a historic reading. It signaled that sellers were dumping positions indiscriminately at any price (“Get me out” mode).
- 🚀 The Result: Shortly after these extreme panic readings appeared, the market formed a bottom and began one of the strongest bull runs in history.
-
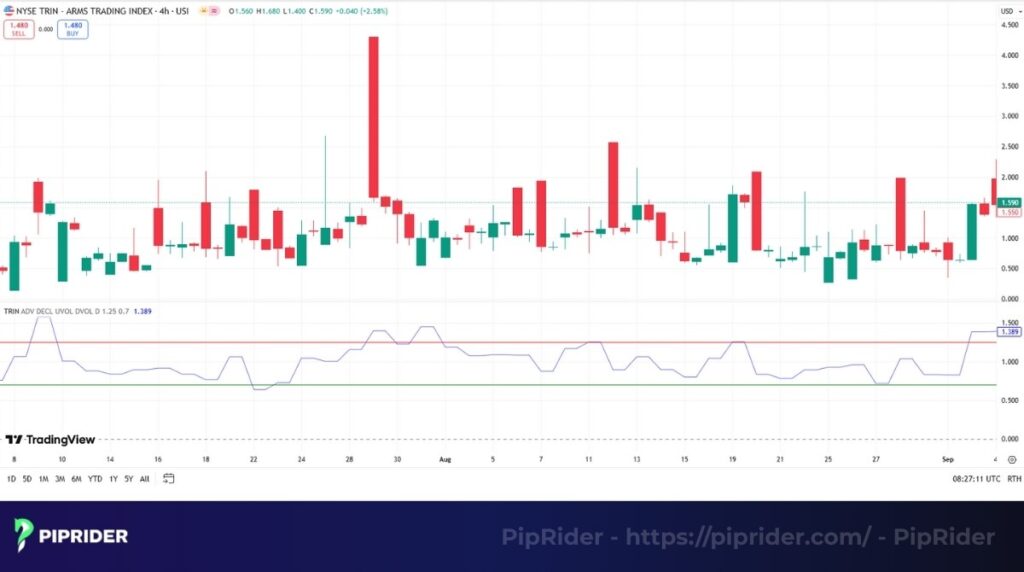
🔍 How to check: Type
TRIN.NYon TradingView to see the NYSE Arms Index history yourself.
4. Can the TRIN be used in Forex trading?
This is a critical question that many traders ask, and the answer is simple and direct: No, this indicator is designed exclusively for the stock market and cannot be used for forex trading.
4.1. The reason TRIN is exclusively for the stock market
The entire calculation of the Arms Index depends on data that is only available from a centralized stock exchange, like the New York Stock Exchange (NYSE). To work, it needs to know:
- The total number of stocks that went up.
- The total number of stocks that went down.
- The combined volume of all the stocks that went up.
- The combined volume of all the stocks that went down.
This breadth data is the lifeblood of the indicator.
4.2. The fundamental problem with forex
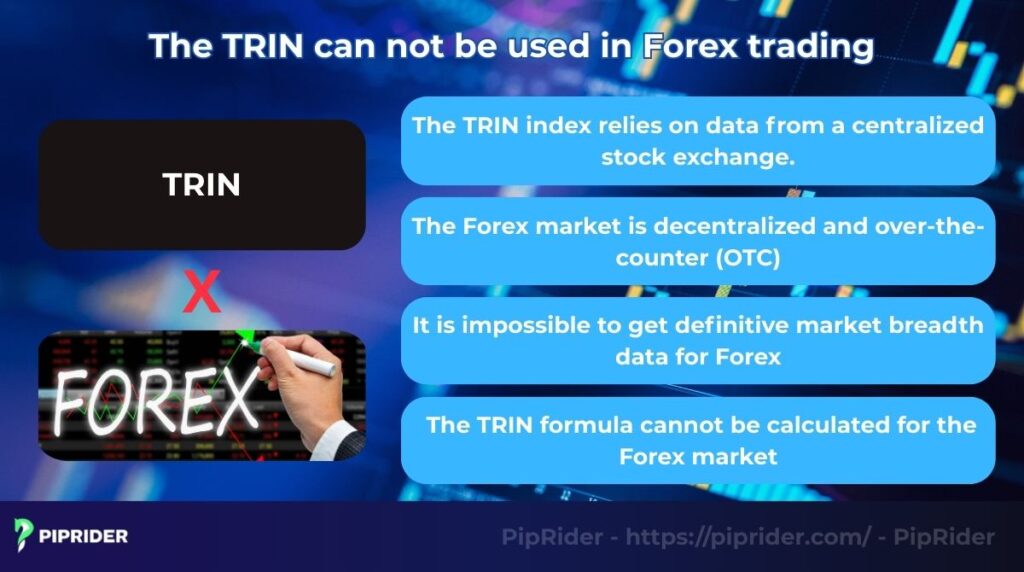
The foreign exchange market is not centralized; it operates without a single, primary exchange to process all trades. As financial authorities like the Corporate Finance Institute (CFI) explain, this over-the-counter (OTC) structure means that volume data is fragmented across countless brokers and liquidity providers globally.
Because it’s impossible to get a definitive count of “advancing vs. declining” currency pairs and their total volume, the formula simply cannot be calculated. Therefore, you will not find a “TRIN indicator” for the forex market. It is a tool built for a different purpose and a different market structure.
5. Advanced Strategy: Raw TRIN vs. 10-Day Moving Average
One common criticism of the Arms Index is that the raw intraday data can be extremely volatile. The line often jaggedly spikes up and down, creating “noise” that can lead to false signals.
To solve this, professional analysts and institutions (like AAII and StockCharts) rarely trade the raw number in isolation. Instead, they apply a smoothing filter, typically a 10-day Simple Moving Average (SMA), to reveal the true underlying trend of market sentiment.
5.1. Raw TRIN: The “Panic Hunter” (Intraday)
The Raw TRIN is the live, fluctuating number you see during the trading session. It is highly sensitive and reacts instantly to market orders.
- Best for: Day Traders looking for short-term scalps.
- The Signal: It is excellent for spotting sudden, sharp spikes of intraday panic. If the Raw TRIN suddenly shoots up to 2.0 or 3.0 (while the market price is dropping), it often marks a temporary “washout” low, signaling a potential intraday reversal.
5.2. 10-Day MA TRIN: The “Trend Filter” (Swing)
The 10-day Moving Average (MA) smooths out the daily noise to show the broader market psychology over several weeks. This is the preferred version for Swing Traders.
Important: Because the data is smoothed, the extreme thresholds are tighter than the raw version (StockCharts, n.d.).
- Oversold Zone (> 1.20): When the 10-day MA rises above 1.20, it indicates a sustained period of heavy selling. The market is likely “washed out” and ripe for a bullish rally.
- Overbought Zone (< 0.80): When the 10-day MA drops below 0.80, it indicates sustained complacency (too much buying). The market is likely overextended and vulnerable to a correction.
Summary: Which one should you use?
Here is a quick comparison to help you choose the right tool for your style.
| Feature | Raw TRIN | 10-Day MA TRIN |
|---|---|---|
| User Profile | Day Trader (Scalper) | Swing / Position Trader |
| Volatility | High (Very Noisy) | Low (Smooth) |
| Best Signal | Sudden Panic Spikes (Reversal) | Sustained Sentiment Zones (Trend) |
| Oversold Level (Bullish Signal) |
> 2.00 (Extreme) | > 1.20 (Moderate) |
| Overbought Level (Bearish Signal) |
< 0.50 (Extreme) | < 0.80 (Moderate) |
Key Takeaway: If you are analyzing the broad trend, ignore the raw number. Plot a 10-period SMA on your TRIN chart to filter out the noise and see the true market health.
6. How to Trade TRIN: 3 Actionable Playbooks
Knowing the theory is one thing; executing a trade is another. The TRIN is rarely used as a standalone trigger but is powerful when combined with price action.
Here is a quick summary of the 3 specific playbooks we will cover:
| Playbook | Context | TRIN Signal | Primary Action |
|---|---|---|---|
| A. Panic Spike | Market Crashing (Extreme Fear) |
Spike > 2.00 | Buy the Bounce (Contrarian Long) |
| B. Complacency | Strong Rally (Extreme Greed) |
Drop < 0.50 | Tighten Stops (Defensive / Hedge) |
| C. Fakeout Filter | Price Breakout (New Highs) |
Stays > 1.00 | NO BUY (Avoid Bull Trap) |
6.1. Playbook A: The “Panic Spike” (Mean Reversion Long)
This is a contrarian setup designed to catch the bottom of a sell-off. We are looking for “capitulation”, the moment when the last seller has panicked.
- Context: The major index (S&P 500 or Nasdaq) is dropping hard into a key Support Level or making a False Breakdown.
- The Trigger: The Raw TRIN spikes aggressively into the Panic Zone (> 2.00). Ideally, look for a “blow-off top” on the TRIN chart (a sharp spike followed by a reversal).
- Entry Signal: Do not catch a falling knife. Wait for Price Confirmation:
- Price reclaims the Support level it just broke.
- Price prints a bullish candlestick (e.g., Hammer, Engulfing) on the 5m/15m chart.
- Stop Loss (SL): Place SL just below the Swing Low of the panic candle.
- Take Profit (TP):
- TP1: The intraday VWAP or previous day’s Close.
- TP2: The nearest Resistance level.
- Invalidation (Abort): If TRIN continues to make Higher Highs (panic increasing) and Price makes Lower Lows.
6.2. Playbook B: The “Complacency Fade” (Hedge First)
This setup identifies when the market is “running on fumes.” Since shorting a strong uptrend is risky, this playbook focuses on defense.
- Context: The index has been rallying for days and is approaching a major Resistance Level.
- The Trigger: The TRIN drops into the Euphoria Zone (< 0.50) and stays there. This means volume is exclusively flowing into winners, and no one is hedging.
- Action:
- Defensive: Tighten Stop Losses on existing longs. Take partial profits.
- Offensive (Optional): Look for a short scalp only if confirmed by a bearish reversal pattern.
- Confirmation: Watch the TICK Index. If you see multiple readings of +1000 (Buying Exhaustion) while TRIN is < 0.50, the top is likely near.
- Invalidation (Abort): If the TRIN stays low (0.50–0.80) but price breaks out above resistance with strong volume. This is a “Lock-out Rally” (Trend Continuation).
6.3. Playbook C: The “Fakeout Filter” (Trend Check)
Unlike the first two, this is not a reversal strategy. It is used to filter out false breakouts (Bull Traps).
- The Logic: A healthy rally requires broad participation (Volume flowing into advancing stocks). This must push the TRIN down (below 1.0).
- The Trap: The Price Index (e.g., S&P 500) makes a New High, BUT the TRIN remains Neutral (~1.0) or High (>1.0).
- Interpretation: The rally is “hollow.” It is being driven by only a few mega-cap stocks, while the rest of the market is weak.
- Action:
- Do NOT buy the breakout. It is likely a fakeout.
- Look to fade (short) the move when price falls back below the breakout level.
7. TRIN vs. TICK: What’s the Difference?
When analyzing internal market data, traders often see two symbols side-by-side: the Arms Index (TRIN) and the NYSE TICK Index ($TICK).
While both measure intraday sentiment, they answer two different questions:
- The TRIN tells you the quality of the market mood (Breadth + Volume).
- The TICK tells you the urgency of the execution (Buying vs. Selling pressure right now).
To avoid confusion, here is the definitive comparison.
7.1. Comparison Table
To the untrained eye, these two indicators might look similar because they both measure market sentiment. However, confusing their roles is a common mistake. Mistaking the “noise” of the TICK for the “trend” of the TRIN can lead to premature entries.
Here is the definitive breakdown of how they differ in speed, signal, and strategic purpose:
| Feature | TRIN (Arms Index) | TICK Index ($TICK) |
|---|---|---|
| What it measures | Market Breadth (Advancing Stocks vs. Volume) |
Transaction Speed (Stocks ticking Up vs. Down) |
| Speed | Slower (Cumulative) Reflects the sentiment of the whole day. |
Real-Time (Fast) Updates every second like a heartbeat. |
| Key Extremes (Reversal Signals) |
> 2.00: Oversold (Panic) < 0.50: Overbought (Greed) |
+1,000: Buying Exhaustion -1,000: Selling Exhaustion (Source: Investopedia) |
| Best Used For | Determining the Market Context (Trend Direction). | Timing precise Entries & Exits (Sniping). |
7.2. How to use them together (The “Macro to Micro” Strategy)
Professional day traders rarely use one without the other. The most effective approach is to use the TRIN to establish the Market Context and the TICK to refine the Trade Execution.
- TRIN (The Filter): It filters the quality of the move. Is the selling pressure genuine (high volume) or weak?
- TICK (The Trigger): It pinpoints the exact second the selling pressure stops and buyers step in.
The “Capitulation Buy” Setup: We look for a moment where the broad market is panicked (TRIN), but the immediate selling orders are exhausted (TICK).
- Step 1: Identify the Context (TRIN > 2.00) Wait for the TRIN to spike above 2.00. This objectively confirms that the market is in an Oversold state with high volume.
- Step 2: Wait for the Trigger (TICK -1,000) Do not buy yet. Watch the TICK. Wait for a sudden spike down to -800 or -1,000. This signals Selling Exhaustion (everyone who wanted to sell has sold).
- Step 3: Execute Enter a Long position immediately when the TICK starts to hook back up from the extreme lows (e.g., snaps back from -1,000 to -600).
8. Arms Index advantages and limitations
The Arms Index is a unique tool, but it’s crucial to understand both its strengths and its weaknesses.
8.1. The Advantages
The TRIN Arms Index is an invaluable tool for experienced traders because it provides unique, counter-intuitive insight into the market’s psychological extremes. Its key advantages are:
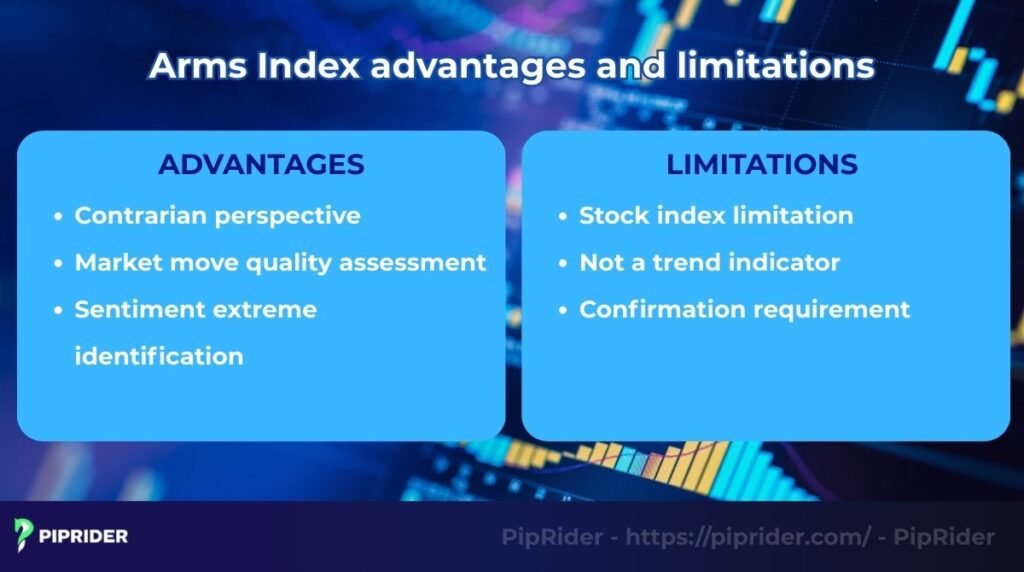
- Contrarian perspective: The Arms Index helps identify moments of extreme fear (potential buying opportunities) and extreme greed (potential selling opportunities), allowing traders to go against the crowd.
- Market move quality assessment: By incorporating volume, the indicator gives a deeper look into market breadth than just the advance/decline line. It helps assess if a trend is supported by strong, broad participation.
- Sentiment extreme identification: It is a powerful tool for gauging when the market has reached a point of unsustainable panic or euphoria, which often precedes a reversal.
8.2. The Limitations
While powerful, the Arms Index is not a universal tool. For effective application, traders must understand its inherent limitations:
Traders get into trouble when the Arms Index’s significant limitations are ignored.
- Stock index limitation: It is a breadth indicator and cannot be used for individual stocks or decentralized markets like forex. It is designed for broad market analysis, making it more suitable for short-term timing than for a long-term buy-and-hold strategy.
- Not a trend indicator: It is a short-term, sentiment-based oscillator. It is designed to find potential turning points, not to help ride a long-term trend like many other popular technical indicators.
- Confirmation requirement: Trading should never be done based on an Arms Index signal alone. It must always be used in conjunction with other tools like moving average and price action to confirm a trade idea.
9. Where to Chart TRIN: Correct Ticker Symbols
One of the biggest frustrations for new traders is typing “TRIN” into their charting platform and seeing a blank screen or the wrong data.
Because the Arms Index is a market breadth statistic (not a stock), each platform labels it differently. Here is the cheat sheet to find the correct chart immediately.
9.1. Quick Reference Guide
Find your charting platform in the list below and copy the exact ticker symbol to ensure you are looking at the correct data.
| Platform | Market Index | Ticker Symbol |
|---|---|---|
| TradingView | NYSE (Standard) | TRIN.NY |
| StockCharts | NYSE (Standard) | $TRIN |
| ThinkOrSwim | NYSE (Standard) | $TRIN |
| Investing.com | NYSE (Standard) | TRIN |
9.2. Important Note: NYSE vs. Nasdaq
You will often see two versions of the TRIN: one for the New York Stock Exchange (NYSE) and one for the Nasdaq.
- TRIN (NYSE): This is the standard version used by 90% of professional traders. It covers a broader range of industrial and financial stocks. Recommendation: Use this for general market analysis.
- TRINQ (Nasdaq): This version only measures the Nasdaq exchange. It is extremely volatile due to the tech-heavy nature of the index. Use this only if you are specifically scalping the QQQ.
- TradingView:
TRIN.NQ| StockCharts:$TRINQ
- TradingView:
⚠️ Critical Warning: Data Delay
Most free charting platforms (like TradingView Basic) delay Index data by 15 minutes.
- Do NOT day trade the TRIN if your data is delayed. You need Real-Time Data to catch panic spikes accurately. Check your platform’s subscription settings to ensure you have “NYSE Real-Time Data.”
10. Frequently asked questions about trin arms index
Here are some quick, no-nonsense answers to the most common and important questions traders have about the Arms Index.
11. Conclusion
The TRIN Arms Index is a vital indicator that measures the true, underlying health of a market move by weighing both the number of participating stocks and the volume behind them. It allows for a quick assessment of market volatility. The core value of TRIN lies in its contrarian signals: a high reading signals panic and potential opportunity, while a low reading signals complacency and potential risk. Mastering this breadth gauge is an essential skill for any serious technical analysis.
To further refine your market timing and explore more advanced indicators, visit Learn Forex section at piprider.com for our expert-led guides and resources.


