

Many traders struggle with the lag inherent in standard tools like the RSI. The Laguerre Indicator offers a powerful alternative, designed to smooth out market noise without sacrificing the speed of its reaction. In this guide, Piprider cuts through the complexity to explain exactly how it functions, compares it against the classic RSI, and provides practical, rule-based strategies to help you time your entries with greater precision.
Key Takeaways
- The Laguerre Indicator uses a special Laguerre filter with a “gamma coefficient”, resulting in a smoother and often faster-reacting line than the traditional RSI.
- Its primary strength is in identifying market cycle turning points with minimal delay, making it excellent for catching potential reversals early.
- It is best used for crossover signals (e.g., crossing the 0.15 or 0.75 levels) but only when combined with a primary trend indicator like a moving average.
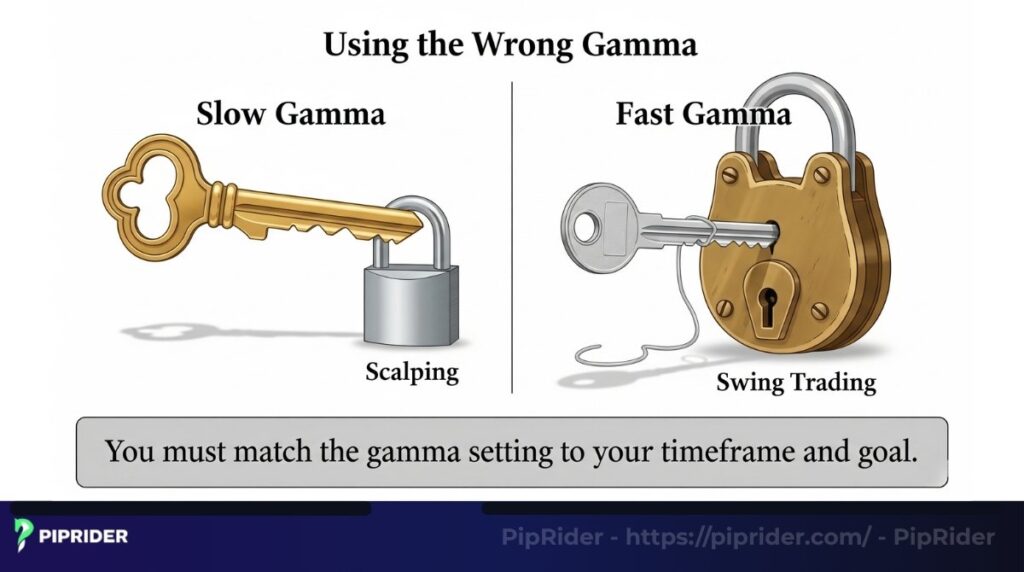
- The ‘gamma’ setting is crucial; using the wrong value can completely change the indicator’s behavior. It is not a “set and forget” tool.
1. What is the Laguerre Indicator?
The Laguerre Indicator is a technical analysis tool, most commonly known as a modified version of the Relative Strength Index (RSI). Developed by John Ehlers (2004), it uses a Laguerre transform to smooth price movements. This helps filter out market noise and provides clearer, more responsive trading signals with less lag than traditional indicators.
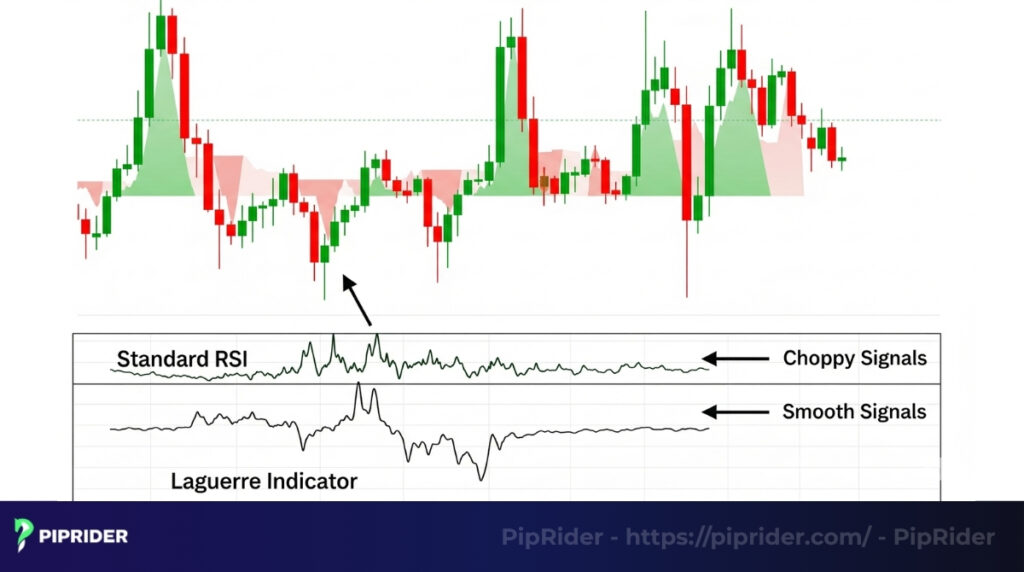
- A quick comparison with RSI: While the classic RSI can often look jagged and give choppy signals in volatile markets, the Laguerre’s line appears much cleaner and more decisive. It shares this “noise-reduction” DNA with the True Strength Index (TSI), as both tools are engineered to react quickly to price movements without the erratic whipsaws seen in standard oscillators.
- Who is it for? This indicator is perfect for the trader who understands the basics but wants to “upgrade” from the RSI. It’s for those who need a tool that responds quickly to the market cycle while smoothing out insignificant price noise.
So, why do so many day traders and scalpers quietly replace the classic RSI with this indicator? Because in the right hands, it can offer a significant edge in timing entry points and exit points. Let’s dive into how it works.
2. How the Laguerre indicator actually works
Let’s pull back the curtain. The reason the Laguerre indicator feels so different isn’t magic; it’s just clever math. But don’t worry, you don’t need a degree in engineering to understand it. We’ll break it down simply.
At its heart, the indicator uses a special type of filter, almost like a pair of noise-canceling headphones for market data. This allows it to smooth out the insignificant jitters in price while still reacting incredibly fast to the price movements that actually matter.
This is why it solves a common frustration: most indicators are either fast and choppy or smooth and slow. The Laguerre aims to be the best of both worlds.
2.1. The “gamma” parameter: Your most important setting
Here’s where things get interesting and where you take control. The indicator’s behavior is almost entirely controlled by one setting: gamma. Think of gamma as a sensitivity dial. Understanding this dial is the key to making the indicator work for you, as the filtering mechanism relies heavily on this coefficient to dampen market noise (Optuma, n.d.).
- A low gamma (like 0.2 or 0.3): This makes the indicator extremely sensitive and fast. The line will be jagged and react to every tiny price move. Frankly, for most traders, this setting is too chaotic and can feel like trying to read a seismograph during an earthquake.
- A high gamma (like 0.7 or 0.8): This makes the indicator very smooth and slower. The line will look more like a gentle, flowing wave, ignoring minor noise and only reacting to more significant market cycle. This is often the starting point for swing traders.
There is no “best” setting. It completely depends on your trading style and the market you’re analyzing.
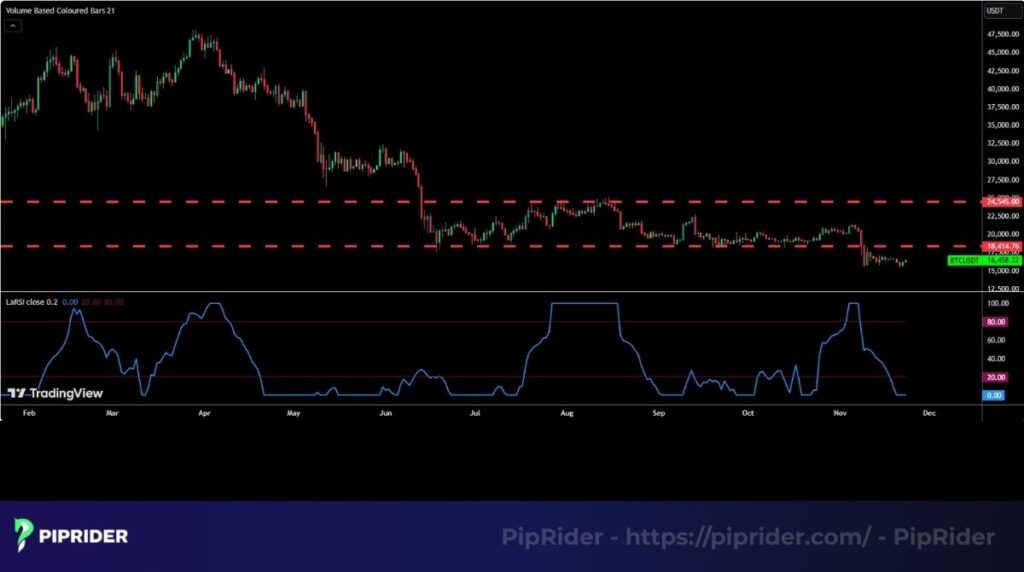
2.2. The signal line and its zones
The indicator produces a single line that oscillates between 0 and 1.
- Overbought Zone: typically set at 0.75 or 0.80.
- Oversold Zone: typically set at 0.15 or 0.20.
Note on Variations: You will often see the 0.20/0.80 levels used in popular TradingView scripts, while others prefer 0.15/0.75. The difference lies in sensitivity. The “wider” thresholds (0.15/0.75) tend to trigger signals slightly earlier but carry a higher risk of noise, whereas the 0.20/0.80 levels are more conservative.
Critical Rule: Regardless of the specific numbers, the real signal is not when the line enters the zone, but when the line decisively exits. A move from above 0.80 back down across this level is the confirmation we need.
3. How to install the Laguerre indicator on TradingView and MT4
The Laguerre is a bit of a hidden gem, as most platforms don’t include it as a default tool. You’ll need to add it yourself, but don’t worry, the process is straightforward, and Piprider will show you how for both TradingView and MT4.
3.1. Setting Laguerre on TradingView
TradingView has a huge library of custom indicators built by its community, which makes adding them very easy.
- To begin, locate the ‘Indicators’ button in the toolbar at the top of your chart.
- In the pop-up window, navigate to the ‘Community Scripts’ tab.
- In the search bar, type in “Laguerre RSI”. You will see a few different versions.
- Our advice here is to choose one with a high number of likes and a reputable author. A widely used version will often have a title like “Laguerre RSI [Ehlers]” to acknowledge the creator.
- Simply click on it, and it will instantly appear on your chart.
3.2. Setting Laguerre indicator on MetaTrader 4 (MT4)
For MT4, the process is a little more manual but still simple if you follow these steps carefully.
- Find a reliable source. The first step is to download the indicator file (usually an .ex4 or .mq4 file). The official MQL5 community website is generally a safe place to look. We have to give a serious warning here: never, ever download indicator files from a random, untrusted website, especially if they promise guaranteed profits. It’s a huge security risk.
- Open your data folder. Inside your MT4 platform, click on File in the top-left corner, and then select Open Data Folder.
- Find the right folder. A window will pop up showing MT4’s files. Navigate into the MQL4 folder, and then click into the Indicators folder.
- Add the indicator. Move the indicator file you just downloaded into this Indicators folder.
- Refresh. Close and reopen MT4, or go to your “Navigator” window, right-click on “Indicators”, and hit “Refresh”. The Laguerre will now appear in your list, ready to be used.
3.3. Setting Laguerre indicator on MetaTrader 5 (MT5)
The process for MT5 is nearly identical to MT4, with one specific folder change.
- Download the file: Ensure you have the
.mq5or.ex5file from a trusted source (like the MQL5 codebase). - Open Data Folder: In MT5, go to File > Open Data Folder.
- Navigate correctly: Open the MQL5 folder (not MQL4), then open the Indicators folder.
- Install & Refresh: Paste your file here. Restart MT5 or right-click “Indicators” in the Navigator window and select Refresh.
3.4. Adjusting the settings
Instead of guessing, use this cheat sheet to match the Gamma value to specific trading styles. Empirical backtests suggest that higher gamma settings significantly improve win rates in trending markets (Quantified Strategies, 2023).
Gamma Cheat Sheet
| Trading Style | Recommended Timeframe | Suggested Gamma | Trade-off (Pros & Cons) |
| Trend Following / Swing | H1, H4, Daily | 0.7 – 0.85 | Smoother: Excellent noise filtration, but reacts slower to sudden price spikes. |
| Day Trading / Scalping | M5, M15 | 0.35 – 0.5 | Faster: Reacts instantly to price changes, but generates significantly more false signals (noise). |
Visual Optimization: It is also advisable to customize the visual appearance for better clarity. Increasing the line thickness for the main signal line and ensuring the threshold levels (0.15/0.75 or 0.2/0.8) are clearly marked can significantly reduce eye strain and help identify crossover signals instantly.
Important Backtesting Tip: Once the levels and gamma are selected, they must remain fixed throughout the testing phase. Constantly shifting settings to force a past trade to appear profitable is known as “curve-fitting”, a practice that often leads to failure in live trading environments.
4. The strengths and weaknesses of the Laguerre indicator
While Laguerre indicator has some incredible strengths, it also has weaknesses that can hurt you if ignored. Knowing its strengths and weaknesses is crucial for using the tool properly.
4.1. The strengths
When you apply the Laguerre correctly, it offers some compelling strengths that can really clean up your analysis.
- Exceptional noise reduction: Thanks to its underlying filter, it smooths out the chaotic price jitters that often plague standard indicators, leading to a cleaner line and less emotional second-guessing.
- Early and low-lag signals: Because of its low-lag design, the Laguerre can signal a potential shift in momentum before many other oscillators.
- Effortless strategy integration: As a single line that doesn’t clutter your chart, it’s incredibly easy to pair with existing tools like moving averages or trendlines for confirmation signals.
4.2. The weaknesses
No tool is perfect, and ignoring this indicator’s weaknesses can be a costly mistake.
- Unsuitability for sideways markets: When the market is chopping back and forth with no clear direction, the Laguerre line will often hover aimlessly, and trying to find a signal is a waste of time.
- Risk of unreliable trading signals when used alone: This is the most dangerous trap. Because it’s so responsive, the Laguerre can sometimes signal a reversal that never actually happens, which is why you must use it as part of a system.
Piprider’s recommendations:
- Use it on the H1 timeframe or higher. We strongly advise against using this indicator on very low timeframes like M1 or M5. The amount of market noise can overwhelm even a good filter, leading to a stream of unreliable signals and whipsaws.
- Use it as a signal filter, not an entry trigger. This is a hard-earned lesson. The best way to use the Laguerre is as your final confirmation check. It answers the question, “Does the market’s strength agree with our trade idea?” It should not be the primary reason you enter a trade.
5. Trading strategies with the Laguerre indicator
An indicator is only as good as the strategy built around it. The next section details two disciplined, rule-based frameworks to help you find high-probability entries.
5.1. Strategy 1: The EMA Trend Filter
Best for: Trending markets (Trend Following).
Logic: Use the 50 EMA to identify the direction, and Laguerre to time the entry during pullbacks.
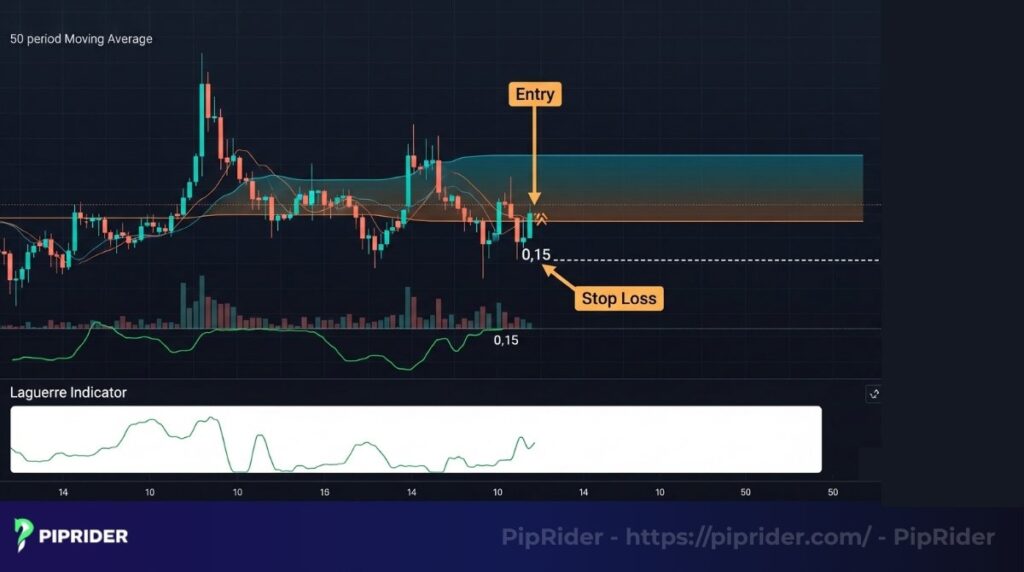
A. Buy Rules (Long Setup):
- Trend Filter: Ensure price is trading above the 50 EMA and the EMA is sloping upwards. (Pro Tip: Advanced traders can also use the Percentage Price Oscillator (PPO) as a filter; if the PPO histogram is positive, the bullish trend is confirmed).
- The Pullback: Wait for the Laguerre line to drop into the oversold zone (below 0.15).
- The Trigger: Enter a Long position when the Laguerre line crosses back up above 0.15.
- Stop Loss: Place below the recent swing low.
- Take Profit: Target a 1:1.5 Risk-Reward ratio or exit when Laguerre hits 0.75.
B. Sell Rules (Short Setup):
- Trend Filter: Ensure price is trading below the 50 EMA and the EMA is sloping downwards.
- The Pullback: Wait for the Laguerre line to rise into the overbought zone (above 0.75).
- The Trigger: Enter a Short position when the Laguerre line crosses back down below 0.75.
- Stop Loss: Place above the recent swing high.
- Take Profit: Target a 1:1.5 Risk-Reward ratio or exit when Laguerre hits 0.15.
5.2. Strategy 2: The Laguerre Divergence
Best for: Identifying market tops and bottoms (Reversal Trading).
Logic: Spot a mismatch between price momentum and the indicator to catch early reversals.
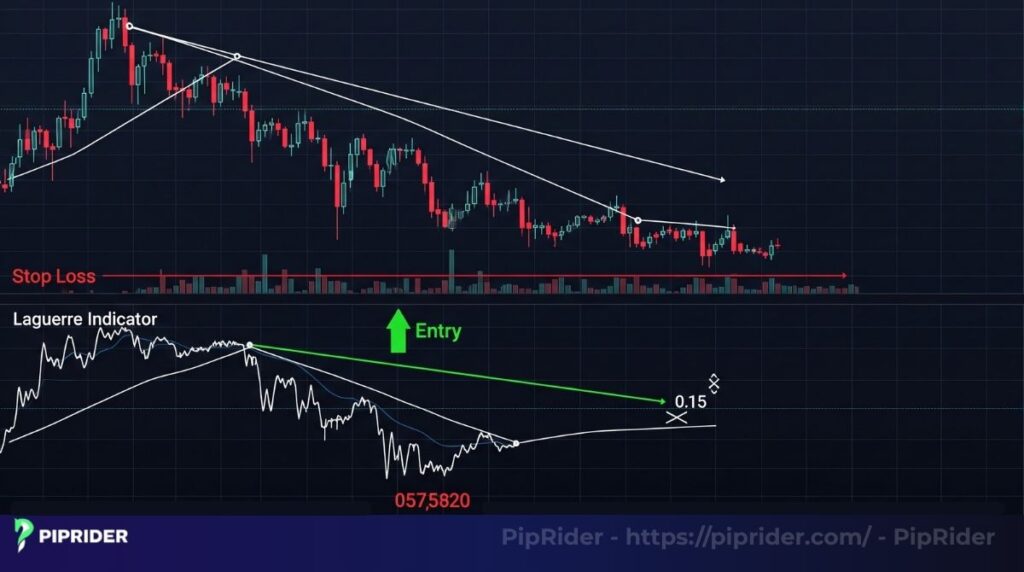
A. Bullish Divergence (Buy Signal):
- Identify: Price forms a Lower Low, but the Laguerre indicator forms a Higher Low.
- The Trigger: Enter when the Laguerre line turns up and crosses above 0.15.
- Stop Loss: Place strictly below the lowest price point of the setup.
B. Bearish Divergence (Sell Signal):
- Identify: Price forms a Higher High, but the Laguerre indicator forms a Lower High.
- The Trigger: Enter when the Laguerre line turns down and crosses below 0.75.
- Stop Loss: Place strictly above the highest price peak of the setup.
6. Laguerre vs. RSI: Which one should you use?
When comparing the old, reliable RSI with the newer Laguerre indicator, the question isn’t “Is one truly better?” A more useful question is, “Which tool is the right one for a specific task?”
Each indicator has distinct characteristics and is suited for different market conditions.
A quick head-to-head comparison:
| Feature | The Classic RSI | The Laguerre |
| Reactivity | Standard | Faster, more responsive |
| Noise Level | Higher | Lower and smoother |
| Installation | Built-in by default | Manual add-on (community script) |
6.1. When should you consider using the Laguerre indicator?
The Laguerre is most effective in the following scenarios:
- When the market is in a clear, trending phase. The smooth nature of the Laguerre line is a significant benefit in this scenario. It helps you stay in a strong trend without getting shaken out by the minor pullbacks that can make the RSI look choppy and confusing.
- When your goal is to get an earlier warning of a potential reversal. The indicator’s low-lag design allows it to provide a subtle hint that the trend is changing, sometimes well before the RSI catches on. This can be invaluable, but the feature comes with a risk that requires strict confirmation.
6.2. Why is the RSI still a valuable tool?
This doesn’t mean you should abandon the RSI entirely. It’s a classic for a reason and continues to be a top performer in specific situations:
- When the market is consolidating within a clear range. In a choppy, non-trending market, the classic 70/30 overbought levels of the RSI can sometimes provide clearer and more reliable signals for mean-reversion trades.
- When you are looking for powerful divergences. Since so many traders watch the RSI, its divergence signals can almost become a self-fulfilling prophecy. However, smart traders verify this. A strong divergence on the RSI carries much more weight if you cross-reference it with the Bulls and Bears Power Indicators to confirm that the underlying buying or selling pressure is actually shifting.
7. Important notes and practical experience
Theory and strategies provide the foundation, but real-world trading presents different challenges. This section details the small, crucial insights learned from years of applying this indicator, practical tips that can save traders significant time and money.
7.1. The most common mistakes
There are two common mistakes when using Laguerre indicator:
- Using the wrong gamma for your style: This is the number one error. A day trader using a fast gamma of 0.3 will be driven crazy by unreliable signals. A trader using a slow gamma of 0.8 will miss every move. You must match the gamma setting to your timeframe and goal. Don’t just copy a setting you saw somewhere; test it and see if it makes sense to you.
- Ignoring the primary trend: A trader sees the Laguerre cross up from its overbought and jumps into a buy, completely ignoring that the price is in a massive downtrend below every major average. This is like checking the wind speed without looking at the direction of the hurricane. The primary trend will almost always win.
7.2. Wisdom from the trading community
After seeing countless charts and talking with other traders, a few key themes always emerge about this indicator.
- It works best in long, steady trends: While it can spot reversals, its true strength is in helping you navigate those long, drawn-out trends where the price grinds up or down for days. The smoothness of the Laguerre line helps you stay patient and not get shaken out by minor corrections.
- It becomes incredibly powerful with price action: A Laguerre signal on its own is just an idea. But a Laguerre crossover that happens immediately after a bullish engulfing candle forms at a key support level? That’s a high-probability setup. Always look for price action to confirm what the indicator is suggesting.
- Consider multi-timeframe analysis: Using the Laguerre on a higher timeframe can help you determine the overall trend direction, while a lower timeframe can be used for precise entry timing.
7.3. A final, crucial warning
If there is only one thing you take away from this guide, let it be this: do not become dependent on this or any other indicator. Its purpose is to assist your brain, not replace it.
The market is always changing. A setting that works today might not work tomorrow. But if you understand the principle behind the tool, that it’s a low-lag filter designed to track the market cycle, you can adapt your thinking. A trader who understands the why will always beat a trader who is just blindly following a line on a screen.
8. Frequently asked questions about Laguerre Indicator
Here are some quick, no-nonsense answers to the most common questions traders ask about this unique indicator.
9. Conclusion
So, is the Laguerre indicator worth a spot on your charts? Our answer is yes, but with one critical condition. While this indicator’s ability to smooth noise and give early signals is impressive, it should be used to confirm your existing strategy, not replace it.
We strongly recommend you experiment with this tool as a signal filter to see if it improves your timing and confidence. Your next steps are simple: backtest a strategy that fits your style, then learn how complementary tools like Volume or the ATR can provide that final layer of confirmation.
To continue building your technical analysis toolkit, we invite you to explore more guides in the Learn Forex category, right here on Piprider.


