Identifying the very beginning of a new trend is a key goal for any trader. The Vortex Indicator (VI) is a technical analysis tool specifically designed for trend identification, pinpointing the start of a new trend and confirming its direction. Drawing inspiration from the natural swirling vortex motion, the indicator captures the market’s underlying positive and negative trend movements. This guide explains its formula, interpretation, and how to use it for effective trend trading.
Key Takeaways
- Trend tracking: The Vortex Indicator tracks trend direction with two lines: +VI (bullish) and -VI (bearish).
- Signal core: Crossovers between the +VI and -VI lines signal the start of a new trend.
- Market context: It is prone to false signals (whipsaws) in sideways or choppy markets.
- Synergy: Works best when combined with other indicators like the ADX or RSI for confirmation.
1. What Is the Vortex Indicator (VI)?
The Vortex Indicator (VI) is a technical analysis tool designed to identify the start of a new trend and confirm its direction. Developed by Etienne Botes and Douglas Siepman and introduced in 2010, its primary function is to help traders catch trends right as they begin to form (Botes & Siepman, 2010; Farley, 2024). Drawing inspiration from the natural swirling motion of a vortex, the indicator captures the market’s underlying positive and negative trend movements.
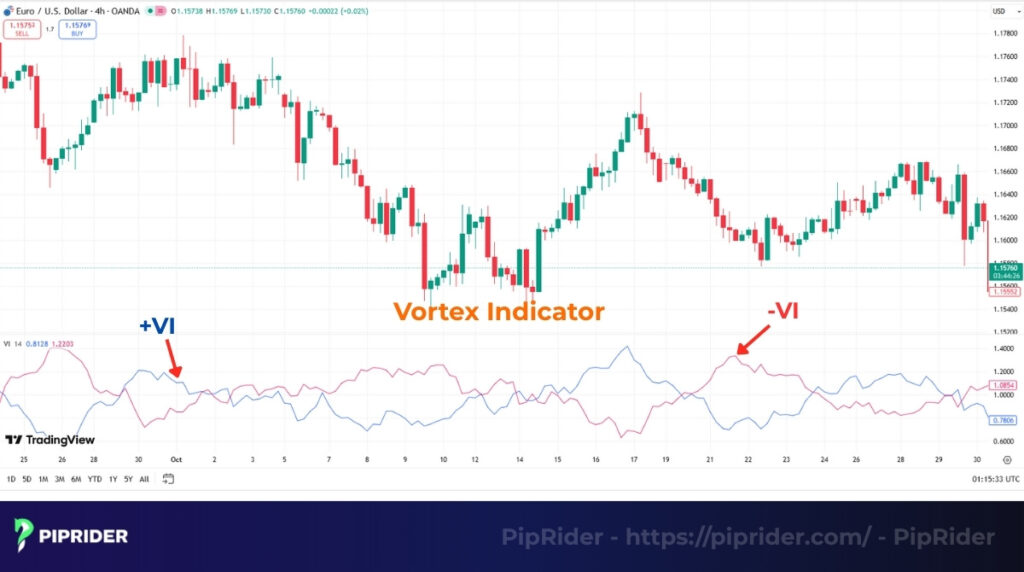
It achieves this by plotting two oscillating lines that represent the ongoing battle between buyers and sellers:
- The positive vortex (+VI): Measures the strength of upward price movement from one period’s low to the next’s high, representing the force of the bulls.
- The negative vortex (-VI): Measures the strength of downward price movement from one period’s high to the next’s low, representing the force of the bears.
2. How the Vortex Indicator Works
The Vortex Indicator operates on a simple premise: it measures the distance between the highs and lows of consecutive periods to gauge trend direction. The +VI line specifically tracks upward price movement, representing bullish momentum, while the -VI line tracks downward price movement, representing bearish momentum.
The core trading signals are generated when these two lines intersect:
- Bullish signal: Occurs when the +VI line crosses above the -VI line. This indicates that the upward trend movement is overpowering the downward movement, signaling the potential start of a new uptrend.
- Bearish signal: Occurs when the -VI line crosses above the +VI line. This suggests that bearish momentum is taking control, pointing to the beginning of a new downtrend.
The Vortex Indicator’s components are calculated similarly to those of the Directional Movement Index (DMI), but they serve different functions. The VI is designed to signal a change in trend direction, while the DMI’s ADX line measures trend strength.
3. The Vortex Indicator Formula
The Vortex Indicator’s calculation involves a few key steps that measure upward and downward price movements and then normalize them against the asset’s recent volatility.
3.1. Step-by-Step Calculation
The indicator is built from the ground up using these five components over a lookback period (typically n = 14):
1. True Range (TR): Measures volatility. The TR is the greatest of the following:
- Current High – Current Low
- |Current High – Previous Close|
- |Current Low – Previous Close|
2. Positive Vortex Movement (VM+): Next, it measures the distance between the current high and the previous low to capture upward movement.
VM+ = |Current High – Previous Low|
3. Negative Vortex Movement (VM-): Measures the distance between the current low and the previous high to capture downward movement.
VM- = |Current Low – Previous High|
4. The +VI and -VI Lines: The indicator sums the VM+ and VM- values over n period and divides them by the sum of the True Range (TR) over the same period. This normalizes the trend movement against volatility (TradingView, n.d.).
+VI = Sum of VM+ over ‘n’ periods / Sum of TR over ‘n’ periods
-VI = Sum of VM- over ‘n’ periods / Sum of TR over ‘n’ periods
The default parameter length for n is 14 periods, but traders can adjust this to fit their specific trading style: a shorter period for more sensitivity or a longer one for less noise.
Read more:
How to use Forex level indicators to enter like a pro (2025)
Confused by charts? A beginner’s arrow trend indicators guide
4. How to Add the Vortex Indicator to Your Chart
Whether you are using web-based platforms or desktop terminals, adding the Vortex Indicator is a straightforward process. Setting the indicator correctly from the start is essential for accurate signal generation.
4.1. TradingView
- Open your chart and click on the Indicators button at the top navigation bar
- Type “Vortex Indicator” in the search bar and select the built-in version provided by the platform
- In the settings menu, the default Length is 14. You can adjust this to 21 or 30 depending on your strategy; using a longer period is generally recommended to reduce market noise and filter out minor price fluctuations (TradingView, n.d.)
4.2. MetaTrader 4 (MT4)
- Open the Navigator window (Ctrl+N) and navigate to the Indicators folder
- Look under the Trend subfolder. If the VI is not pre-installed, you must download a custom .mq4 or .ex4 file and place it in the MQL4/Indicators directory of your platform
- Drag the indicator onto your active chart. Ensure the input parameters are set to 14 for standard sensitivity or higher if you require smoother, less reactive data
5. How to Interpret the Vortex Indicator
Interpreting the VI is a visual process focused on the interaction between the +VI and -VI lines. To use this tool effectively, professional traders look for three primary signals: crossovers, baseline thresholds, and momentum divergences.
5.1. Bullish and Bearish Crossovers
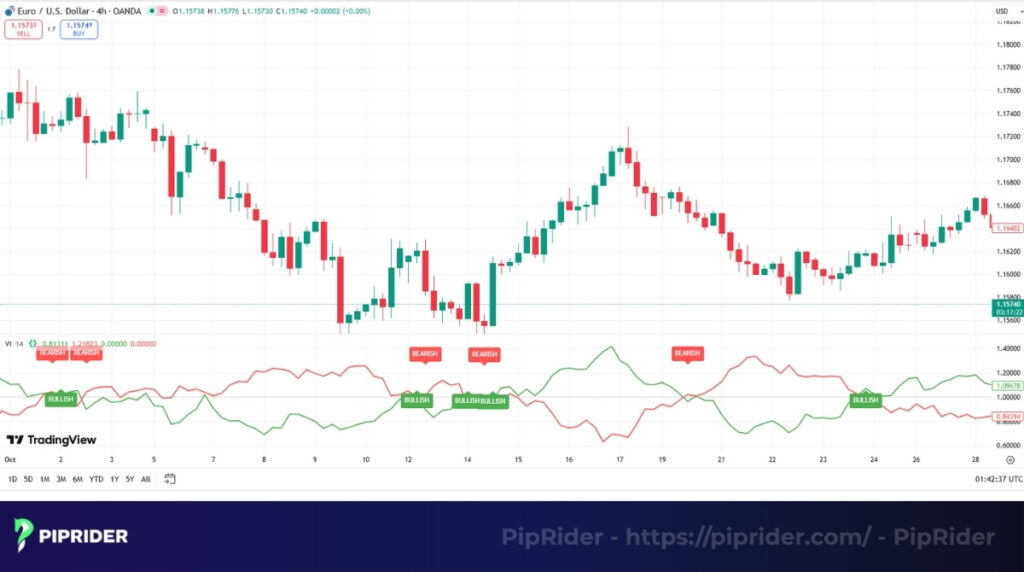
The most direct trading signals are generated by crossovers, which indicate a decisive shift in market bias:
- Bullish crossover: Occurs when the +VI line crosses above the -VI line. This suggests the birth of a new uptrend.
- Bearish crossover: Occurs when the -VI line crosses above the +VI line. This signals that a new downtrend may be accelerating.
5.2. The Baseline and Threshold Approach
A common mistake is trading every crossover in isolation. To filter out market noise and “whipsaws”, many technical analysts use the 1.0 level as a critical baseline (StockCharts.com, n.d.).
- The equilibrium point: Since +VI and -VI are normalized, they typically oscillate around the 1.0 baseline. When both lines are hovering near 1.0, the market is in equilibrium (sideways).
- Threshold confirmation: To secure a “higher-probability” entry, look for the +VI
or -VI to not just cross, but exceed a specific threshold (e.g., 1.10).- High-quality bullish signal: The +VI crosses above -VI and moves above 1.10, while the -VI drops below 0.90.
- High-quality bearish signal: The -VI crosses above +VI and moves above 1.10, while the +VI drops below 0.90.
This threshold approach ensures that you are entering a trend that has genuine momentum rather than a temporary price flicker.
5.3. Trend Strength Confirmation
The visual relationship between the two lines provides a quick gauge of how much “fuel” is left in a trend.
- Widening gap: When the distance between the +VI and -VI lines increases after a crossover, it confirms that the current trend is gaining strength and volume.
- Intertwined lines: If the two lines remain close or cross back and forth frequently, the market is choppy. In this scenario, all crossover signals should be ignored until a clear separation occurs.
5.4. Divergence and Early Warning Signals
Divergences occur when price action and the Vortex indicator fall out of sync, providing an early warning that a reversal is looming.
- Bearish divergence: If the price makes a higher high, but the +VI line makes a lower high, it suggests the uptrend is losing its underlying energy despite the price increase.
- Bullish divergence: If the price hits a lower low, but the -VI line fails to reach a higher peak (indicating weakening bearish pressure), a bullish reversal may be imminent.
6. Using the Vortex Indicator in Trading
The Vortex Indicator is a powerful tool, but it is not a standalone trading system. To maximize its effectiveness and filter out false signals, especially in choppy markets, it should always be integrated into a broader technical analysis framework.
6.1. Indicator Synergy
A common best practice is to combine the VI with complementary technical indicators to validate signals:
- Trend filters: Use a long-term Moving Average (like the 200-period EMA) to define the primary trend direction. Professional traders often only take VI crossover signals that align with this long-term bias.
- Momentum oscillators: Indicators like the RSI or MACD can confirm that momentum is shifting in the direction of the VI crossover, reducing the risk of entering late.
6.2. Market Context and Volume Confirmation
The most reliable signals occur when a VI crossover aligns with significant market context, such as a price bounce off a key support/resistance level or a breakout from a long-term consolidation pattern.
A note on volume: A surge in trading volume often validates a VI signal, indicating strong institutional participation. However, traders must distinguish between asset classes:
- Centralized markets (stocks/futures): Actual volume data is available and highly reliable for confirming VI signals.
- Spot Forex: Because there is no central exchange, volume data is typically “tick volume” (a proxy for activity). In spot FX, treat volume as supportive evidence rather than a definitive confirmation.
By combining the VI’s directional signals with structural levels and volume proxies, you can significantly increase your win rate while avoiding common traps in lower-liquidity environments.
7. Vortex Indicator Trading Strategies
The Vortex Indicator’s signals are most effective when integrated into a structured trading plan. By adding specific entry triggers and risk management rules, traders can filter out noise and protect their capital.
7.1. Basic Crossover + Trend Filter
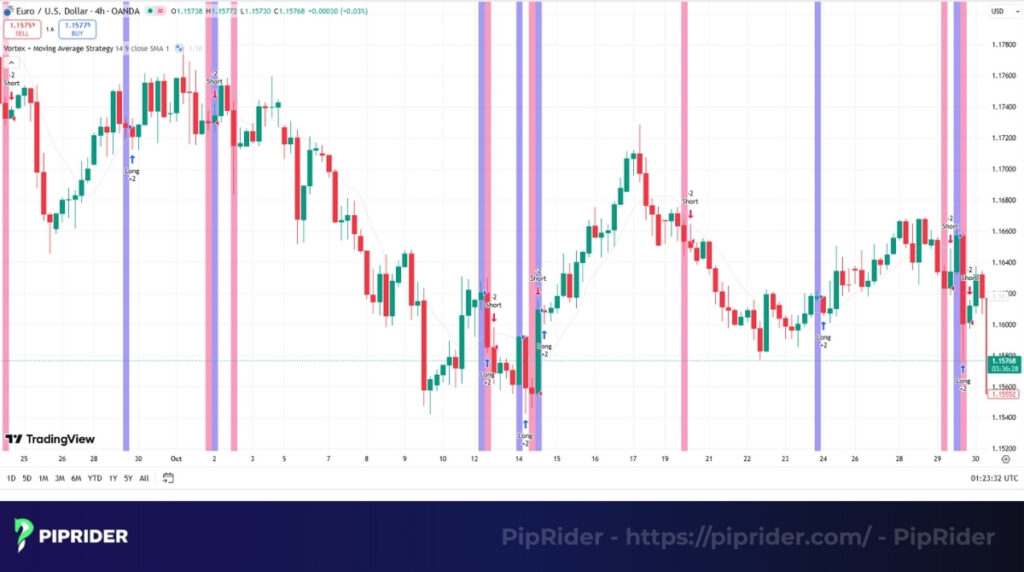
This strategy combines the VI’s directional signal with a 20-period Moving Average (MA) to ensure you are trading in the direction of immediate price momentum.
- Entry trigger:
- Buy: +VI crosses above -VI and the price closes above the 20-period MA.
- Sell: -VI crosses above +VI and the price closes below the 20-period MA.
- Stop-Loss (SL): Place SL below the most recent swing low (for Longs) or above the most recent swing high (for Shorts).
- Take-Profit (TP): Exit at the next major structural level (Support/Resistance) or use a 2:1 Reward-to-Risk ratio.
- Exit rule: Close the trade if the VI lines cross back in the opposite direction or if the price closes on the opposite side of the 20-period MA.
- Invalidation: If the price immediately breaks the recent swing high/low before the first momentum candle closes, the setup is void.
7.2. Vortex + ADX Filter
To mitigate “whipsaws” in sideways markets, this strategy uses the Average Directional Index (ADX) to ensure the market is sufficiently trending before taking a VI signal.
- Entry trigger: Only execute a VI crossover (Bullish or Bearish) if the ADX is currently above 25. If ADX is below 20, the market is ranging; ignore all VI crossovers.
- Stop-Loss (SL): Set SL at the high/low of the signal candle.
- Take-Profit (TP): Trail your stop-loss behind the -VI (for Longs) or +VI (for Shorts) to capture the maximum trend extension.
- Exit rule: Exit when the ADX begins to curve downward significantly or a counter-VI crossover occurs.
- Invalidation: The setup is invalidated if the ADX drops below 20 immediately after entry, signaling a failed breakout.
7.3. Short-Term (H1/H4) Reversal Setup
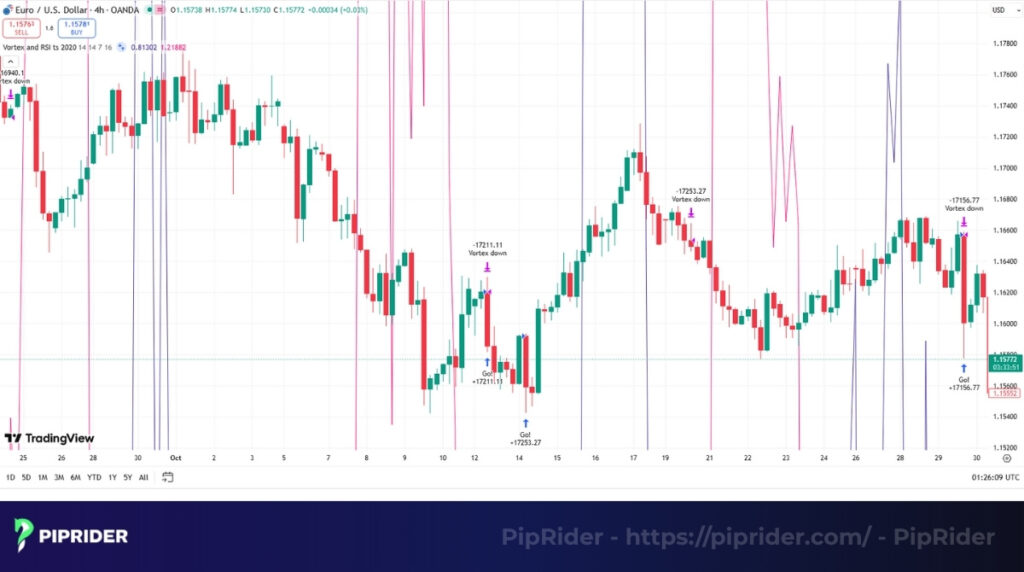
While the VI is often too lagging for M1/M5 scalping, it is highly effective for short-term “swing” reversals on the H1 or H4 charts when paired with the RSI.
Note: This setup is not recommended for M1/M5 timeframes due to the inherent lag of the Vortex formula.
- Entry trigger:
- Buy: +VI crosses above -VI while the RSI is rising from below the 30 level (oversold).
- Sell: -VI crosses above +VI while the RSI is falling from above the 70 level (overbought).
- Stop-Loss (SL): 10–20 pips/points below/above the reversal candle.
- Take-Profit (TP): Target the RSI reaching the opposite extreme (e.g., if you bought at 30, target RSI 70).
- Exit rule: Close if the RSI flattens out or the VI lines intertwine, indicating a loss of momentum.
- Invalidation: If the RSI returns to the extreme zone (overbought/oversold) within 2 candles of entry, the reversal has likely failed.
8. Vortex Indicator vs. Directional Movement Index (DMI)
At first glance, the Vortex Indicator (VI) and the Directional Movement Index (DMI) appear similar, as both utilize positive and negative directional lines. However, they are engineered for different analytical purposes: the VI excels at spotting trend genesis, while the DMI focuses on quantifying trend intensity.
Here is a direct comparison of their key differences:
| Aspect | Vortex Indicator (VI) | Directional Movement Index (DMI) |
| Components | Two lines: +VI and -VI | Three lines: +DI, -DI, and ADX |
| Main Goal | To detect the precise beginning of a new trend | To measure the strength and persistence of the current trend |
| Signal Logic | Crossovers between $+VI$ and $-VI$, often filtered by a 1.0 baseline | Crossovers between +DI and -DI, strictly filtered by the ADX line |
| Typical Use | Trend-following and early breakout identification | Trend strength confirmation and filtering out sideways noise |
In short, a trader uses the Vortex Indicator to answer, “Is a new trend starting now?” In contrast, a trader uses the DMI to answer, “Is the current trend strong enough to trade?”. Many professional systems combine these tools, using the VI for a precise entry trigger and the DMI’s ADX line for structural confirmation.
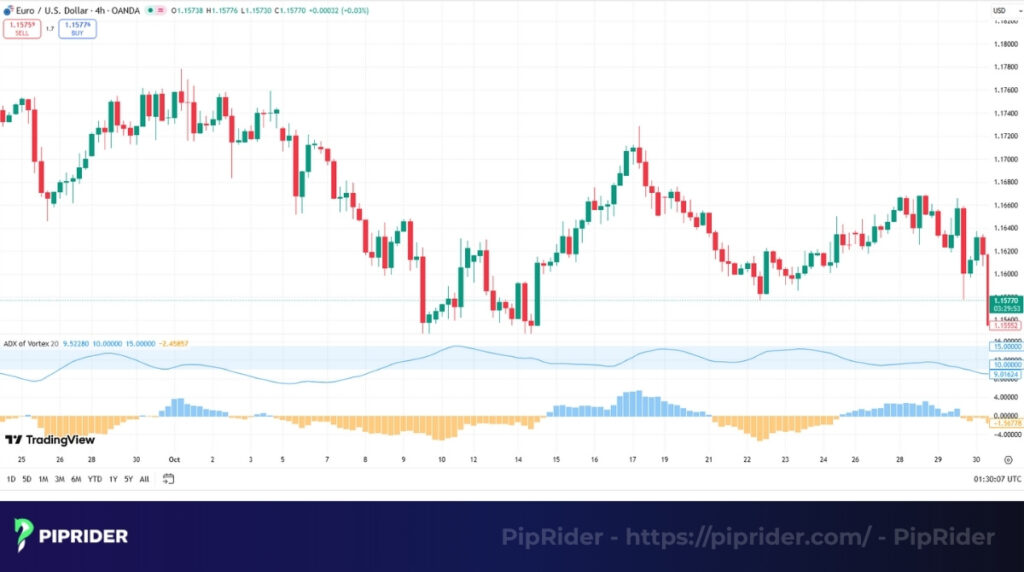
9. Example of the Vortex Indicator in Action
Applying theory to a real-world scenario is the best way to master the Vortex Indicator’s signals. Let’s analyze a EUR/USD daily chart to see how the VI identifies high-probability trade opportunities.
In this example, we observe two distinct market shifts:
- The Bullish Breakout Confirmation: After a period of consolidation, the price breaks out of a tight range. Simultaneously, the +VI(typically green) crosses decisively above the -VI line (typically red). This crossover serves as objective confirmation that the bullish breakout has sufficient momentum to sustain a new trend.
- The Bearish Reversal Signal: As the uptrend exhausts its buyers, the price forms a “lower high”—a classic sign of weakness. The -VI line then crosses above the +VI line, signaling a bearish reversal. This provides a timely exit signal for long positions and an early entry trigger for a new short trade.
A professional tip on confirmation: In this example, a trader would look for a surge in volume during the initial breakout to add weight to the +VI signal. However, remember that in spot FX, you are typically viewing tick volume (a proxy for activity). While not as definitive as centralized exchange volume, a relative spike in tick volume remains a strong supportive indicator for VI, confirmed breakouts.
10. Advantages and Limitations of the Vortex Indicator
Like any technical tool, the Vortex Indicator has clear strengths and weaknesses. Understanding both is key to maintaining a disciplined trading approach and avoiding common pitfalls.
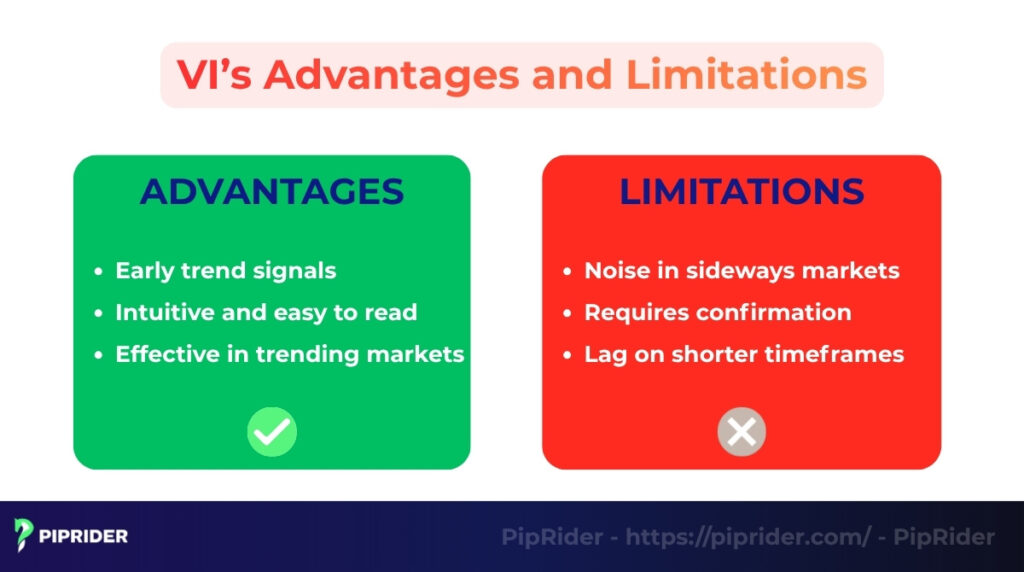
10.1. Advantages
The primary strengths of the VI lie in its focus on trend initiation and its clear visual signals.
- Early trend identification: Its primary advantage is the ability to signal the very beginning of a new trend, often providing earlier entry points than lagging trend, following indicators like large-period moving average crossovers.
- Intuitive and objective signals: The indicator is visually straightforward. The +VI and -VI crossover logic is clear and unambiguous, making it accessible for traders of all experience levels.
- Effective in trending markets: In a market with a clear, sustained direction, the VI is highly efficient at keeping a trader on the right side of the trend and preventing premature exits.
10.2. Limitations
To avoid costly mistakes, it’s crucial to understand the indicator’s inherent mathematical boundaries.
- Noise in sideways markets: Its most significant drawback is poor performance in ranging or choppy markets. During these periods, the +VI and -VI lines will “intertwine”, generating a series of false signals known as whipsaws.
- Lack of strength quantification: The VI measures trend direction, not trend intensity. Without an additional filter like the ADX, a trader may enter a “directional” move that lacks the volume or strength to become profitable.
- Lag on lower timeframes: While the VI is versatile, its lagging nature is highly pronounced on timeframes below the 1-hour chart (H1). Consequently, it is generally ineffective for M1 or M5 scalping, as the price often moves significantly before the vortex lines can calculate and signal the shift.
To mitigate these limitations, always prioritize the Threshold Approach (e.g., 1.10/0.90) discussed in the interpretation section.
11. Frequently asked questions about Vortex Indicator
12. The Bottom Line
The Vortex Indicator (VI) is a powerful and intuitive tool for traders focused on capturing new market trends. By providing clear visual signals for shifts in market bias, it serves as a robust foundation for trend-following and breakout strategies.
However, the VI is most effective when used as a component of a larger trading system. For the best results, always filter its crossover signals using trend-strength indicators like the ADX, momentum oscillators like the RSI, or structural filters like a Moving Average. This combination allows you to not only spot emerging trends but also confirm their validity, significantly improving your overall trading accuracy.
To further refine your technical analysis skills and discover more advanced trading tools, explore our comprehensive indicators hub or visit the Learn Forex (Expert) section on Piprider.