For day traders, identifying precise levels for reversals and breakouts is a constant challenge. Enter the Camarilla Pivot Points, a powerful tool designed specifically for intraday trading. This guide provides a complete playbook for the Camarilla Pivot Points Strategy, breaking down its unique calculation and the core trading setups that can give traders an edge.
Key Takeaways
- Camarilla Pivot Points are a key tool for day traders, providing reliable support and resistance levels.
- The pivots are calculated from the previous day’s closing price to forecast potential intraday turning points.
- Mastering the Camarilla Pivot Points Strategy involves understanding range reversals at S3/R3 and trend breakouts at S4/R4.
- The strategy’s reliability increases when combined with other indicators and disciplined risk control.
1. What Are Camarilla Pivot Points?
In technical analysis, Camarilla Pivot Points are a versatile tool used primarily by day traders to identify key intraday levels of support and resistance. They consist of a central pivot point (PP) and eight corresponding levels above and below it: four resistance levels and four support levels.
According to BabyPips, the Camarilla Pivot Points concept was introduced in 1989 by Nick Scott, a successful bond trader. The key difference from conventional pivot points lies in its calculation; the Camarilla formula uses a special multiplier that keeps the support and resistance levels much closer to the current price (BabyPips, n.d.). This makes it particularly effective for short-term and range-bound trading.
Their primary role is to provide traders with clear, objective levels for decision-making. These pivots are used to determine precise entry points, place logical stop-loss orders, and set profit targets. By providing a pre-calculated map of potential turning points, Camarilla Pivots are an essential tool for day trading risk management.
2. How To Calculate Camarilla Pivot Points?
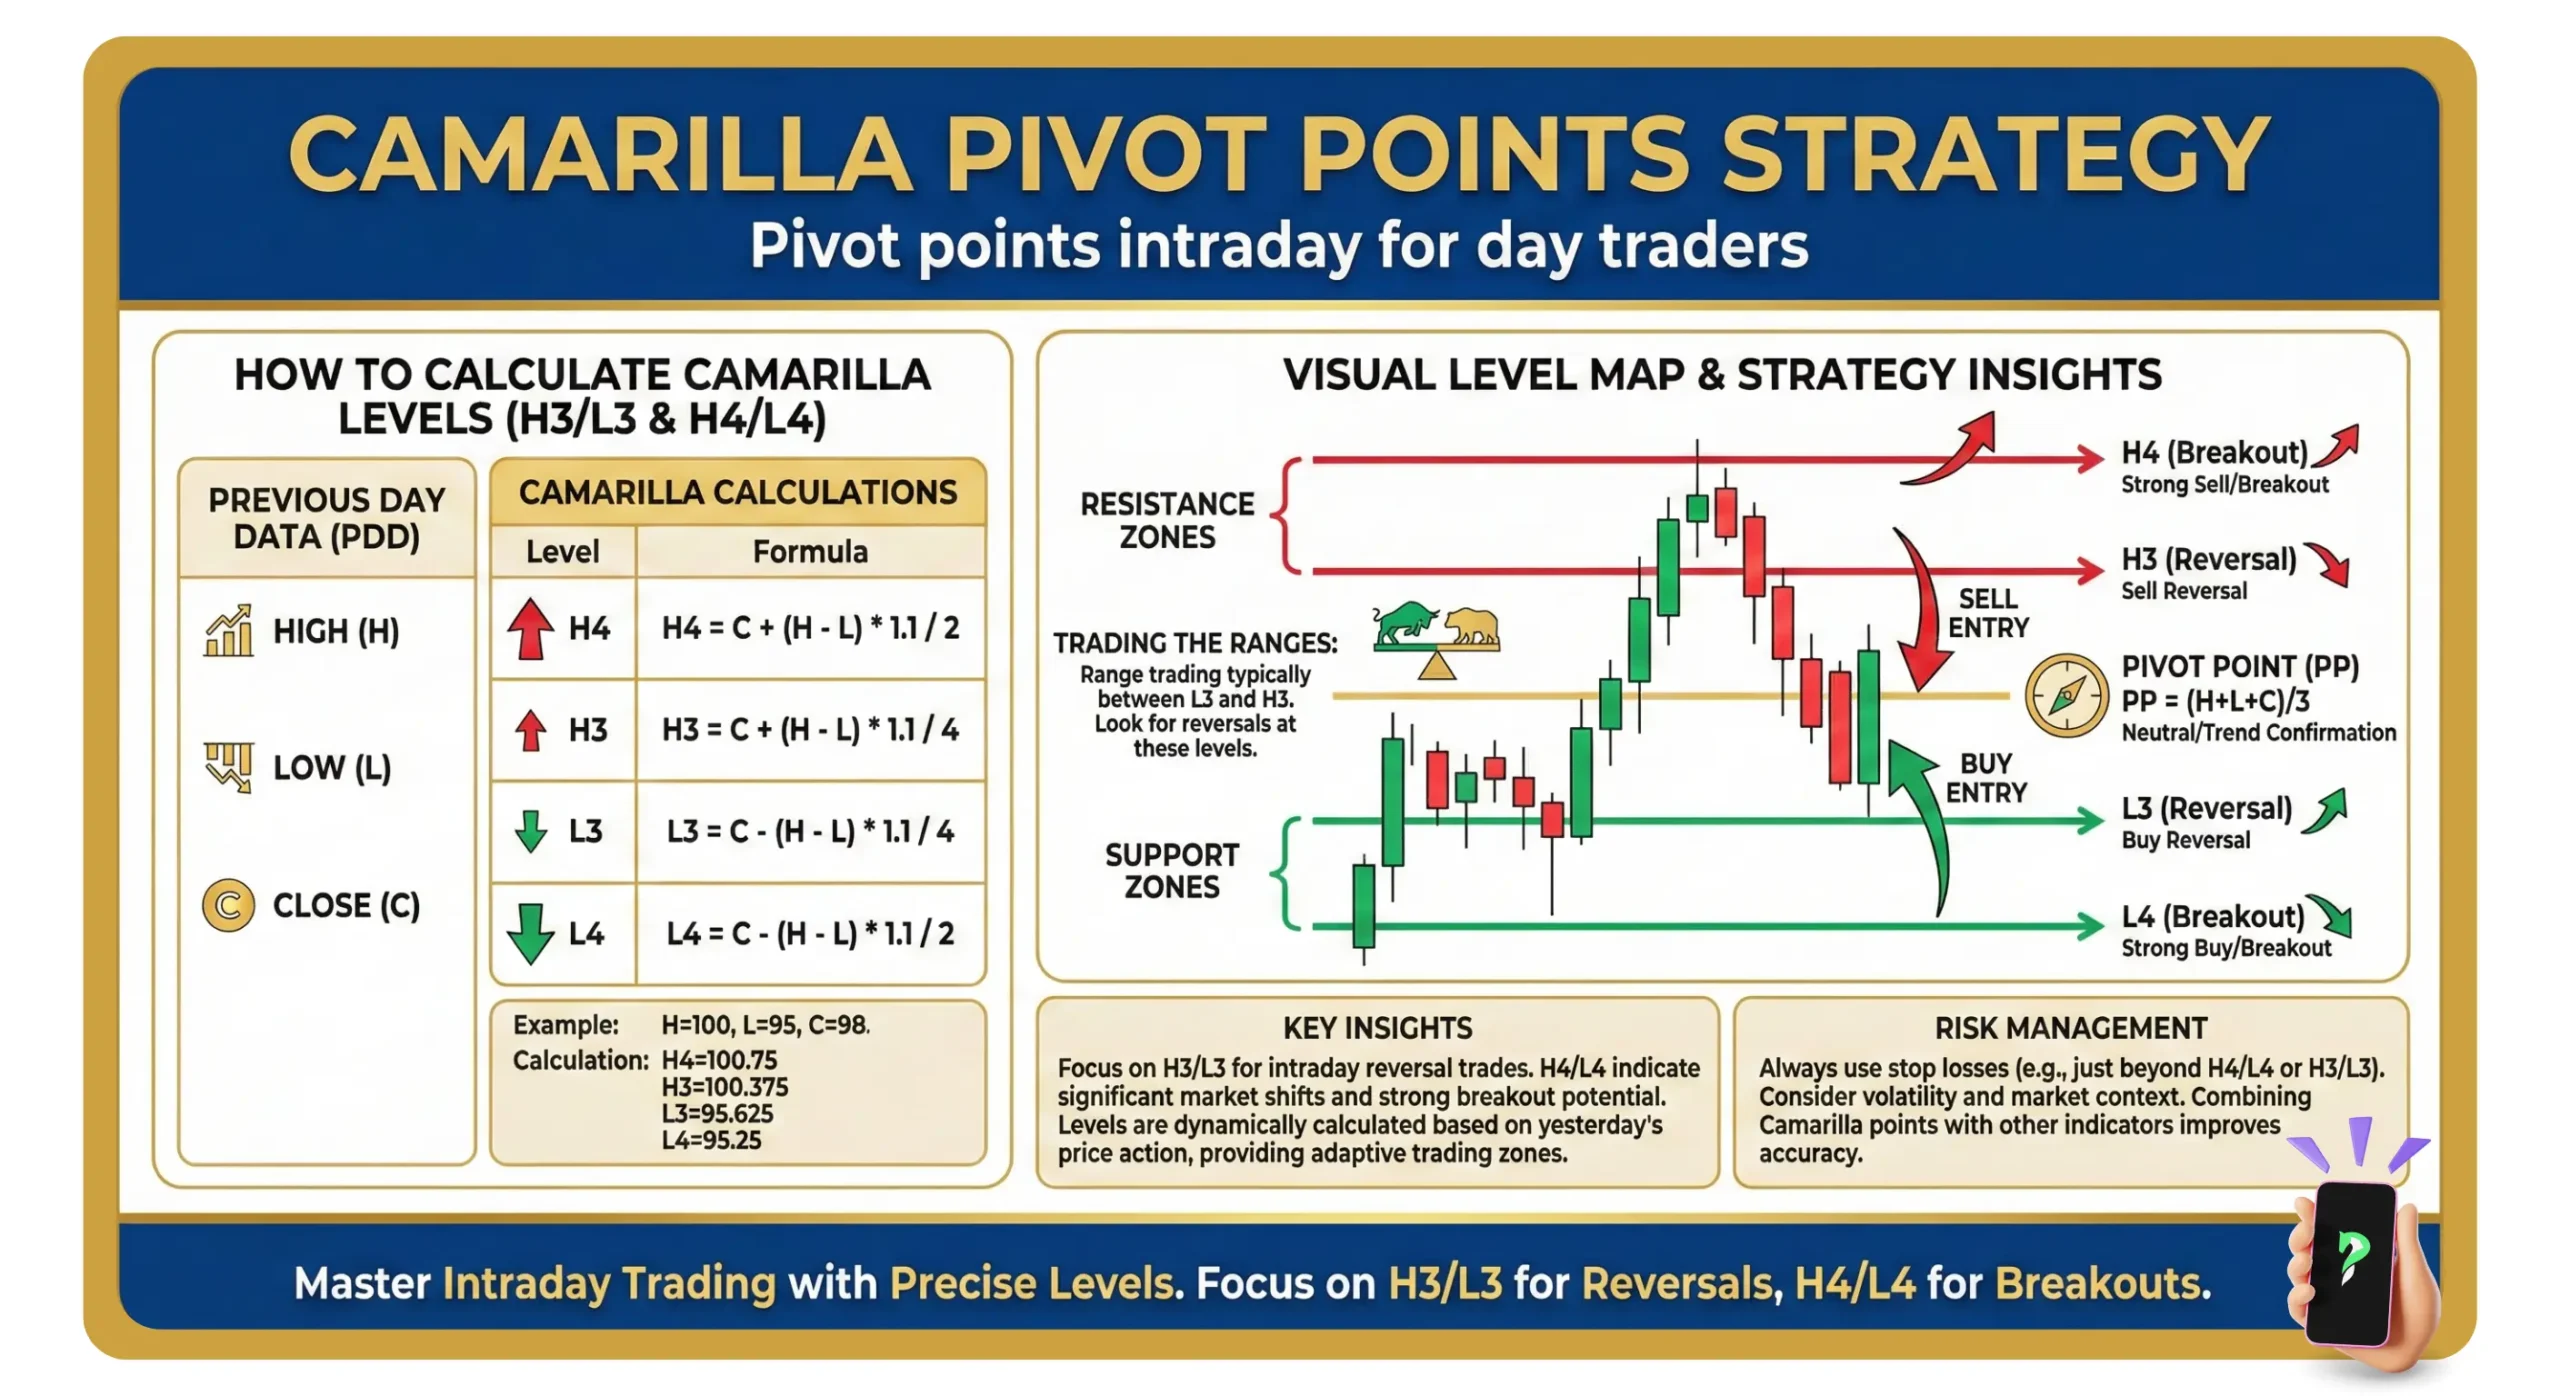
The Camarilla Pivot Points are calculated using the previous day’s high (H), low (L), and close (C) prices to forecast potential intraday turning points (BabyPips, n.d.). The formula generates a total of eight primary levels: four resistance levels (R1-R4) and four corresponding support levels (S1-S4).
2.1. The Camarilla Formula
To calculate the levels, the following variables from the previous trading day are used:
- H: The high price
- L: The low price
- C: The closing price
The levels are then calculated as follows:
Resistance Levels:
| R4 = C + ((H – L) * 1.1 / 2) R3 = C + ((H – L) * 1.1 / 4) R2 = C + ((H – L) * 1.1 / 6) R1 = C + ((H – L) * 1.1 / 12) |
Support Levels:
| S1 = C – ((H – L) * 1.1 / 12) S2 = C – ((H – L) * 1.1 / 6) S3 = C – ((H – L) * 1.1 / 4) S4 = C – ((H – L) * 1.1 / 2) |
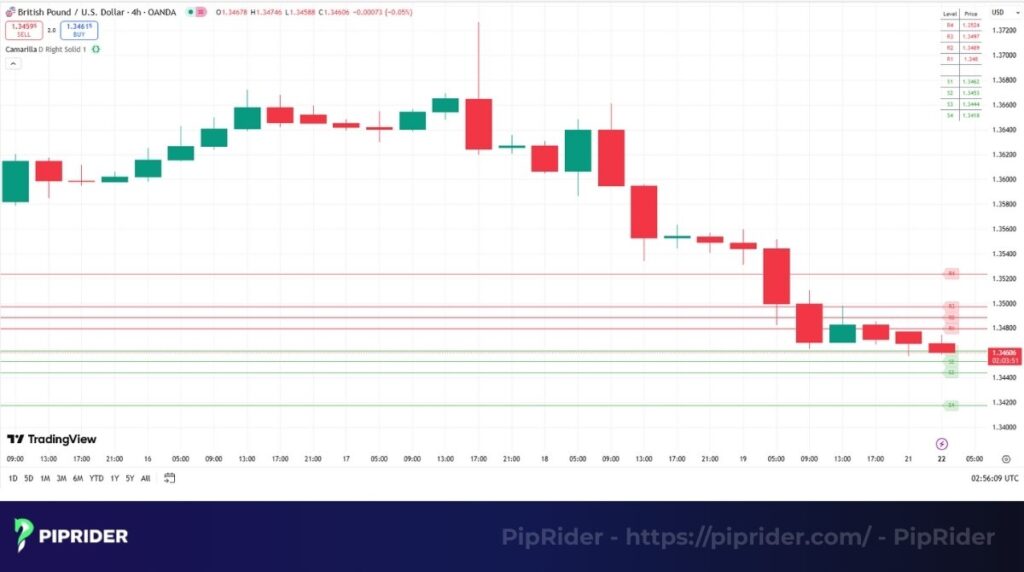
Crucial Note on Forex Timezones: Because the forex market operates 24/5, there is no universal exchange closing bell. To calculate accurate Camarilla Pivots, you must use a consistent daily close time, the industry standard is the New York close (5:00 PM EST). Ensure your charting platform or broker uses “New York Close charts”; otherwise, your H, L, and C data will shift based on the broker’s server time (e.g., midnight GMT), resulting in completely misaligned pivot levels.
2.2. Calculation Example
Let’s assume the EUR/USD currency pair had the following daily prices on the previous trading day:
- High (H): 1.1100
- Low (L): 1.1000
- Close (C): 1.1080
The daily price range is 1.1100 – 1.1000 = 0.0100 (or 100 pips). Using this range, we can calculate the key R3 and S3 levels for today’s intraday trading:
- R3 (Resistance) = 1.1080 + ((0.0100) * 1.1 / 4) = 1.1080 + 0.00275 = 1.11075
- S3 (Support) = 1.1080 – ((0.0100) * 1.1 / 4) = 1.1080 – 0.00275 = 1.10525
Note: In Forex, these strict mathematical levels provide highly accurate zones where the EUR/USD is likely to reverse or break out during the London or New York sessions.
2.3. Comparison with Traditional Formulas
The Camarilla formula’s direct relationship to the previous day’s close and its unique multipliers create the distinct, tighter levels that day traders value. While the Camarilla system is optimized for intraday volatility, it is part of a broader family of pivot indicators.
| Pivot System | R1 Calculation Formula |
|---|---|
| Camarilla | C + ((H – L) * 1.1 / 12) |
| Classic | (Pivot Point * 2) – L |
| Fibonacci | Pivot Point + ((H – L) * 0.382) |
| Woodie | (Pivot Point * 2) – L (Note: PP is calculated differently) |
💡 Trading Tip: If you want to master the foundational mathematics before moving to advanced Camarilla setups, we recommend reading our comprehensive guide on Classic Pivot Points to see how they differ in trending markets.
3. Mastering the Camarilla Pivot Points Strategy: Core Trading Setups
Before executing specific setups, it is crucial to understand the distinct roles of the S3/R3 and S4/R4 levels. Their function changes dramatically depending on the daily market regime (Trend Day vs. Range Day).
The Camarilla Zone Playbook
- S3 & R3 (The Key Decision Zones): These are the primary boundaries. In a ranging market, traders look for mean-reversion bounces here. In a trending market, a decisive 15-minute or 1-hour candle close beyond S3/R3 provides the first breakout confirmation.
- S4 & R4 (The Extreme / Last Line): These are the outermost extremes. A strong, sustained push through S4/R4 signals breakout acceleration (a heavy trend day). Conversely, a rejection at these extremes sets up a high-probability failed-break reversal.
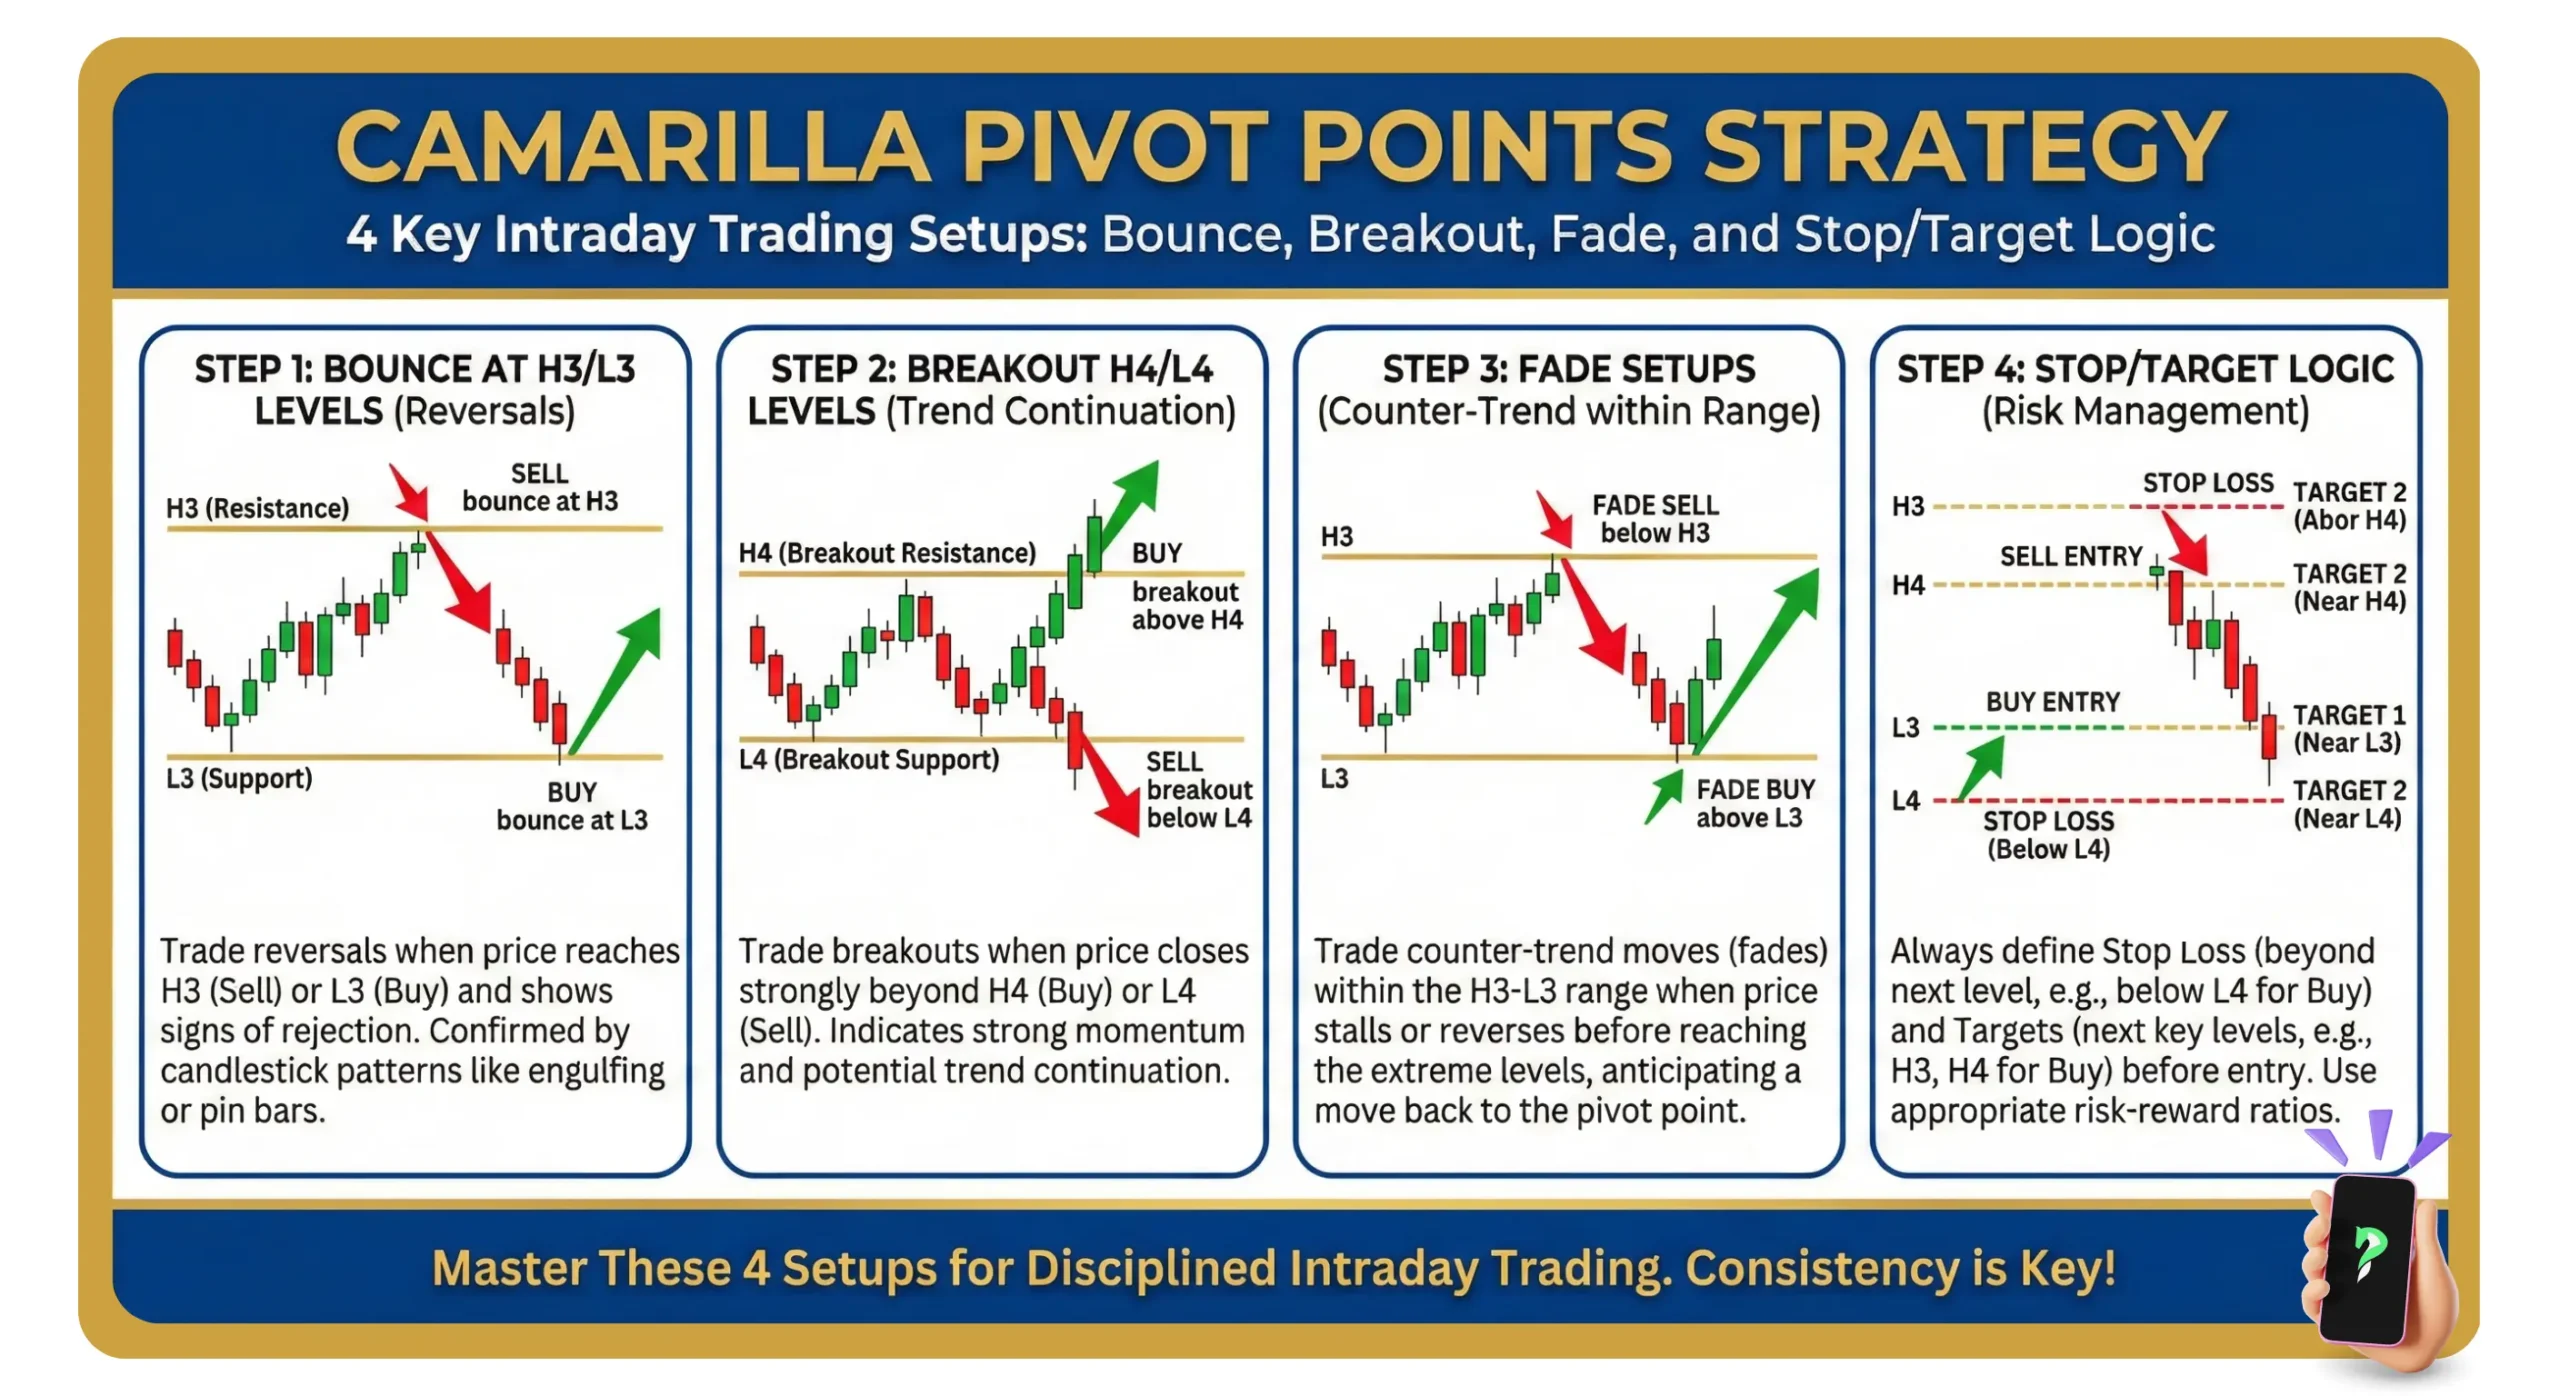
3.1. The Range Strategy (S3 & R3 Bounce)
This is the most popular Camarilla pivot strategy, designed for sideways or range-bound markets. The strategy uses the S3 and R3 levels as the boundaries of a potential intraday trading range.
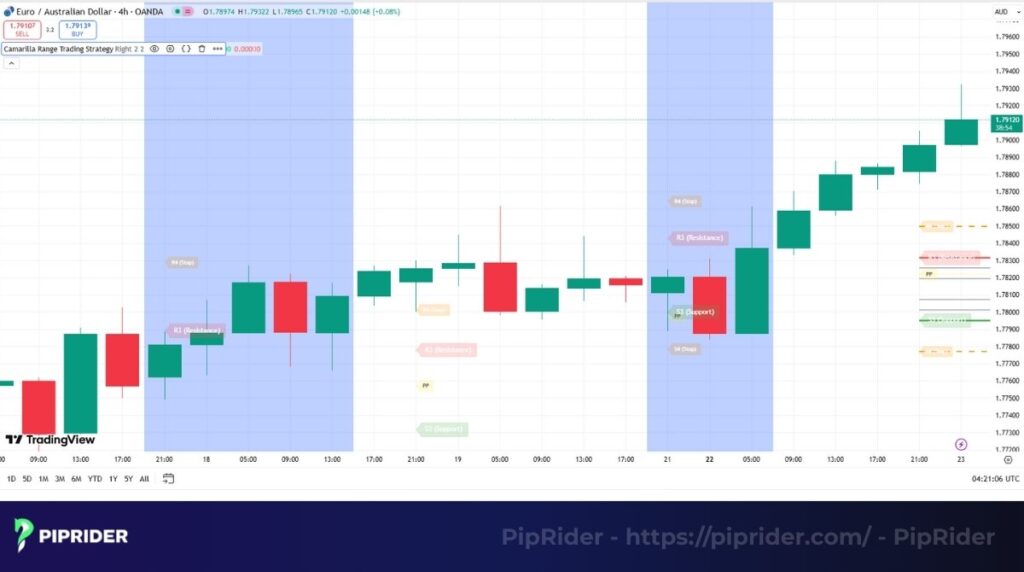
- Entry: Look to sell when the price tests and rejects the R3 resistance level with a bearish candlestick. Buy when the price tests and rejects the S3 support level with a bullish candlestick.
- Exit (SL & TP): To maintain a strong Risk/Reward ratio, place your stop-loss just outside the high/low of your specific rejection candle (plus a spread buffer)—do not place it all the way at R4/S4, as breaking the S3/R3 zone invalidates the range setup. The take-profit target is the opposite side of the range (target S3 for a sell, and R3 for a buy).
- Trade Filter / Invalidation: Strictly avoid executing range trades during high-impact economic news releases or extreme volatility spikes. During these periods, market noise will easily shatter the S3/R3 boundaries.
3.2. The Trend Breakout Strategy (S3 & R3 Breakout)
The S3 and R3 levels are excellent for trading breakouts in the direction of a prevailing macro trend. The strategy is to wait for a decisive price move beyond these key decision zones.
- Entry Trigger: Wait for a “decisive close” beyond the S3/R3 level. A decisive close means the actual body of the 15-minute or 1-hour candle closes clearly outside the level, never enter on a mere wick penetration.
- Stop-Loss (SL): Place the stop-loss just behind the broken S3/R3 level, but always add a volatility buffer (e.g., 20% of the daily ATR plus your broker’s spread) to avoid being stopped out by random intraday whipsaws.
- Take-Profit (TP): Target the R4 level for a long breakout, or the S4 level for a short breakout.
3.3. The Extreme Reversal Strategy (Failed S4/R4 Breakout)
The S4 and R4 levels are powerful for reversal setups. This setup occurs when the price attempts to break out beyond these extreme lines but fails and aggressively reverses back into the main range (TradingView, n.d.).
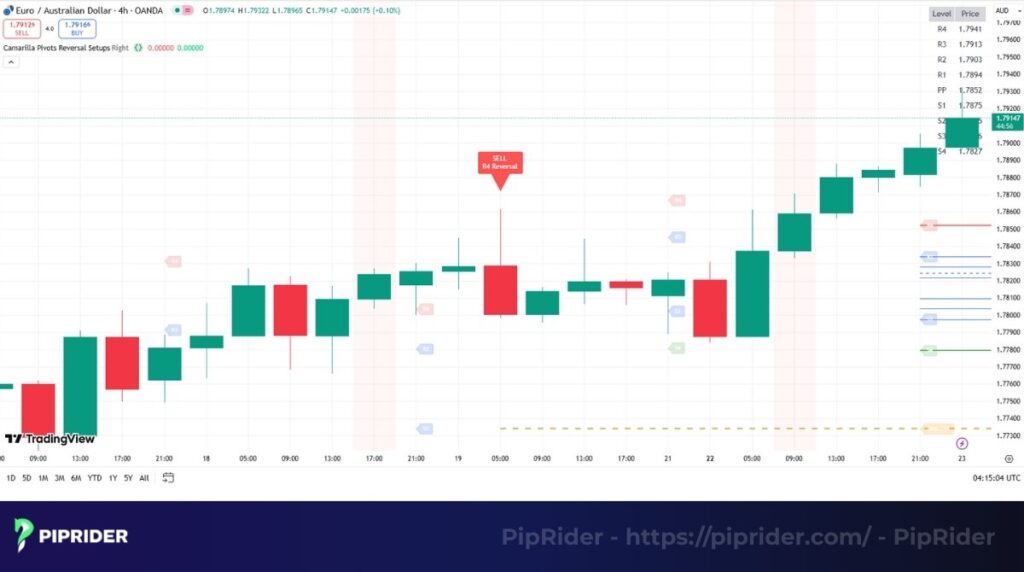
- Sell Setup: Look for the price to hit R4, fail to continue, and print a rejection candle that closes back inside (below) the R4 level.
- Buy Setup: Look for the price to hit S4, fail to continue, and print a rejection candle that closes back inside (above) the S4 level.
- Entry Trigger: Execute a market entry immediately upon the close of the signal candle that confirms the false breakout.
- Stop-Loss (SL): Placed securely outside the absolute extreme high or low (the tip of the wick) of the failed breakout candle, plus a small spread buffer.
- Take-Profit (TP): The primary target is the S3 level (for shorts) or the R3 level (for longs).
4. How to Filter False Signals & Add Confluence
The Camarilla Pivot Points Strategy is not a standalone system. Because the formula keeps support and resistance levels tightly compressed near the current price, they can often be prone to intraday market ‘noise’. To improve the reliability of these fast-paced setups, traders must seek confirmation from additional technical indicators to add confluence to their trade entries.
- Tick Volume and Volatility Context: Unlike centralized stock exchanges, the forex market is decentralized. The “volume” indicator on your MT4/MT5 chart is typically just tick volume (a proxy measuring price updates, not actual capital flow). Use it as a secondary confirmation, but prioritize the candlestick close, volatility expansion (such as a spike in the ATR), and the session context (e.g., executing only during the high-liquidity London/New York overlap).
- Moving Averages: Use them to confirm the primary trend direction. A buy signal at an S3 support level carries much higher probability if the price is also trading above a key moving average (like the 50 EMA).
- Momentum Oscillators (RSI/MACD): Look for momentum confirmation. A sell signal at an R3 resistance level is significantly more reliable if the RSI is also in “overbought” territory or showing a clear bearish divergence.
5. Pros and Cons of Camarilla Pivot Points Strategy
The primary advantage of Camarilla Pivot Points is their simplicity and suitability for day traders. Because the levels are calculated automatically and remain close to the current price, they provide clear and objective trading signals for potential entries, stop-losses, and targets, making them easy to apply as part of a rule-based plan.
However, their main disadvantage is that they can be prone to “noise” and generate false signals in highly volatile markets. For this reason, they are not a standalone system. Their reliability increases significantly when they are combined with other trading indicators, such as momentum oscillators or price action signals, to filter out lower-probability setups.
6. Camarilla Pivots vs. Other Pivot Point Systems
While all pivot points aim to identify key levels, their mathematical formulas and applications differ significantly to suit different trading styles (Investopedia, n.d.). Here’s how Camarilla Pivots compare to other popular systems:
- Camarilla Pivots vs. Classic Pivots: The main difference is proximity to price. Classic Pivots create wider, more spread-out levels. Camarilla levels are much tighter and closer to the current price, making them more suited for intraday action.
- Camarilla Pivots vs. Fibonacci Pivots: The difference is the mathematical calculations. Fibonacci Pivots use Fibonacci ratios (like 0.382 and 0.618). Camarilla Pivots use a fixed, non-Fibonacci mathematical formula.
When to choose Camarilla: The strategy is the preferred choice for day traders and scalpers due to its focus on short-term price movements. Swing or position traders often find Classic or Fibonacci pivots more suitable.
7. Advanced Tips for Using Camarilla Pivots
To take your strategy to the next level, consider these advanced tips that professional traders use to filter signals and improve their win rate.
- Use multi-timeframe analysis: Don’t trade the pivots in a vacuum. Check the higher timeframe trend (e.g., the 4-hour or daily chart). A buy signal at an S3 support level is much stronger if the overall directional bias is in a clear uptrend.
- Combine with trading sessions: Camarilla Pivots are most effective during high-volatility periods. Pay close attention to signals that form during the overlap of the London and New York trading sessions, as this is when the most significant moves often occur.
- Master the S4/R4 interaction: Because S4 and R4 are ultimate extremes, price behavior here is binary. If a strong candlestick closes completely outside S4/R4, it signals a rare but powerful breakout acceleration. However, if it pierces the level but closes back inside, it immediately triggers the Extreme Reversal Setup (Strategy 3.3). Never anticipate the move—always wait for the candle close to reveal the true market intent.
8. Frequently Asked Questions (FAQs)
9. Conclusion
In conclusion, Camarilla Pivots are a powerful and effective tool for day traders, providing a clear framework for identifying intraday reversal setups and breakouts. However, their reliability increases significantly when combined with confirming indicators and a strict capital management plan. As with any Camarilla Pivot Points strategy, we strongly recommend that you test this approach thoroughly on a demo account before risking real capital.
To continue building your trading system, explore more in-depth guides in our Trading Strategies & Risk Management category on Piprider.
Infographic Section
-
Camarilla Pivot Points Strategy -
4 Steps to Set Up Intraday Trading -
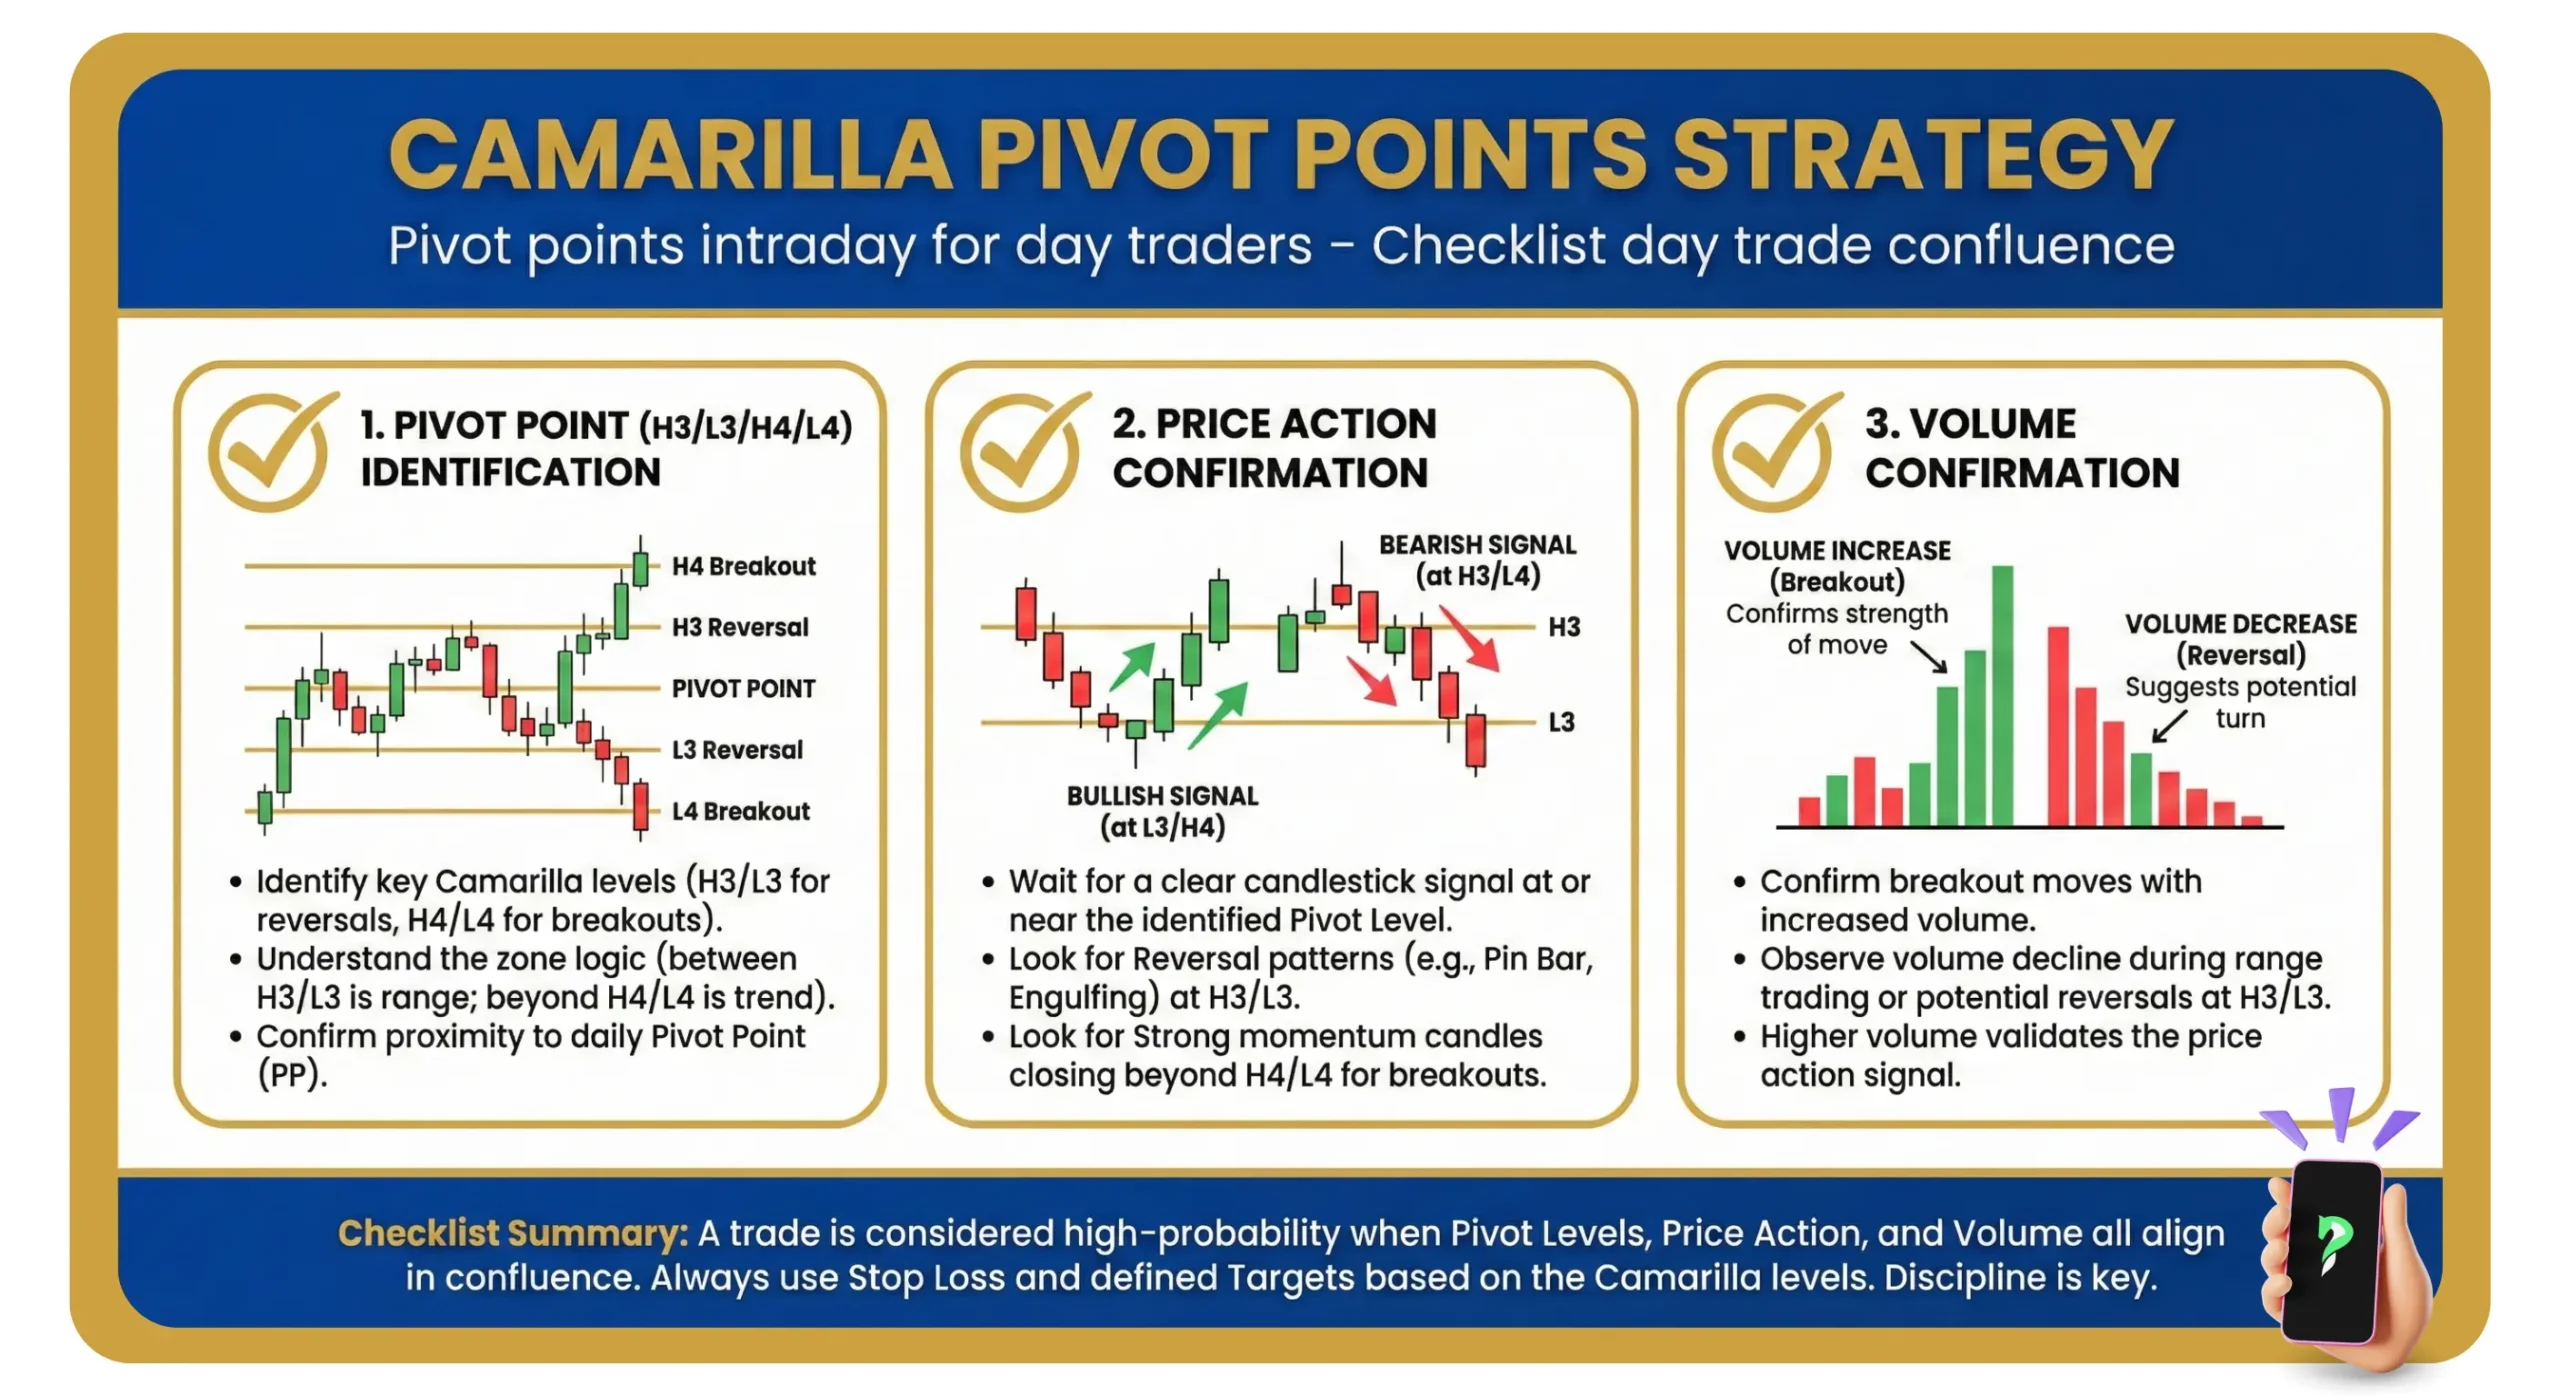
Checklist Day Trade Confluence